GAEA, a Java-based Map Applet
Dimitris Kotzinos, Poulicos Prastacos Regional Analysis Division Institute of Applied and Computational Mathematics Foundation for Research and Technology – Hellas P.O. Box 1527 71110 Heraklio Greece Phone: +30-81-391765 Fax: +30-81-391761
e-mail:
[email protected]
ABSTRACT
Internet is changing the ways data are exchanged and presented. GIS benefit form the widespread use of the internet to make geographic data accessible to everybody. GAEA (Geographic Accessories for Efficient Applications) Map Applet that is presented in this paper enhances the ability of the web browsers to present and manipulate geographic data on-line by adding full GIS functionality to them with no effort at the users’ side. The various internet GIS architectures are reviewed and the Java-based design and implementation of GAEA is presented. The capabilities of the system are explored and explained and its current and future use to real world applications is discussed. Finally some pointers for future research and enhancements are presented. Keywords
GAEA, GIS, internet GIS, digital maps, Map Applet, Java.
1.
INTODUCTION
Internet has a dramatic impact in most aspects of modern life, from talking to family and friends to ushering the information society and dramatically altering the business process in most industries. Geographic Information Systems (GIS) could not be the exception in this “rule” particularly now that the importance of the spatial component of information has been recognized. Internet has given GIS a new dimension and internet GIS is probably the most dynamically developing field of GIS research and applications’ development. GIS are information systems that deal with data that have a spatial dimension and used to manage, manipulate and present these data. They contain two types of information: spatial or cartographic data, that give the ability to present, usually in two dimensions, spatial information like the road network, area boundaries, etc. and attribute data, which are of descriptive or statistical nature, like population, traffic volumes, and others. Key feature of GIS are the capabilities, methods and procedures to combine and connect the former with the later; that are where their value resides. Internet affects GIS greatly by creating a major need for geographic information since most data have an explicit or implicit geographic association. Internet also allows accessing data that are distributed all over the world through a common user interface without obliging users to keep locally neither the data nor the software. On the other hand, some of the existing problems in traditional GIS propagate in the internet GIS. The most common problem is the existence of many formats that geographic data are stored to. This prevents users of using one single tool to view all the data they want. In the case of internet GIS the problem grows stronger since it is not easy for users to either download every time a different piece of software or install many different pieces on their local computer. The problem increases if the inability to easily transform on the fly from one format to the other is considered. This is one of the open GIS problems of these days, which is strengthened by the internet. Another problem faced by the internet GIS, but usually not by traditional GIS, is the need of creating a search engine for geographic data, with which the user will be able to find quickly and easily the information needed in a concrete and well defined manner. The distributed nature of the internet enhances the problem. Efforts to this direction have already been made and others are ongoing. The Alexandria Digital Library Project [4] tried to establish a central repository of metadata that describe geographic information of various types and to make that information publicly available. In US, the Federal Geographic Data Committee (FGDC) has created the National Geospatial Clearinghouse that offers distributed geographic data from a single entry point. These data come from different providers but they all follow the same search protocols [10]. Organizations like the Open Geodata Interoperability Specification (OGIS) [9] and European Umbrella Organization for Geographic Information (EUROGI) [3] are leading the efforts to establish rule and standards throughout the GIS community. Internet GIS have to benefit greatly from these efforts. In the next section of this paper a relatively loose definition of what an internet GIS is or should be is presented. In the following section the different methodologies for implementing internet GIS are reviewed and differences, advantages and disadvantages among the various implementation schemes discussed. Then the description of the GAEA Applet (Geographic Accessories for Efficient Applications), is presented and its design and implementation in Java is discussed. The capabilities and functionality of GAEA are presented next, followed by the discussion of various applications where it is presently used. Finally some remarks on results and future pointers for research are closing this paper.
2. VIEWING ENVIRONMENTAL DATA OVER THE WWW The dissemination of environmental data over the internet is the last act of a play which involves many actors and can potentially be a time consuming process. As in many other situations in the data publishing process three basic questions need to be answered: who produces the data, who needs them and how can they both be coordinated.
2.1 Data Producers Data can be produced by various sources. Data producers differ due to factors like the production source, the fact that data can be artificial or real, the fact that data can be observed (collected) at the real world or produced by models in a lab. This diversity in the data sources brings in new interesting research problems associated with the data manipulation and visualization. Data collected at a site are usually not very well suited for publication, especially on-line in real time. On the other hand these data are valuable for real time decision support systems. Data produced by models are easier to publish since the producers themselves directly control their format and availability.
Data producers decide on the data format, data availability (especially in cases when availability is restricted) and data storage. In earlier days data producers were also responsible for data dissemination but nowadays this is a more or less automated process, especially when the web is used as the disseminating medium. Usually environmental data are high volume data that it is not easy to transfer between the producer and the consumer, especially when a wide range of consumers is targeted.
2.2 Data Consumers In the internet era everybody is a data consumer at large. This presents new unique opportunities but also some difficulties. The difficulties arise form the mere fact that “everybody” includes non-expert users or at least users that are not expected to be able to make sense from raw data or data published in formats that are not directly intuitive. So new means, like the internet GIS described in this paper are introduced in an effort to resolve this problem and to provide end users with all tools necessary to perform on-line tasks that were performed on powerful desktop computers a few years back.
2.3 The Internet as the medium Internet is a well-suited medium for environmental data dissemination. As it is described in the next section (Section 3) it automates many tasks of data dissemination since, assuming the proper set up of the whole session, publishing the data will not just be the producers’ responsibility but the process will also involve the consumer who will be responsible for acquiring the published data. The World Wide Web allows the publication of data in a way that all users can download and use the latest dataset at possibly no cost for them except when a fee is charged for data acquisition. Apart from the timely updates the WWW offers a common user interfaced for all, enhanced when needed with plug-ins or applets. These small utilities are downloaded from the internet and are used to present the data enhancing the capabilities of standard HTML (HyperText Markup Language, the standard language of the WWW). That way an advanced user interfaced is provided to the users who usually do not need to perform any difficult setup tasks or to occupy large disk space to store the data since they can retrieve everything on-line every time they visit the corresponding site.
3. AN ARCHITECTURE FOR ENVIRONMENTAL DATA PRESENTATION ON THE WWW Disseminating environmental data on the WWW should take into consideration the different user requirements and the capabilities of the computer systems and networks. Taking into consideration the fact that the data producers and consumers will never interact directly an architecture should account for an automated way for both publishing and retrieving data on-line. Publishing can occur from distributed sources, distributed both over space and time. This calls for a unified approach in the way data are published and presented. GIS (Geographical Information Systems) at large offer the required functionality since the power of graphically presenting the information is combined with the ability to interact with spatially enabled databases, which can also be distributed. Environmental data have by nature a spatial dimension, so that in the last few years various environmental applications are heavily using GIS.
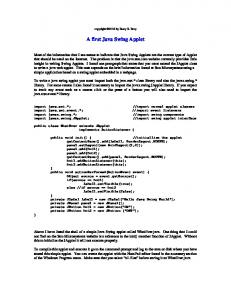
3.1 The Proposed Architecture As depicted in Figure 1 data producers can publish their data on one or more data server. The data server environment is managed by the data producer. The data can use one or more of the interfaces described in the next paragraph in order to present the data to the end users. The data provider though has to assume that the only available software to the end user is a web browser and any components additionally needed have to be provider by the data producer along with the data sets. The HTTP server will pass the user queries to the data server and the GIS data server. The GIS data server will be responsible to handle any spatially related queries and both servers will be possible to interact in order to produce a more complete result to the users. The HTTP server in many cases can be surpassed by specially developed internet programs called applets or plug-ins that will interact with both the data server and the GIS server instead. These programs can be up to a full GIS package like GAEA , the Map Applet presented in this work.
3.2 Web Interfaces
Three interfaces can be identified as widely used on the internet. The first is the tabular interface where all data are presented in tables to the user who can view or copy them either manually or by downloading them in some format. This interface conforms with the early days of the internet where the only supported format was text and images. Images can also be used for presentation. Using the image interface a better result visually can be achieved but images are static by nature and have the important drawback that the data presented cannot be used by any other software. A combination of both can provide a more appealing and useful result but it increases the work load of the data producer who needs to perform two tasks. The third interface is called throughout this work the map interface. It provides access to a GIS system on-line, either a server side or a client side system. This enables the data producer to have a single point of publication and presentation. It also provides both a graphical and a tabular representation of the data sets.
DATA CONSUMERS
User / Browser
User / Browser
User / Browser
Enviromental Data Server (*) HTTP Server
Enviromental Models
Observations (Real World Data)
DATA PRODUCERS
Geographic Data (*)
(*) Possibly Distributed Figure 1. Presenting Environmental Data on the WWW – System Architecture
4. WHAT IS AN INTERNET GIS? An internet GIS has all the capabilities and functionality of a desktop GIS, with the exception of data editing, but differs greatly from one in the sense that the necessary data and the software do not reside physically on the user’s computer. Datasets can be easily updated by the application developer on-line, and made available to all users at the same time. This gives the ability of a uniform flow of information to all users regardless of their location, something missing from the traditional GIS. For internet GIS to be established as a necessary tool for current GIS users, a complete set of GIS capabilities should be provided to them. Data editing is probably one of the GIS functions which are not necessary in the Internet component since, on the one hand, internet is a medium for disseminating information rather than creating it and since stand alone systems have extensive capabilities to handle all kinds of different types of data input capabilities like zooming in and
out, panning, restoring screen views to display the whole map, querying attribute databases and performing buffering and overlays are essential and also enough for users who do not produce but who use geographic data. These capabilities could be implemented in a way resembling traditional GIS since at least traditional GIS users are accustomed to these implementations, but could be implemented in different ways because the potential user market is not limited to the traditional GIS users but extends to include all net-surfers. Another interesting point in implementing an internet GIS is the use of the web browser as the main tool to view the data, either standalone or with the use of additional software (browser add-ons). Web browsers provide users with a friendly and familiar environment to navigate but on the other hand impose serious limitations on developers when they try to provide extended GIS functionality and mimic traditional systems. From the implementation point of view it can be argued that internet GIS resemble typical client-server systems, since users-clients request data, pieces of software or other components from the server. There can also be distributed implementations regarding either data or software components. In that case an interesting aspect would be to consider search facilities for end users taking into account the volume of available data sets that can be published on the web. An internet GIS should always provide, an interactive system giving users the ability to interact with the data as if they were on their local system. At the moment the majority of the on-line digital maps are in an image format (raster, tiff, GIF, JPEG). This has mostly to do with the nature of the web, which is static in the sense that it handles text and images. This approach offers a minimum interaction with the user where the ability of map operations like zooming (in and out) and panning is missing or limited and the ability to query spatial databases is absent.
5. ASSESSMENT OF INTERNET GIS ARCHITECTURES The available internet GIS implementations - and the respective commercial packages that follow each of them - can be divided into two broad categories; those that follow the server-side paradigm and those that follow the client-side paradigm. The internet GIS that are built as server-side, the server carries out the basic load of the operations. On the other hand, the client-side internet GIS use the client's computing power to perform the mapping operations and contact the server only to request additional data or to perform database queries.
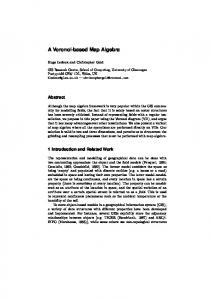
5.1 Server-side Internet GIS These schemes are implemented through the use of the Common Gateway Interface (CGI). In the early days of the internet CGI was the only way to enhance the limited capabilities the internet and the browsers provided to end users. The CGI scripts are in fact one or more programs that are executed as server processes. These processes can be either custom-made GIS packages or one of the commercially available GIS software like ArcInfo, Intergraph, etc. Based on this idea, companies like ESRI [2], MapInfo [6], Autodesk [1] and Intergraph [5] presented their own Web-based GIS products. These products (like ESRI 's MapObjects Internet Map Server) use the underlying product to create a map and save it as an image and "transmit" the image to the user through the web server and the browser. The underlying transactions among the various components of a server-side internet GIS are depicted in Figure 2. Web Browser
User Request Deliver Results
Invoke
Web Server
Translate Results to HTML
GIS Database
RDBMS
CLIENT - SIDE
Request GIS data Send GIS data
Request attribute d Send attribute data
SERVER - SIDE CGI based architecture
CGI Script
Figure 2. Server based architecture These implementation schemes usually suffer from the limited capabilities that the resulting systems can offer, since they are based on the images created on the server. They also suffer when the server load becomes higher because all the operations are being performed on the server. The server has to be contacted for every zoom in/out and panning of the user. It is clear that these implementations offer a very limited solution. Having to deal with a high traffic web site, it can be easily concluded that the problems will arise very fast. There might also be problems related to the number of licenses needed of the underlying GIS software. On the other hand a definite advantage of these implementation schemes is that the processing time is not a factor of the size of the data set, which makes these kinds of internet GIS better suited for very large data sets. Another advantage is that CGI scripting is supported by all versions and types of browsers on all platforms so that these implementations can be accessible by almost everyone with an internet connection and a web browser.
5.2 Client-side internet GIS One way to overcome some of the above described disadvantages of the sever-side internet GIS was to move some of the work load to the clients' computers. That way client-side internet GIS were created. In this category fall implementations for which users are forced to download a separate component, a program that works as an extension to the web browser. This component works usually as a program within the browser and in cooperation with the browser handles user requests. The problems that can be found here are of two types: problems that have to be dealt on the user's side (and usually are the most significant) and problems that have to be dealt on the developer's side. The basic problem on the users’ side is that they are forced to download and usually install a new component into their system, something that most users do not welcome. On the developer's side the problem has to do with supporting different browsers on different platforms. To both problems Java-based implementations give a definite answer because applets written in Java are downloaded to the user's computer but do not need any installation, they run into the browser's memory space and are unloaded when the page that they're contained in is unloaded. Furthermore Java has reintroduced the “write once, run everywhere” claim, so applets can be run on any platform and almost any browser without any major effort for redeveloping. ESRI 's ArcView Internet Map Server is a Java based solution, as well as it is GAEA. 5.2.1 ActiveX Controls and Plug-ins On Microsoft platforms and Internet Explorer ActiveX controls should be used to extend browser capabilities. MapInfo's MapX and Intergraph's GeoMedia offer an ActiveX based solution. But ActiveX controls will not work if the client is a UNIX or Mac computer even if it uses Internet Explorer. Netscape Navigator with various plug-ins could be used instead, but in that case a different version for each of the client's possible platforms should be provided. This makes keeping up with developments in browsers' technology difficult, forces reinstallation of the component each time an upgrade is available, an annoying issue for users, and gives a different "look-and-feel" on different client platforms. 5.2.2 Java Applets The Java-based solution on the other hand does not deal with all the installation and upgrade problems, since every time users access the web page get the latest version of the applet. The only pitfall is that this can be time consuming during downloading, but can be easily dealt with if the size of the applet is small and the applet is compressed and packaged in a single file. The Java applets also have a unique "look-and-feel" since the Java language offers the same cross-platform and cross-browser implementation.
6. DESIGN AND IMPLEMENTATION OF THE JAVA-BASED GAEA GAEA is a map applet developed at the Regional Analysis Division of the Institute of Applied and Computational Mathematics of FORTH. The GAEA implementation targeted four basic areas: • make a product that will require no user interaction for download and need no installation, • have that product running on all available platforms and browsers with a minimum effort, • achieve an as fast as possible operation regardless of the server load and • leave the system architecture open for future enhancements and variations As mentioned before the Java GAEA Applet is downloaded to the user's computer with a base layer from the data-set. The remaining layers in the data set reside on the server and are downloaded only after specific user requests. The applet
also contacts the server when additional information is needed form the database, which is the case when a thematic map is generated or when the results of a query are visualized. On the server-side resides an application, written also in Java, which interfaces the applet and the RDBMS (Relational Database Management System) running on the server. This application passes the user requests to the RDBMS and passes back the RDBMS 's responses to the applet formatted in a way that can be easily used by the applet. The above-described architecture is depicted in Figure 3. The applet contacts the web server only when a new layer of geographic data or an entirely new data set is requested by users. All transactions that include the database are handled by the Java application that runs on the server and is described in detail later on. In this way the web server is relieved from significant workload.
Web Browser
applet request send applet
request GIS data
GIS applet
request attribute send attribute
Server
middleware data
RDBMS
Figure 3. GAEA architecture
6.1 The server platform Since GAEA is implemented in Java, it can run on both UNIX and Microsoft Windows NT™ server platforms. The implementation on the Windows NT Server™ operating system has as advantage the ability to use as RDBMS any ODBC compliant database. This ensures the open architecture of the system and does not tie it to any of the existing commercial RDBMS. On the other hand transferring GAEA to a UNIX server is relatively straightforward. In the tests using a UNIX server, ORACLE was the RDBMS of choice.
6.2 The RDBMS A server side Java application was developed to facilitate the connection between the applet and the RDBS. This Java application runs on the server constantly and acts as middleware between the applet and the database. If the system uses an ODBC-compliant database then the application uses the available in the standard Java Development Kit (JDK) 1.1 implementation JDBC-ODBC bridge to access the database. This is because Java cannot interact directly with any ODBC database due to its cross-platform implementation. Otherwise the application uses the JDBC drivers provided by the RDBMS vendor. In general any RDBMS that has available JDBC drivers or is ODBC-compliant can be used. As described graphically in the Figure 4, for every request from the applet the middleware application starts a new thread on the server and this thread is connected through a standard socket with the applet on the client's machine. When the database results are returned the socket closes and the thread stops executing.
Returns new data
Creates Socket Spawns new process
Request for attribute data
Server Process
Figure 4. Processing of applet requests by the middleware In the database every different layer of geographic information corresponds to a separate table. For every table there is also an additional table that contains information on the variables contained in the database's tables. For every variable, information is kept on if it can be used for thematic maps or queries, if it should be available to the users, etc. Especially for an NT-based implementation the middleware application has been rewritten in Microsoft™ Visual Basic®. By using Microsoft™ WebClasses a DLL has been developed that acts as an HTTP interface and returns query results from the specified database in a prespecified text format. The whole operation remains the same but this implementations does not use sockets so it overcomes observed problems related to the existence of firewalls at the user site.
6.3 The format of the geographic data GAEA uses geographic data that comply with the MapInfo™ Interchange Format (MIF) which is an industry standard format, developed by MapInfo but now widely used. This format keeps the data in text files that make their reading easy. Another advantage is that there are converters from almost all different known geographic data formats (e.g. ArcInfo Shapefile, AutoCAD DXF, etc.) to MIF. The geographic layers are described in a separate file that is different for every data set. For each map the available layers are described, the tables associated with each one are named and various other useful pieces of information are kept there and read when the data-set to be load is determined. The data files and the descriptive file are then packed using the Java Archive (JAR) format. This format allows the application developer to compress the files with a ratio of about 40% reducing the download time significantly. Moreover the GAEA map applet downloads the necessary files in a single HTTP transaction reducing the network and server load and achieving faster replies. Tests run proved that the overall download time was reduced but if all data files were packed in a single JAR file sometimes (depending on the total size of these files) the initial download time was slightly increased. More tests are being conducted so that the optimal balance between packaging all files in a single JAR file and downloading each one separately can be determined.
6.4 Security issues Java has its own security model which is implemented in the Java Virtual Machine (JVM). The Java Virtual Machine is an environment within the browser where the Java applets run. All restrictions implied by the security model of the JVM cannot be violated by any applet. So both the user and the applet are safe to use and perform any operations. The server middleware application is also built with the security concerns in mind. This application besides using standard sockets, which are used by all systems for many years now and provide a medium level of security, encodes the data exchanged between the server and the applet and moreover authenticates that the requests come from a GAEA applet by using specific passwords. All these make the system robust enough and trustworthy, moreover no problems have been reported so far.
6.5 Displaying Maps: Graphics & Algorithms Java provides a collection of classes that deal with graphics operations. These classes and the corresponding methods contained within were used and extended where necessary. The handling of graphics in GAEA is extremely fast and robust and users benefit from it when performing mapping operations like zoom in/out, panning, etc.
For operations like zooming (in and out), panning, etc. algorithms were developed and calibrated so as to perform efficiently. These algorithms are part of the GAEA system along with others that correlate the point on the screen the user clicks on with an object and others that deal with proximity analysis issues.
7. CAPABILITIES OF GAEA Users have a complete range of GIS capabilities when accessing a web site implemented with GAEA. They can view and manipulate a vector map of the area under consideration. After downloading the applet and the initial layer of the maps users can: Zoom In, dynamically users select the area for zooming Zoom Out, dynamically users select the area for zooming Pan, users select a new center for the map Return the map in its initial state Add new layers During zooming operations users draw a rectangle that defines the area to be zoomed. The zooming operations have no actual limitations. By using the panning feature users can move the map around their screen just by defining the center of the map with a simple click. All of the above operations are performed entirely on the user's computer so they are extremely fast. Users can also interact with the database that resides on the server and can: Get information on specific objects on the map Load and unload additional layers, as many as are available Create a thematic map based on a variable he/she chooses Perform a query and visualize the results on the map Probably the most important part of the GAEA Applet capabilities is the ability to obtain information on objects like polygons, lines and points (objects in general) that are on the map. Users can select the layer on which they want to perform operations and specific actions to be taken. In the present version only one layer can be selectable at any given time. Approaches that allow selection from different layers will be implemented in future versions of the system. By identifying objects on the map the system accesses a spatially enabled database to get additional information or to calculate distances or other geographic related data. For the creation of the thematic maps users have a range of choices. First, the variable under consideration is chosen. Then users can choose how the interval of values of this variable will be broken. Both the number of intervals (2 - 9) and the way the intervals will be chosen, i.e. if one wants to break the initial interval in equal parts or wants to have parts that contain the same number of map objects. This gives users a much bigger flexibility and the ability to define what they want to see and to create thematic maps in different ways so that they can better visualize data returned by the server. Performing queries is also a highly customizable task. Users can choose up to four (4) different variables to perform a combined query. When a variable is chosen the available minimum and maximum values for that variable are shown so that users can perform a meaningful query. Users can choose if the areas to be visualized will be greater than, equal or less than the specified value for each variable. The same variable can also be used multiple times so that users can restrict the interval in which the query is performed. The variables participating in the query have all to fulfill the criteria specified by the user (i.e. are joined with "and").
8. USING GAEA IN APPLICATIONS The GAEA internet GIS has been used so far in an EU funded project named TEMISIA. GAEA provided GIS functionality to a web site dealing with the industrial areas of Europe and the opportunities to invest in anyone of them. The site includes various levels of information (European, Regional, Industrial Area) and GAEA provides geographic display and query capabilities in all of them. Users have the ability to point-n-click to get information on specific areas, to make queries by setting their own criteria and visualize results at any level. GAEA ’s open architecture has enabled all partners of the project to maintain mirror sites at minimum cost and effort. The available site to access and check some of the GAEA capabilities is at: http://www.temisia.org.gr/ GAEA is also been used to an ongoing research effort to depict on the Internet the real time traffic conditions of a city. Problems that are still under review include integration of GAEA with real time traffic databases, and the integration with traffic models that can provide traffic load prediction and incident management capabilities to the system. Since Java usually creates applets that have a small footprint it might be possible to develop with GAEA an in-vehicle navigation
and information system. The key to the success of such an effort will be, apart from the ability to transmit reliable data, the tight integration with systems that the user is accustomed to using like cellular phones and the web browsers. GAEA is also used as the visualization tool of a real-time monitoring system that gives the status and position of the Medical Emergency Vehicles of the city of Heraklio, Crete, Greece. In this system the coordinate data come from GPS receivers installed in the ambulances and along with other descriptive data, such as the availability of the vehicle, the severity of the incident, etc are stored in a real-time database. GAEA then queries the database at given intervals and refreshes the position and other vehicle related information on screen. An interesting point to be made here is that this system is not an internet based system but rather a distributed system since the database reside in a different computer than the one used for the visualization. Other applications which are presently in their preliminary stages of development with GAEA include: • implementation of sites with city information (streets, stores, gas stations etc.) similar to those offered in the USA by MapQuest (www.mapquest.com) and Vicinity (www.vicinity.com), • display of environmental databases for coastal areas management and • accessing numerical models for water resources management and display of the results on maps. For the applications described above GAEA is a vital part, but it is not the only. It has to be pointed out strongly that, assuming that the GAEA offers adequate capabilities for the application under consideration, a great deal of time, resources and effort should be placed to achieve a tight integration among the various components of a live system on the Internet.
9. FUTURE EXTENSIONS GAEA can be viewed in principle as a collection of procedures that will provide GIS functionality to any web site. It is a highly customizable tool that enables web servers to serve “live” geographic data. So various add-on modules can be created to enable GAEA to perform socioeconomic analysis of the various data provided by the server. This can include modules that deal with decision support provided to managers, for marketing reasons and other of that type. Modern desktop GIS usually provide separate modules that the end users buy according to their needs. The same can be implemented on the Internet with GAEA; only this time users will download extra modules from the internet as subcomponents of the GAEA system, without any installation or configuration effort. Another need that is identified but not implemented yet is the connection between GAEA and fully multimedia databases. Applications implemented so far have made use of images but other multimedia capabilities like sound, video and animation have not been implemented and used yet. All of the above are restricted or helped by the growth rate of the internet and the networks at large. If the networks keep growing at the current rate the extensions that can be implemented in an internet GIS like GAEA will be numerous since the need to spatial enable data will grow and limitations imposed by inadequacies of the networks’ bandwidth will be eliminated.
REFERENCES [1] Autodesk. Web site at www.autodesk.com 1999. [2] ESRI. Web site at www.esri.com 1999. [3] EUROGI. Web site at www.eurogi.org 1999. [4] Frew, J. et al. "The Alexandria Rapid Prototype: building a digital library for spatial information". Proceedings of the 1995 ESRI User Conference, May 22-25, 1995. [5] Intergraph. Web site at www.intergraph.com 1999. [6] MapInfo. Web site at www.mapinfo.com 1999. [7] Martin, D. Geographic Information Systems, Second Edition, New York, NY, USA: Routledge 1996. [8] Newman, A. et al. Special Edition Using Java, Second Edition, Indianapolis, IN, USA: QUE Corp. 1996. [9] Open GIS Consortium, Inc. Web site at www.opengis.org 1999. [10] Peng, Z. and Douglas, D.N. An Internet-Based GIS Data Access System" Journal of Urban and Regional Information Systems, Spring 1997. [11] Rienhart, M. Java Database Development, Berkeley, CA, USA: McGraw-Hill. 1998