Bibliometric analysis of social capital research during 1956 to 2008 Chi-Yen Yin, Johannes K. Chiang
Bibliometric Analysis of Social Capital Research During 1956 to 2008 Chi-Yen Yin*, Johannes K. Chiang Department of Management Information Systems, National Chengchi University Taipei, 116, Taiwan
[email protected],
[email protected] doi: 10.4156/jcit.vol5.issue2.14
2. Methodology
Abstract
This research utilized the Social Sciences Citation Index (SSCI) which supported by ISI, Web of Science, the product created by the Thomson Scientific, Philadelphia, PA, USA. Although other databases such as Business Source Complete (EBSCOhost), Library and Information Science Abstract (LISA), Scirus, CBCA Business (ProQuest), are also available for bibliometric analysis, SSCI is adopted because it is recognized as the leading English language supplier of literature services providing access to the published information in the multidiscipline fields of social science and research. Moreover, it is the only database that affords a comprehensive citation data of the published literature. The ISI Web of Science SSCI database currently covered approximately 2,000 world leading scholarly social science journals and periodicals from 1956 to date which nearly 2,700 pens information is updated weekly. The database can not only search the database from the general way through the subject, title and author then to find the information, the most important features are through the author cited in the references, patents and so on, as what search terms to be found by the authors quoted in a certain specific articles or books, patent information. Cited reference searching is an unique tool can also be applied: to find who cited an article to be written a new paper published, which means that the findings of this article is affecting the younger research direction; ancestors based on the study path of evolution as a research guidelines; understanding of the situation and so on peer research. For the present research the time span of the SSCI available is from 1956 through 2008. Each record at the SSCI database contains an English language title and descriptive abstract, together with full bibliographic information. The bibliographic information includes the periodicals or other publication title, the authors’ name, funding agency, affiliation/institution and country/territory, document type, language and so on.
The objective of this research primary describes the trend analysis of international periodicals and literatures which titles as well-known “Social Capital” at SSCI database from 1956 to 2008. The result of this paper inferred that the literature production on social capital has reached highly growth in the last 10 years. The distribution of author productivity does not follow by Lotka’s Law. The applications of social capital are mainly in consisting of the following research aspects: sociology; economics; public, environmental and occupational health; political science; planning and development; management; business; social sciences and interdisciplinary. The literatures of social capital usually were generated by multiple authorships.
Keywords Social capita; Lotka’s law; Literature productivity
1. Introduction The topic of social capital began a full exploration of all the possibilities in every research aspect in last twenty years. This paper was applied the bibliometric methodology toward onto literature productivity review and trend analysis. Social capital has recently gained importance in a variety of research aspects. The concept was originally introduced by sociologists and political scientists. Scholars in organizational and managements sciences have shown an increased interest in the concept. Social capital is about the value derived from being a member of a society or community. Although the concept of social capital has a much longer existence (cf. Hanifan, 1916), it has become a prominent topic of discussion over last two decades. Its emergence within the fields of political analytic perspective on economic activities that is immanent in the neoclassic school of macroeconomic thinking (e.g. Bourdieu, 1986; Granovetter, 1985; Uzzi, 1997).
124
Journal of Convergence Information Technology Volume 5, Number 2, April 2010
3. Research finding and Discussion
NC: Number of Citations
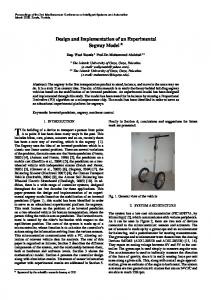
The result is total 1,948 indexes of literature was retrieved which titles are selected as “Social Capital” from 1956 through 2008 as the primary parameter for literature productivity analysis, shown as Figure 1. The other analyzed parameters for this research which include authorship, country/territory, funding agency, document type, institution name, language, publication year, source title and subject area. The abstract of literature, number of times cited, and reprint author’s address are also acquired for citation analysis and historical review.
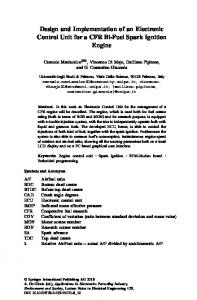
3.1 Social Capital historical analysis Figure 2. Citations in each year (Time span from 1991 through 2008)
The earliest literature relates to social capital topic was discovered at SSCI database which published on Journal of Finance. And the title of this book review is “Foreign-Capital in Latin-America – United-NationDept-Econ-Social-Affairs” (Dernburg, 1956).
Table 1. Distribution of publication year
3.1.1 Distribution by publication year, document type and language Obviously, the literature production of social capital increased up since 1997. The citation was also increased steady and gradually by every year, displays as Figure 2. In the recent 5 years, it found that a lot of research publications between 2004 and 2008, which reached the record counts in terms of 160 (8.21%), 185 (9.50%), 214 (10.99%), 252 (12.94%), and 247 (12.68%), respectively, shows as Table 1. In SSCI database, articles comprise as the majority published document type of social capital, refer to Table 2. The major distribution of language segmentation, it observed English is the most popular language for article publication, display as Table 3.
NP: Number of Publications
Year
Figure 1. Annual publication distribution and trend line (Total publications: 1,948 indexes)
125
Publication Year
NP
PT
1956
1
0.05%
1959
1
0.05%
1960
5
0.26%
1961
1
0.05%
1962
2
0.10%
1963
2
0.10%
1965
1
0.05%
1966
10
0.51%
1967
8
0.41%
1968
2
0.10%
1970
4
0.21%
1971
1
0.05%
1972
1
0.05%
1974
3
0.15%
1975
5
0.26%
1976
7
0.36%
1977
7
0.36%
1978
6
0.31%
1979
6
0.31%
1980
4
0.21%
1981
6
0.31%
1982
6
0.31%
1983
4
0.21%
1984
8
0.41%
1985
6
0.31%
1986
7
0.36%
1987
4
0.21%
Bibliometric analysis of social capital research during 1956 to 2008 Chi-Yen Yin, Johannes K. Chiang
1988
3
0.15%
Czech
5
0.26%
1989
10
0.51%
Croatian
4
0.21%
1990
8
0.41%
Russian
4
0.21%
1991
10
0.51%
Spanish
4
0.21%
1992
5
0.26%
Norwegian
3
0.15%
1993
6
0.31%
Portuguese
3
0.15%
1994
11
0.56%
Slovak
2
0.10%
1995
22
1.13%
Swedish
2
0.10%
1996
22
1.13%
Danish
1
0.05%
1997
34
1.75%
Hungarian
1
0.05%
1998
60
3.08%
Polish
1
0.05%
1999
76
3.90%
Turkish
1
0.05%
2000
100
5.13%
2001
105
5.39%
NP: Number of Publications PT: Percentage of 1,948
2002
145
7.44%
2003
155
7.96%
2004
160
8.21%
2005
185
9.50%
2006
214
10.99%
2007
252
12.94%
2008
247
12.68%
3.1.2 Distribution by country/territory and institution name
1,318
67.66%
Table 4 completely shows the distribution of publication by country and territory. The USA, England, Canada, Australia, Sweden, Germany, Netherlands, Scotland, Finland and France are the top 10 countries which publish the most articles on social capital in last 15 years. Listing publication by the institution name, Table 5 indicates Harvard University (USA), Lund University (Sweden), University of North Carolina (USA), University of Chicago (USA) and University of Toronto (Canada) are top 5 institutions on social capital publication.
Book Review
255
13.09%
Table 4. Distribution of top 30 countries/territories
Proceedings Paper
173
8.88%
Rank
NP
PT
Review
71
3.64%
1
USA
874
44.87%
Editorial Material
65
3.34%
2
England
296
15.20%
Meeting Abstract
44
2.26%
3
Canada
126
6.47%
Letter
10
0.51%
4
Australia
104
5.34%
Note
6
0.31%
5
Sweden
72
3.70%
Correction
4
0.21%
6
Germany
58
2.98%
Bibliography
1
0.05%
7
Netherlands
52
2.67%
Correction, Addition
1
0.05%
NP: Number of Publications PT: Percentage of 1,948 Table 2. Distribution of document type Document Type Article
NP
PT
Country/Territory
8
Scotland
34
1.75%
NP: Number of Publications
9
Finland
29
1.49%
PT: Percentage of 1,948
10
France
27
1.39%
11
Denmark
26
1.33%
12
Italy
25
1.28%
13
Switzerland
23
1.18%
14
Peoples R China
21
1.08%
15
South Africa
19
0.98%
Table 3. Distribution of language Language
NP
PT
English
1,849
94.92%
German
40
2.05%
French
28
1.44%
126
Journal of Convergence Information Technology Volume 5, Number 2, April 2010
16
Norway
18
0.92%
16
Spain
18
0.92%
16
Taiwan
18
0.92%
19
Israel
17
0.87%
19
Japan
17
0.87%
21
New Zealand
13
0.67%
21
Wales
13
0.67%
23
Belgium
12
0.62%
23
North Ireland
12
0.62%
25
South Korea
11
0.56%
26
Austria
10
0.51%
27
India
9
0.46%
28
Ireland
8
0.41%
29
Singapore
7
0.36%
30
Brazil
6
0.31%
30
Greece
6
0.31%
164
8.42%
Other Countries
Other Institutions
3.1.3 Distribution by source title Table 6 shows that “Social Science & Medicine”, “World Development”, “American Behavioral Scientist”, “Urban Studies”, “Health & Place”, “Journal Of Interdisciplinary History”, “Social Forces”, “Social Science Quarterly”, “American Journal Of Sociology” and “Contemporary Sociology-A Journal Of Reviews” are the top ten journals with the most publications in social capital research aspect. Table 6. Distribution of source title NP
PT
Social Science & Medicine
Source Title
83
4.26%
World Development
24
1.23%
American Behavioral Scientist
20
1.03%
Urban Studies
18
0.92%
Health & Place
16
0.82%
Journal Of Interdisciplinary History
16
0.82%
3.34%
Social Forces
16
0.82%
15
0.77%
Table 5. Distribution of top 20 institution names 1
Institution Name Harvard Univ.
Nationality NP USA
65
30.14%
NP: Number of Publications PT: Percentage of 1,948 IO: International Organization
NP: Number of Publications PT: Percentage of 1,948
Rank
587
PT
Sweden
29
1.49%
Social Science Quarterly
USA
25
1.28%
American Journal Of Sociology
14
0.72%
Univ. Chicago
USA
24
1.23%
Contemporary Sociology-A Journal Of Reviews
14
0.72%
Univ. Toronto
Canada
24
1.23%
American Journal Of Public Health
13
0.67%
USA
23
1.18%
European Journal Of Public Health
13
0.67%
13
0.67%
2
Lund Univ.
3
Univ. North Carolina
4 4 6
Ohio State Univ.
6
Univ. Manchester
6
Univ. Michigan
England
23
1.18%
Journal Of The American Planning Association
USA
23
1.18%
Policy Sciences
13
0.67%
13
0.67%
Canada
21
1.08%
Rural Sociology
Univ. Penn
USA
21
1.08%
Journal Of Epidemiology And Community Health
12
0.62%
9
Univ. British Columbia
9 9
Univ. Wisconsin
USA
21
1.08%
Regional Studies
12
0.62%
12
Michigan State Univ.
USA
20
1.03%
Academy Of Management Journal
11
0.56%
13
Arizona State Univ.
USA
18
0.92%
Acta Sociologica
11
0.56%
11
0.56%
13
Univ. Calif. Berkeley
USA
18
0.92%
American Journal Of Agricultural Economics
13
Univ. Maryland
USA
18
0.92%
International Small Business Journal
11
0.56%
16
Univ. Minnesota
USA
17
0.87%
Journal Of Economic Issues
11
0.56%
16
Univ. Nottingham
England
17
0.87%
Sociological Review
11
0.56%
18
Northwestern Univ.
19
Univ. Cambridge
20
Cornell Univ.
USA
16
0.82%
Academy Of Management Review
10
0.51%
England
15
0.77%
American Sociological Review
10
0.51%
USA
14
0.72%
British Journal Of Sociology
10
0.51%
10
0.51%
10
0.51%
20
Univ. Oxford
England
14
0.72%
Economic Journal
20
World Bank
IO
14
0.72%
European Sociological Review
127
Bibliometric analysis of social capital research during 1956 to 2008 Chi-Yen Yin, Johannes K. Chiang
Nonprofit And Voluntary Sector Quarterly
10
0.51%
6
0.31%
6
0.31%
0.46%
Journal Of Community Psychology Journal Of Institutional And Theoretical Economics-Zeitschrift Fur Die Gesamte Staatswissenschaft Journal Of Marriage And The Family
Political Studies
10
0.51%
Development And Change
9
0.46%
Ethnic And Racial Studies
9
Housing Policy Debate
9
6
0.31%
0.46%
Journal Of Rural Studies
6
0.31%
Journal Of Development Studies
9
0.46%
Rationality And Society
6
0.31%
6
0.31%
Political Psychology
9
0.46%
Scandinavian Journal Of Public Health
Social Science Research
9
0.46%
Sociological Inquiry
6
0.31%
Sociology Of Education Sociology- The Journal Of The British Sociological Association British Educational Research Journal
9
0.46%
6
0.31%
9
0.46%
6
0.31%
8
0.41%
Sociological Quarterly Tijdschrift Voor Economische En Sociale Geografie Youth & Society
6
0.31%
Business History
8
0.41%
American Historical Review
5
0.26%
Gesundheitswesen
8
0.41%
American Journal Of Preventive Medicine
5
0.26%
Journal Of Business Ethics
8
0.41%
0.26%
8
0.41%
5
0.26%
Revue Francaise De Sociologie
8
0.41%
American Political Science Review Canadian Journal Of Development Studies-Revue Canadienne D Etudes Du Developpement Comparative Politics
5
Journal Of Urban Affairs
5
0.26%
Social Indicators Research
8
0.41%
Entrepreneurship Theory And Practice
5
0.26%
Social Networks
8
0.41%
Environment And Planning A
5
0.26%
Theory And Society
8
0.41%
Europe-Asia Studies
5
0.26%
Urban Affairs Review
8
0.41%
International Affairs
5
0.26%
American Economic Review
7
0.36%
International Social Work
5
0.26%
Australian Journal Of Social Issues
7
0.36%
Journal Of African Economies
5
0.26%
Ecological Economics
7
0.36%
Journal Of Health Psychology
5
0.26%
Industrial Marketing Management International Journal Of Urban And Regional Research Journal Of Ethnic And Migration Studies
7
0.36%
Journal Of Information Technology
5
0.26%
7
0.36%
Policy And Politics
5
0.26%
7
0.36%
Political Behavior
5
0.26%
Journal Of Leisure Research
7
0.36%
Politics & Society
5
0.26%
Kyklos
7
0.36%
Problems Of Economics
5
0.26%
5
0.26%
Organization Science
7
0.36%
Ps-Political Science & Politics
Progress In Human Geography
7
0.36%
5
0.26%
Science & Society
7
0.36%
5
0.26%
Sociological Research Online
7
0.36%
Quarterly Journal Of Economics Social Science Information Sur Les Sciences Sociales Sociologia Ruralis
5
0.26%
Strategic Management Journal
7
0.36%
Sociological Perspectives
5
0.26%
Administrative Science Quarterly
6
0.31%
Sotsiologicheskie Issledovaniya
5
0.26%
American Journal Of Political Science Annals Of The American Academy Of Political And Social Science Australian And New Zealand Journal Of Public Health British Journal Of Political Science
6
0.31%
6
0.31%
6
0.31%
6
0.31%
British Journal Of Psychiatry
6
0.31%
Economic Development And Cultural Change
6
0.31%
Economic History Review
6
0.31%
International Journal Of Epidemiology
6
0.31%
International Journal Of Social Welfare
6
0.31%
Other Source Titles
1,009
NP: Number Of Publications PT: Percentage of 1,948 3.1.4 Distribution by subject category Table 7 displays that “Sociology”, “Economics”, “Public, Environmental & Occupational Health”, “Political Science”, “Planning & Development”, “Management”, “Business”, “Social Sciences,
128
Journal of Convergence Information Technology Volume 5, Number 2, April 2010
Interdisciplinary” and “Urban Studies” are the top ten categories with the most frequently publications in social capital research aspect. Table 7. Distribution of subject category Subject Area
Environmental Sciences
15
0.77%
Family Studies
15
0.77%
Hospitality, Leisure, Sport & Tourism
15
0.77%
Industrial Relations & Labor
11
0.56%
Pediatrics
11
0.56%
NP
PT
Sociology
360
18.48%
Women's Studies
11
0.56%
Economics
277
14.22%
Ecology
10
0.51%
Public, Environmental & Occupational Health
225
11.55%
Ethics
10
0.51%
Political Science
156
8.01%
Gerontology
10
0.51%
10
0.51%
Planning & Development
151
7.75%
Psychology, Developmental
Management
139
7.14%
Rehabilitation
10
0.51%
9
0.46%
Business
138
7.08%
Operations Research & Management Science
Social Sciences, Interdisciplinary
125
6.42%
Religion
8
0.41%
Urban Studies
93
4.77%
Social Sciences, Mathematical Methods
8
0.41%
Social Sciences, Biomedical
91
4.67%
Engineering, Industrial
7
0.36%
Environmental Studies
79
4.06%
Sport Sciences
7
0.36%
7
0.36%
Education & Educational Research
78
4.00%
Substance Abuse
Geography
71
3.64%
Agriculture, Multidisciplinary
6
0.31%
Public Administration
58
2.98%
0.31%
50
2.57%
5
0.26%
Area Studies
48
2.46%
Psychology Computer Science, Interdisciplinary Applications Education, Special
6
Social Issues
5
0.26%
Information Science & Library Science
48
2.46%
Geriatrics & Gerontology
5
0.26%
History
40
2.05%
Humanities, Multidisciplinary
5
0.26%
Social Work
36
1.85%
Psychiatry
33
1.69%
NP: Number of Publications PT: Percentage of 1,948
Anthropology
32
1.64%
Health Policy & Services
32
1.64%
Psychology, Clinical
32
1.64%
Psychology, Social
29
1.49%
Psychology, Multidisciplinary
27
1.39%
Communication
24
1.23%
History Of Social Sciences
24
1.23%
Computer Science, Information Systems
22
1.13%
Ethnic Studies
21
1.08%
Criminology & Penology
20
1.03%
International Relations
20
1.03%
Health Care Sciences & Services
19
0.98%
Psychology, Applied
18
0.92%
Agricultural Economics & Policy
17
0.87%
Law
17
0.87%
Nursing
17
0.87%
Demography
16
0.82%
Medicine, General & Internal
16
0.82%
Business, Finance
15
0.77%
Based on the retrieved information, the current social capital research has been reached to the mature stage, the majority of publication outputs are in North America, UK, European countries. China, Taiwan, Japan, South Korea, and Singapore, are the top 5 countries for literature production on social capital in Asia. The subject of social capital has been research highly research growth since year 2000. It is to strengthen the association of social network which accelerated by the popularization of Internet. The subject of social capital has become the most popular topic in the world. The United Nations (UN), the Organization of Economic Cooperation and Development (OECD), the World Bank (WB), the European Union (EU) and other international organizations are actively called on Governments, as well as highly developed countries should invest heavily in making such as social sciences and interdisciplinary, economics, and environmental studies research areas which applied social capital subject to study various natural, social, political and economic phenomenon, and present their related
129
Bibliometric analysis of social capital research during 1956 to 2008 Chi-Yen Yin, Johannes K. Chiang
finding in order to enhance vision and scope of human knowledge in the near future.
10
1
10
61
1.63%
3
0.10%
8
3
24
85
2.27%
6
0.20%
4. The Literature Productivity Analysis of Social Capital by Lotka’s Law
7
3
21
106
2.84%
9
0.30%
6
8
48
154
4.12%
17
0.57%
This section was mainly analyzed the distribution of literature productivity by author which certificated by Lotka’s law. Table 8 shows that the distribution of top 10 author’s contribution. Meanwhile, it calculates the quantity of author by the equality method from 1,948 literatures which retrieved by indexes on SSCI database. That is indicated that the degree of contribution of each author in one literature is equivalent, which could be calculated separately. Thus, it obtained altogether 2,989 of authors on social capital research aspect. Refer to Table 9.
5
17
85
239
6.40%
34
1.14%
4
30
120
359
9.61%
64
2.14%
3
73
219
578
15.47%
137
4.58%
2
307
614
1,192
31.90%
444
14.85%
1
2,545
2,545
NP: Number of Publications A: Author(s) SNP: Sum of Publications CNP: Cumulation of NP PTCNP: Percentage of CNP CA: Cumulative number of Author(s) PACA: Percentage of CA
Table 8. Distribution of top 10 author’s contributions Ra nk
Author
3,737 100.00% 2,989 100.00%
Nationality Institution NP PT
1 LINDSTROM, M
Sweden
2 KAWACHI, I
USA
3 HARPHAM, T
England
4 BURT, RS
USA
4 MERLO, J
Sweden
4 SAVAGE, M
England
7 KENNEDY, BP
USA
7 MCKENZIE, K
England
SUBRAMANIA 7 N, SV 10 BEAUDOIN, CE 10 CAMPBELL, C
7
0.36%
USA
Tulane Univ. London Sch. Econ
6
0.31%
6
0.31%
Tulane Univ.
6
0.31%
6
0.31%
6
0.31%
6
0.31%
6
0.31%
6
0.31%
USA
10 EDWARDS, B
USA
10 PUTNAM, RD SVENDSEN, 10 GLH
USA
10 WOOLCOCK, M
Harvard Univ. 23 1.18% London South 10 0.51% Bank Univ. Univ. of 8 0.41% Chicago Lund Univ. 8 0.41% Univ. 8 0.41% Manchester Harvard Univ. 7 0.36% Royal Free & 7 0.36% UCL Med Sch. Harvard Univ.
England
Denmark Canada USA
4.1 Lotka’s Law
28 1.44%
USA
CANNELLA, 10 AA
10 VEENSTRA, G
Lund Univ.
E Carolina Univ. Harvard Univ. So Univ. Univ. British Columbia World Bank
The research of discipline literature author distribution and productivity, may utilize the Lotka’s law to discuss on it. The Lotka’s law is called “a reverse square law of the scientific productivity”, its connotation is: the number of author which published x literature is the number of author which published one literature total to divide x2. By performing Lotka’s law to carry onto the analysis, which confirms the literature productivity of social capital, whether to be suitable or not, it should also follow by five procedures: 1) Collecting data. 2) Listing the distribution of publication via author. 3) Calculate the slope c value. 4) Calculate the slope n value. 5) By utilizing the Kolmogorov-Smirnov examination determination (K-S test) whether the distribution is conform to or not. Viewing on the datum, author has only 1 literature is 85.15%, which is not matched of primitive c value 60.79%, which provided by Lotka’s law. After that, it can follow the calculation to get c and n value by the least squares law, carry onto the further proceeding examination for Lotka’s law compliance. By the result of calculation on table 9, it could bring into the following equation. The n = -2.47773
NP: Number of Publications PT: Percentage of 1,948 Table 9. Distribution of author’s accumulation (I) NP
A
SNP
CNP
PTCNP
CA
PTCA
28
1
28
28
0.75%
1
0.03%
23
1
23
51
1.36%
2
0.07%
n
N XY X Y N X 2 X
2
After that, we also found c = 0.7391789, the equation is shown as below:
130
Journal of Convergence Information Technology Volume 5, Number 2, April 2010
A: Author(s) Table 11. Distribution of author’s accumulation (II) p=10 (Maximum (x) + 1)
COVA NP
x = 1, 2, 3, 4, 5, 6, 7, 8, 9, 10, 11
OVA Sn(X)
While we obtained n = - 2.47773, c = 0.7391789, it explored, f(x) = 0.7391789/x2.47773. The distribution chart is shown as Figure 3. Discussing on the n and c value, primitive n approximately is -2, c is 0.6079, which provided by Lotka’s law, it demonstrated that the distribution of literature productivity of author in social capital research aspect and the primitive Lotka’s law has not tallied completely. But actually it may observes the two datum distribution disparity which not too big on figure 6. In order to examine the theoretical value and the observation value whether to tally. Regarding the n and c value which gained by the formula, it is possible to calculate the expected value and the accumulation value of author, following by Kolmogorov-Smirnov examination determination (K-S test).
CMVA
ABS Value
F0(X)
|F0(X)-Sn(X)|
MVA
1
0.8515 0.8515
0.7392
0.7318
Dmax=0.1197
2
0.1027 0.9542
0.1327
0.8645
0.0897
3
0.0244 0.9786
0.0486
0.9131
0.0655
4
0.0100 0.9886
0.0238
0.9369
0.0517
5
0.0057 0.9943
0.0137
0.9506
0.0437
6
0.0027 0.9970
0.0087
0.9593
0.0377
7
0.0010 0.9980
0.0060
0.9653
0.0327
8
0.0010 0.9990
0.0043
0.9696
0.0294
10
0.0003 0.9993
0.0025
0.9720
0.0273
23
0.0003 0.9996
0.0003
0.9724
0.0272
28
0.0003 0.9999
0.0002
0.9725
0.0274
NP: Number of Publications OVA: Observed Value of Author(s) COVA: Cumulative number of OVA MVA: Mean Value of Author(s) CMVA: Cumulative number of MVA
According to Kolmogorov-Smirnov examination determination (K-S test), Table 11 demonstrated Dmax=0.1197, but the sampling number is bigger than 35, therefore the threshold value is 1.63/29891/2 = 0.02981. Because Dmax is much bigger than the threshold value, the result is this research author productive forces distribution and the Lotka’s law does not tally, which means the Lotka’s law is not suitable for the analysis of distribution of literature productivity of author in social capital research aspect. Table 10. Analysis of literature productivity by Author NP
A
X=ln x
Y=ln y
XY
XX
28
1
3.33
0.00
0.00
11.10
23
1
3.14
0.00
0.00
9.83
10
1
2.30
0.00
0.00
5.30
8
3
2.08
1.10
2.28
4.32
7
3
1.95
1.10
2.14
3.79
6
8
1.79
2.08
3.73
3.21
5
17
1.61
2.83
4.56
2.59
4
30
1.39
3.40
4.72
1.92
3
73
1.10
4.29
4.71
1.21
2
307
0.69
5.73
3.97
0.48
1
2,545
0.00
7.84
0.00
0.00
Total
2,989
26.1062
43.757
19.3749 28.3703
Figure 3. The distribution of literature productivity by authors’ publications from 1959 to 2008
5. Conclusion Social capital is one of fast growing discussion subjects in recent years, this historical review and trend
NP: Number of Publications
131
Bibliometric analysis of social capital research during 1956 to 2008 Chi-Yen Yin, Johannes K. Chiang
analysis of this paper field were determined by each kind of literature characteristic and the distribution of author productivity is getting into the highly mature period, it might be inferring that the present social capital literatures are still continually to grow, the main research development facility with delivered the large production is United States, but England, Canada, Australia, and some Asia countries such as China, Taiwan, Japan and South Korea, these non-US individual authors literature delivered actually are also very popular. The frequency indices of literature productivity of author didn’t follow by Lotka’s Law. The applications of social capital are mainly following by research aspects which in terms of sociology; economics; public, environmental and occupational health; political science; planning and development; management; business; social sciences and interdisciplinary. The literatures of social capital were usually generated by multiple authorships.
[10]
6. References
[18]
[1] [2] [3]
[4]
[5]
[6]
[7]
[8]
[9]
[11] [12]
[13]
[14]
[15]
[16] [17]
B. C. Brookes, “An Outline of Bibliometrics and Citation Analysis”, Library Trends, 1973, pp.18-43. B. C. Brookes, “Numerical Methods of Bibliographic Analysis. Library Trends”, 1973, pp. 18-43. C.C. Chao, J.M. Yang, & W.Y. Jen, “Determining technology trends and forecasts of RFID by a historical review and bibliometrics analysis from 1991 to 2005”, Technovation 27(5), 2007, pp. 268-279. C.Y. Yin, J.S. Lin, & J.M. Yang, “A Study on the Productivity Review for Management of Technology Using Bibliometric Methodology”, Conference Proceeding of 4th ICCIT: 2009 International Conference on Computer Sciences and Convergence Information Technology, Seoul, Korea, 2009. C.Y. Yin, & J.K. Chiang, “Social Capital: The Literature Productivity Review and Trend Forecast Using Bibliometric Methodology from 1956 to 2009”, Paper ID: NCMRT2S06-301006O, Conference Proceeding of 5th NCM international joint conference on INC, IMS and IDC, Seoul, Korea, 2009. C.Y. Yin, & Y.P. Chi, “A historical review and trend analysis of ubiquitous computing research using bibliometric methodology during 1993 to 2009 ”, International Journal of Digital Content Technology and its Applications (JDCTA), accepted and forthcoming in 2010. D. Turnbull, “Bibliometrics and the World-Wide Web”,http://www.ischool.utexas.edu/~donturn/researc h/bibweb.html, 2005. H.J. Dernburg, “Foreign-Capital in Latin-America – United-Nations-Dept-Econ-Social-Affairs”, Journal of Finance, Vol. 11(1), 1981, pp. 94-95. G. Fischer, “Social Capital: Zeitschrift Fur Betriebswirtschaft”, Business-Management, Volume: 29, Issue: 12, 1981, pp. 725-736.
[19] [20]
[21]
[22]
132
J. Field, & T. Schuller (eds.), Social Capital: Critical Perspectives, New York: Oxford University Press, 2000. J.S. Coleman, “Foundations of Social Theory”, Cambridge, Mass.: Harvard University Press, 1990. J.S. Coleman, “Social Capital in the Creation of Human Capital”. American Journal of Sociology, 94 (Supplement), 1998, pp. 95-120. M. C. Dort, Bradford's Law: Theory, “Empiricism and the Gaps Between”. Library Trends Summer (Special Issue on Bibliometrics). 1981, pp. 41-52. M. Huysman, & V. Wulf, “Home networking and Information Technology: Current Debates and Research”, Massachusetts Institute of Technology, Boston. USA. 2004, pp. 1-15. M.Y. Tsay, “A bibliometric analysis of hydrogen energy literature, 1965-2005”, Scientometrics, Vol. 75(3), 2009, pp. 421-438. R.D. Putnam, Making Democracy Work, Princeton, 1981, N. J.: Princeton University Press. R.D. Putnam, “Turning in, Turning out: the Strange Disappearance of Home networking in America”, PS: Political Science and Politics, 1995, 28, pp. 664-683. S. Xie, J. Zhang, & Y.S. Ho, “Assessment of world aerosol research trends by bibliometric analysis,” Scientometrics, Vol. 77, No. 1, 2008, pp.113-130. T. Schuller, S. Baron, & J. Field, “Social Capital: A Review and Critique.” in S. Baron, 1985. T. Yamagishi, & M. Yamagishi, “Trust and Commitment in the United States and Japan”, Motivation and Emotion, 18(2), 1994, pp. 129-166. W.J. Wu, H.S. Shen, & L. Wee, “A Chinese Agricultural Information Management-System,” Proceedings of the American Society for Information Science, Volume: 18, 1981, pp. 62-64. Y.S. Ho, Comments on “Determining technology trends and forecasts of RFID by a historical review and bibliometrics analysis from 1991 to 2005”, Technovation, 29 (10), 2009, pp.725-727.