Nov 15, 1986 - Institute of Ocean Sciences Sidney, British Columbia, Canada. Using cross ... surface velocities directly from high-resolution satellite images.
JOURNAL
OF GEOPHYSICAL
RESEARCH, VOL. 91, NO. Cll,
PAGES 12,865-12,878, NOVEMBER
15, 1986
An ObjectiveMethod for ComputingAdvectiveSurfaceVelocitiesFrom Sequential Infrared Satellite Images W. J. EMERY, 1 A. C. THOMAS,AND M. J. COLLINS Departmentof Oceanoqraphy, Universityof BritishColumbia,Vancouver,Canada W. R. CRAWFORD AND D. L. MACKAS
Institute of OceanSciencesSidney,British Columbia,Canada
Using crosscorrelationsbetweensequentialinfrared satelliteimages,an objectivetechniqueis developedto computeadvectiveseasurfacevelocities.Crosscorrelationsare computedin 32 x 32 pixel search (secondimage) and 22 x 22 template (first image) windows from gradientsof sea surfacetemperature computed from the satellite images.Velocity vectors,computed from sequentialimages of the British Columbia coastalocean,generallyappear coherentand consistentwith the seasonalsurfacecurrent in the region.During periodsof strong wind forcing,as indicatedby maps of sea level pressure,the image advective velocities are stronger and more coherent spatially and appear to cross surface temperature
gradients;when winds are weaker,the advectivevelocitiescorrespondbetter with the infraredtemperature patterns, suggestingthe increasedcontribution of the geostrophiccurrent to the surface flow. Velocitiesdeterminedfrom coincident,near-surfacedrogued (5-10 m) buoys,positionedevery half hour by internal LORAN-C units in mid-June,show excellentagreementwith the image advectivevelocities. In addition, conductivity,temperature,and depth (CTD) measurements(taken during the buoy tracking) confirm the homogeneityof the upper 10 m, and CTD-derived geostrophiccurrents are consistentwith both buoy and sequentialimage displacementvelocities.
future can be compared with surface topographies measured
INTRODUCTION
Recently,therehas beenincreasing interestin computing surfacevelocitiesdirectly from high-resolution satellite images of infrared sea surface temperature (SST) patterns. The patterns have been shown to be consistent
with current
estimates
from Lagrangian drifters [Kelly, 1985] and are thought to reflect near-surfaceocean circulation. Another comparison between infrared image-derived surface velocities was reported by Kelly [1983], who used an analysisprocedurebasedon an analytical model that inferred velocitiesfrom a singleinfrared ,
image.Comparisons between these"geostrophic" currents, designedto match the satelliteinfrared SST gradients,and coincident Doppler acoustic log velocities, from the California Current region, showed good agreement. Using sequentialinfrared images, La Violette [1984] estimated velocities around the Alboran Sea gyre. Vastano and Borders [1984] used a similar technique, with an interactive display system, to track submesoscalefeatures in sequential infrared satellite images from the western North Pacific. Called feature tracking, this subjective, interactive technique was expanded on by Vastano and Reid [1985] who used the resulting surfacevelocity vectorsto derive a two-dimensional stream function expressionfor the advectivesurfacevelocity field. Invoking geostrophy, they further infer a sea surface topography to match the stream function derived from the satellite image velocity vectors.The resultant "dynamic topography" estimate providesa high spatial resolution, satellitesynoptic estimate of the sea surface elevation which in the • Now at National Center for AtmosphericResearch,Boulder, Colorado.
Copyright 1986by the AmericanGeophysicalUnion. Paper number 6C0434. 0148-0227/86/006C-0434505.00
with satellite
altimeters.
A basic weaknessof the feature-tracking procedure is the need for subjective selection and tracking of SST features in the infrared satellite images.Such subjectivefeature tracking is necessarilyoperator dependent and cannot be recreated exactly by different operators of different display systems even using the same satellite images.It would be usefulif a computational procedure existed that was objective and operator independent to compute surface advective velocities from sequencesof satellite images. In this paper we apply a computational technique which has been widely used in satellite image registration [McGillem and Svedlow,1977, 1978; Svedlow et al., 1978] and has also been used to detect cloud motion in sequentialimages [Leese et al., 1971]. In the image registration application, time invariant land features are located, while in the cloud tracking technique the displacements of cloud image features are calculated. This same procedure was recently applied to sequential visible satellite images of the eastern Beaufort Sea to compute ice displacements[Ninnis et al., 1986]. The essenceof the computational method is the identification of the maximum cross correlation, between 32 x 32 search (secondimage) and 22 x 22 pixel template (first image) windows, as the end points of displacement vectors from the
window centers.Applied directly to the satellite infrared temperatures, the weak cross-correlation maxima yielded incoherent velocity patterns. The satellite images were then transformed into maps of SST gradient and the maximum cross correlation (MCC) technique was applied to these gradient images. The resulting vectors were generally spatially coherent. In addition, for a sequence of three images in mid-June 1985, tracks of shallow-drogued drifters exhibit excellent agreement with the computed image advective velocities.Further supporting evidence was found in a coincident conduc-
12,865
12,866
EMERYET AL.' COMPUTINGADVECTIVESURFACEVELOCITIES
TABLE
TABLE
1. Infrared Satellite Images
2.
Drifter Start and End Dates and Times and
DeploymentPositions Local Date
June 16 June 17 June 18 July 26
July 26 July 28 July 28 Aug. 12 Aug. 12 Aug. 15 Aug. 15 Aug. 16 Aug. 16
Time
1258 0257 0246
0811 1937 1353 1854 1435 1829 1403 1904 1354 1842
Separation, Satellite
Orbit
hours
NOAA NOAA NOAA NOAA
9 9 9 8
2,630 2,638 2,652 12,008
--14 24 .-.
NOAA NOAA NOAA NOAA NOAA NOAA NOAA NOAA NOAA
8 9 8 9 8 9 8 9 8
12,105 3,223 12,133 3,435 12,346 3,477 12,389 3,491 12,403
12 --. 5 ... 4 ... 5 19 5
Start
End
Time, Buoy
Date
PST
2
June 15
2036
Deployment
Time,
Position
48ø18'49"N,
Date
PST
June 18
1036
June 19
1938
June 14
2132
June 16
1814
June 19
1104
June 16
0600
June 19
1635
June 18
0640
June 26
2149
125ø31'01"W 2
June 18
1438
48ø28'51"N, 125ø15'07"W
2
June 13
1232
48ø29'02"N, 125ø15'25"W
4
June 9
1144
48ø29'03"N, 125ø15'34"W
4
June 17
1934
48ø21'02"N, 125ø14'27"W
June 9
1451
48•26'10"N, 125ø11'17"W
June 17
1935
48ø21'05"N, 125ø14'11"W
June 9
and satellite image advective velocities. In what follows we describethe methodology used to compute the SST gradients and the advective surface velocities.
1640
48ø23'47"N, 125ø20'32"W
tivity, temperature,and depth (CTD) survey which revealed the homogeneityof the upper (< 10 m) layer and yieldeddynamic height contoursconsistentwith both the drifting buoy
June 24
1149
48ø26'18"N, 125•-'..20,12,,W
tions of a group of four near-surfacedrogued drifters in addi-
Thesemethodsare then appliedto a seriesof satelliteimages tion to a set of CTD profilesin the vicinity of a cycloniceddy of the British Columbia
over the shallow
coastal ocean for the summer of 1985.
Unusually clear atmospheric conditions made it possible to collect a large number of clear images at the University of British Columbia (UBC) Satellite OceanographyLaboratory. Image pairs selectedfor study range in separationfrom 4 to 24 hours (Table 1) and are discussedindividually in terms of the short-term changesin SST patterns. During the latter half of June a field program of the Institute of Ocean Sciencesin Sidney,British Columbia, collectedhalf-hourly LORAN posi-
128 ø
Island.
Both
continental
shelf off' southwest
of these additional
data
DATA
The primary data sourcefor this study was satelliteimagery from polar-orbiting weather satellites (NOAA 8 and NOAA 9). The digital image data were all receivedand processedat
126 ø
124 ø
COLUMBIA
PENINSULA
50øN
50 ø
VANCOUVER ISLAND
OCEAN
49 ø
49 ø
BARKLEY SOUND
128øW
to
agree well with the image-derived surface velocities. We conclude with a summary of our results.
BRITISH
PACIFIC
Vancouver
sources are shown
126 ø
Fig. 1. Map of the study area.
124 ø
EMERY ET AL.' COMPUTING ADVECTIVE SURFACEVELOCITIES
12,867
•
•
:
i"'•. i• "--•"-" ': '-;• 7':...........•
.
:..
:
ß
"" '"..
'.....-::;.?:•;7i
• .•... -..;-*:.:'.'.. . (.."..'. --•. "' '•... *"•,.lul• •:,• .,,e8 • 1 ., :.:..•! '
.
'
'
.::::;.•;"
'
':J"':' *
'
"" "•'":-;..... 1•' •.'i::'.; "
' ' :'1'
""'-::•-.111 ...•' '* I•.:"'•:'•'::.::'::•'""-:'--•* ;." '::-"---' ..... :'..... ';""•':": ':: :.:-•' •:.::... i'.
:
ß
:•':.-":• i:
-
..; .: .... '}.
..•' ....... •.. :.:•:.:?•:!: ,:,:• . •':'•?'.' .:.:.:•.-;'-:::;-"•:6 12) of coastal ground control points (GCPs) confirmed the stated accuracy (about 1 km) of the ephemeris navigation procedure. Coastal land boundaries were added from a digital map, and all land areas were masked with a uniform brightness. Band 4 (11.5-12.5 •m) infrared images were converted to temperature using the single-channel reference temperatures. Since in this study, relative SST patterns (gradients), rather than absolute SST, were important, no correction was made for atmospheric water vapor contamination of the singlechannel infrared temperature. While water vapor not apparent in the visible or infrared channels can significantly alter the
satellite-derived absolute SST [Bernstein and Chelton, 1985], it is unlikely that the spatial structure of the atmospheric boundary layer will significantly influence the much smaller spatial gradients of SST in the 32 x 32 km correlation windows. Generally, the spatial scalesof the atmosphericmoisture structure are much greater than those of the SST features. Coincident with the satellite images in June 1985 (Table 1) a set of shallow-drogued (5-10 m) buoys were tracked by shipbased LORAN
off the southwest
coast of British
Columbia.
These buoys were deployed, tracked by ship, recovered, and then redeployed to gather repeated trajectories in the area off the mouth of Juan de Fuca Strait (Figure 1). These trajectories, buoy numbers, dates, times, and positions of deployment are summarized here in Table 2. Some of these trajectories were too short to be useful for our comparison purposes and do not show up in later diagrams. As part of this summer 1985 field study, a survey of shallow CTD profiles was collected in the same area that the buoys were deployed in. METHOD
As was mentioned in the introduction, a first attempt at
calculatingvelocitiesdirectlyfrom the SST imageswas unsuccessfulregardlessof the imagepair used.The lack of success was apparent by the relatively low maximum correlation values and the incoherent spatial structure of the resulting velocityfields.In an effort to produceSST featureswhichthe MCC algorithmcould clearly identify,gradientsof infrared SST were computedfor all of the imagesin Table 1. It was shownby Svedlowet al. [1978] that usingthe magnitudesof the imagegradientsyieldedbetter image registrationresults than were obtained when the cross-correlation
applied to the imagesthemselves.
method was
12,868
EMERY ETAL.'COMPUTING ADVECTIVE SURFACE VELOCITIES
MEaN FlUTO-CORRœLFtTION SURFACE DER I VEB FROM SST-SRFIB I ENT I MFISES 1
0.8 0.7 0.6
0.% 0.5
0.2
Oø262
0.1 O. OC...a
0
'-0.••
-0.2 -0. •
•0.•
•0 .7 •0. •
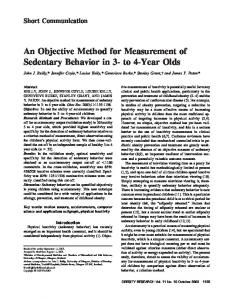
Fig. 3. Meanautocorrelation surface for all thetemplatewindows in Figure2a.The x andy scales arein unitsof pixels whichare approximately1 km each.
Sea surface thermal features were first smoothed and small
where the resultingtemperaturegradientsare in units of de-
scaleimage noise was reducedusing a 3 x 3 pixel running grees Celsius per kilometer [Van Woert, 1982]. Two kinds of mean filter. Temperaturegradientswere then computedusing temperature gradient images were produced: one was the an unweightedcentral difference,the magnitude of which is straightSST gradientas computedin (1); for the secondtype given by
IT(x, Y)I = 1/(2Ah){[T(x- Ah, y)- T(x + Ah, y)]2
+ IT(x, y- Ah)- T(x, y + Ah)]2}'/2
(1)
of gradient the magnitude in (1) was limited to a selected threshold value producing a step function form of the SST gradient. This was an effort to best approximate thosefeatures seen by Ninnis et al. [1986] in visible ice images.In their
EMERYET AL.' COMPUTINGADVECTIVESURFACEVELOCITIES
12,869
...
:-:.i ......
:
r?.......;.:*,?X:•....":•* •....;•:-:*"• ½; ' "%..... •"''-.,. :i-'.' .-. B.....
?•:-•."•.:.: ..-:.'•... , .•:..::-;.• .......... "'x ........
:,::
,
• ',
:-'•:'•:'•'":'""--"......
.... .-...
.
,.• :'-•.;'--•
--..%. .....
.....
•
I
:....:
'";;•!:'•' :i-' ..•:i-' ':': ".-';;-':
.
.....
........ •-•}•'.... '"•
.
. .
... ...
:>'":;:....I--.
"-: -.::' .:•. ':'..... '•" •.' s..•:-..
•
%.:
:.:..,;.,..,.,. - ... •
--:.'
..:??-.• ;.½'::;;•::": :-'-.¾, •:';•'" '.....:::7 ......
Plate
la
Plate 1. Band 4 infraredAVHRR imageswith superimposed advectivesurfacevelocitiesfor (a) 1208 PST June 16, 1985,with velocitiesfor the June 16-17 imagepair and (b) 0257 PST June 17, 1985,with velocitiesfor the June 17-18 imagepair.(Thecolorversionof thisfigurecanbefoundin theseparate colorsection in thisissue.)
imageregistrationapplication,Svedlowet al. [1978] also used gradients have been enhanced so that strongestgradients are thresholdimage gradients(thus producinga two-level binary indicated by the lightest shades with the weakest gradients image)and foundthat the imageregistrationresultsfrom the given by the darkest background shades.The images are sepaMCC method were better than thoseusingthe original images but were not as good as the resultsusing the image gradient itself.When appliedto thesetwo differenttypesof SST gradients, the cross-correlationtechniqueproduced very similar results, and it was thus decidedto use the simpler form of the SST gradient given by (1). As examplesof these SST gradient images we present two imagesfrom July 28, 1985, in Figures 2a and 2b. Here the
rated in time by 5 hours and provide an example of the features followed by the MCC method. To facilitate the interpretation of these gradient images, we have added to the usual latitude-longitudegrid a uniform grid of 32 x 32 pixel squares correspondingto the searchwindowsin the MCC method. In this computational procedure each infrared temperature gradient image is consideredas being an independentrealization of the SST, whose variations over relatively short time intervals are due only to surfaceadvection. Thus the MCC in the two-dimensionallagged window specifiesthe end position of an advectivesurfacevelocity from the center of the window. A grid of windows providesa map of advectivesurfacevelocities. This method yields no information about the driving forces for these advective velocities and they contain both geostrophic and wind-driven surface currents. Advective velocities were in some casesclearly wind driven (appearing to have no relation to the surface temperature pattern), while in other
cases the velocities
were related
to the surface thermal
structure and the flow was along the stronger SST gradients. An important limitation of the method, as presentlyapplied, is its inability to account for SST gradient changesdue to nonadvective mechanismssuch as spatially patchy solar heating and surface cooling. No independent data were available to estimate the importance of theseeffects,but changesin SST patterns often suggestedthat advective velocities represented heating events. Away from the coastal boundaries, where
' .::..t•:.•.:• ::..
....."?•."i%:•.......
freshwater discharge sharplyaffectsthe densitycurrents,the :.
.-A" ': ......
I
.....
Fig. 4. Band 4 infraredAVHRR imagewith superimposed advective surfacevelocity for 0246 PST June 18, 1985.
SST advective velocities are more likely to be representative. Also, near coastal boundaries there is the problem that some windows will contain land and will not be consistent representations of the advective SST changes; all such velocities were edited out of the final advective
fields.
No independent feature tracking was carried out to verify the MCC velocities as was done in the ice motion study of
12,870
EMERYETAL.' COMPUTING ADVECTIVE SURFACE VELOCITIES
Plate
2a
Plate
2b
Plate 2. Band 4 infrared AVHRR images with superimposedadvective surface velocities for (a) 0811 July 26, 1985, with velocitiesfor a pair of July 26 imagesat 0811 and 1937 (PST) and (b) 1353 July 28, 1985, with velocitiesfor a pair of July 28 imagesat 1353and 1854 PST.
Ninnis et al. [1986]. Instead, comparisonswith the drifter trajectories and CTD dynamic heights were used to verify the velocity results of the MCC procedure. One important difference between the M CC and feature-tracking methods is the fact that the MCC method cannot respond to rotational or deformational changes while the subjective feature-tracking technique can. It should be noted, however, that for the very short time intervals between some image pairs (4-5 hours), small segmentsof rotational motion will appear as translation, which accounts for the good representation of the large-scale eddy motion clearly marked by the SST patterns in some of the summer images.It is likely that for longer image separations (12-24 hours) the MCC velocity vectors will less faithfully represent rotational motions. A final comment should be made about the inability of the method to detect motion along surface temperature fronts. When such fronts are associatedwith underlying geostrophic currents, these currents should run along gradients of SST and thus
not
be reflected
in the
MCC
advective
velocities.
It
should be noted, however, that often the SST gradients are not narrowly defined and frequently have smaller-scale cross gradient structuresthat undergo displacementsalong the temperature gradient that will be detected by the MCC method. It is the motion of thesesmaller temperaturefilamentsthat leads to MCC velocitiesparallel to surfacetemperature contours.
variability over the image, all windows in the gradient image shown in Figure 2a were used.The mean autocorrelationover all of these windows is shown here in Figure 3 as a threedimensional correlation surface. Unfortunately, the x and y zero-crossingscalesare not the same,with the y (north-south) zero-crossingscaleat about 10 km (1 km per pixel) and the x (east-west)scale at about 15 km. Since in the computational method the statisticsof x and y were not consideredseparately, we take an averageof thesetwo length scalesto yield a length scale of 12.5 km for the mean, or isotropic, zerocrossingscale. Within each cross-correlation calculation (template window) there are 22 x 22 pixels,or 484 points. To estimate
how many of thesepoints can be consideredas independent, we divide the total points by the average autocorrelation length scale.This yields 39 degreesof freedomfor each crosscorrelation calculation. At the 95% significancelevel any correlation over 0.304 is significantfor 40 degreesof freedom; at the 99% level, correlationsgreater than 0.393 are significant, which coincidesnicely with the arbitrarily chosen cutoff level of 0.4 [Ninnis eta!., 1986] usedto reject low cross-correlation values. While this is not a rigorous statistical test, it does suggestthat for crosscorrelation above 0.4, we are locating correlation maxima which are statistically well defined for the advanced very high resolution radiometer (AVHRR) data being used. It is much more difficult to evaluate the influences of physi-
ERROR ANALYSIS
In order to estimate
the statistical
limitations
of the M CC
cal processesnot included in the assumptionsof the MCC method. As was suggestedabove, these processesare those
vective velocities in each window. An estmate of the appropri-
other than horizontal advection which can change the SST. If we considerthe local changeof SST as being due to horizontal advection,vertical advection(upwellingand downwelling),
ate degreesof freedom in each computational window was calculated by computing the autocorrelationsin a seriesof windows for one of the images used. To representthe spatial
local heating (or cooling),and mixing (both horizontal and vertical),we can make someestimateof the magnitudesof theseprocesses over the time scalesof interest.If we restrict
procedure,an effort wasmadeto estimatethe statisticalsignificance of the cross-correlation
maxima
used to define the ad-
EMERYET AL.' COMPUTINGADVECTIVESURFACEVELOCITIES
12,871
Fig. 5b
ß
•
.... :•....-}::--• ,...ß
,
:. .
......... .•:...:....-.}..•: .... .;..., .....
..
.
:.
.
,:'-'-:
.•..••;-- '::. -;,......, .:...,.....•.:
,....;,-:.,,'.,:,.?-.•;........•;t-', ........ :.:. :--* ?."* *:-:.; ';.y'-.' 7:*" *•;• -,'**
½?":.:.•*•:--'•.•
"-;.
•!
':'"'•=:i,..½':... '
,,,,•
ß :.:../: ..... ........
. :.
;•
.... Fig. 5e
Fig. 5d
Fig. 5. Band4 infraredAVHRR imageswith superimposed advective velocities for (a) 1435PST August12, 1985,with velocitiesfrom a pair of August12 imagesat 1435and 1829PST; (b) 1403PST August15, 1985,with velocitiesfrom a pair of August15 imagesat 1403and 1904PST; (c) 1904PST August15, 1985with velocities from thisimageand an image from August16 at 1354PST; and (d) 1354PST August16, 1985,with velocitiesfrom a pair of August16 imagesat 1354 and 1842 PST.
ourselves to changesovera maximumperiodof 24 hours(and we are generallyconcernedwith significantly shorterintervals betweenimages),it is unlikely that within this time interval the diffusiveprocesses will act quicklyenoughto alter the SST
tal advection we must then consider vertical advection and
horizontally patchy heating and cooling as error sources which we cannot measure from the satellite data directly. Without additional in situ measurements we can only be
patternand thusaffectthe MCC calculation. Eliminatingthe aware of thesepossiblycontaminatinginfluencesand try to mixingprocesses, we are left with the advectiveand heating accountfor them in the interpretationof the computedMCC and coolingmechanisms as the primary causesof changesin SSTgradients. Sincewe are afterthe computationof horizon-
velocities. As is mentioned later in the discussion of the calcu-
lated velocities,there are many caseswhere the velocitiesdo
12,872
EMERYET AL..' COMPUTINGADVECTIVESURFACEVELOCITIES
around Cape Flattery. The alongshore southward extent of this surfaceflow is not clear. In the images from June 16 and 17 (Plates la and lb) the slightly offshore tongue appears to stop at the southernmostlatitude of the cyclonic eddy. The
not appear to reflect the expected advective field. As is suggested here, both vertical advection and small-scale heating and cooling events could be changing SST patterns which would produce cross-correlationchangesnot related to horizontal
advection.
1400Vlt IMAGE-DERIVED
•20
SURFACE VELOCITIES
The sequence of images, summariz ed in Table1, separates into three groups: mid-June, late July, and mid-August. Sea surfacetemperature patterns in thesethree groups are distinctly different. The June images are dominated by a cold eddy off the mouth of Juan de Fuca Strait (Plate 1 and Figure 4) related to the presenceof a topographic canyon, as was dis-
cussedby Freelandand Denman[1984]. A seriesof cold tongues all along the northwestern coast of Vancouver Island dominates the SST pattern in the July images (e.g., Plate 2). (Plates 1 and 2 are shown here in black and white. The color versions can be found in the separate color section in this issue.) These tongues form through baroclinic instability [Ikeda et al., 1984a, b] which converts energy from the highly sheared mean flow (southward surface current over a northward undercurrent)to mesoscalefluctuations which then develop into cyclonic eddies such as that clearly marked off Brooks Peninsula in Plate 2. A similar cold eddy was located at this position in the satellite images studied by lkeda et al. [-1984a] and in a study of in situ data by Thomson[-1985]; both studies confirmed the existence of an eddy at this location and its generation by baroclinic instability. The last series of images from August 1985 documents the southward and seawardspreadof a tongue of cold water (Figure 5), again off the northwest of Vancouver Island, replacing the eddy seen in the July images. The first two of the three June images (Plates la and lb) clearly display the presenceof a cold eddy just off the mouth of Juan de Fuca
Strait.
Cold
water
450•/40 SEA
,
LEVEL
PRESSURE
JUNE
16
g 140*WI,.'35
50
can also be seen in Plate
l a coming out of the strait, suggestinga possibleconnection with the water in the eddy. It is more likely, however, that the cold water in the cyclonic eddy is instead an expressionof local upwelling due to the eddy circulation [Freeland and Denman, 1984]. The June 17 image (Plate lb) SST pattern is also dominated by the cyclonic eddy off the mouth of Juan de Fuca Strait. Again, a possibleconnectionwith cold water exiting from the strait is suggestedby the surface temperature pattern. The third image in this sequence(Figure 4) is 24 hours later (Table 1) than the previous image on June 17. The cold cycloniceddy is not as clearly expressed,and a significant amount of warmer water is present farther offshore. This is likely due to solar heating evidence of which is most clearly displayed by the water in Barkley Sound (see Figure 1 for location). On June 16 (Plate la) in a midday (1258 PST) satellite pass, this area is not significantly warmer than the adjacent coastal surface water. Thirteen hours later (0257 PST
•'5*N 140 135
SEA
C 140. w -
125
PRESSURE I.'35
JUNE
17
120
130
24
50
20
50
(
,,._.•24 20
nearby coastalwater;finally, 24 hours later, the June 18 image (Figure 4) shows the shallow water in Barkley Sound to be
135
than the coastal water to the north or south.
Another interestingfeature of thesethree imagesis the relative position of the cold water in Juan de Fuca Strait. In all three images the coldest temperatures are at the southwest limit of the strait, and the cold water turns sharply southward
1:50
LEVEL
June 17), Plate lb shows this area somewhat warmer than the
much warmer
i•o
155
SEA
LEVEL
130
PRESSURE
125
JUNE
18
Fig. 6. Sealevelatmospheric pressure (+ 1000mbar)for (a) June16, (b) June 17, and (c) June 18, 1985.
EMERY ET AL.' COMPUTING ADVECTIVESURFACEVELOCITIES
NORR/NMFS ?RCIFIC
12,873
ENVIRONMENTRL GROUP -
CORSTRL UPWELLING
INDICES,
MONTEREY,
DRILY
RND
SOURCE :63X63
DURING
1985
RT
8N,
125N
WEEK DRILY VRLUES WEEKLY come •TERSPER BEGINNING SUN • T• • Tm FR! SMT HERN -600 -400 -200 0 mmmm•mmmmmmmmmmmmmmmmmmm•m•mmmmmm•m•mmmmmm•mmmm•m•mmmm••mmmmmmmmmm•mmmm••mmm•mmmmm•mm•mmmmm•mmmmmmmmmmmmmmmmmmmmmmmmmmmmmmmmmmmmmmmmmmmmmmmmmmmmmmmmmmmmmmmmmmmmmmmmmmmmmmmm• 6 JAN
-t72
13 JAN
-if?
20 27 3 le 17 24 3 le 17 24 31 7 1• 21 28 5 12 19 26 2 9 16 23 3• 7 14 21 28 4
JAN JRN FEB FEB FEB FEB HRR HRR HRR HRR HRR RPR APR RPR RPR MAY MRY MRY MRY JUN JUN JUN JUN JUN JUL JUL JUL JUL RUG
11 RUG 18 25 1 8 15 22
RUG RUG SEP SEP SEP SEP
29 SEP 6 13 2• 27 3 1• 17
OCT OCT OCT OCT NOV NOV NOV
24 NOV I 8 15 22 29
Fig. 7.
DEC DEC DEC DEC DEC
-8!
-t47
-lt•)
-•2
-215 -288 -4t -59 -29 -t• -s3 -1 tl 15 s -2 tl -re 3 -9• -44 -t4 -z• -•3 -232 -2st • -• s3 2• 9 6 6 57 J5• -• •9 -24 -•4 -2•
z• -2 -zz -2•4 -3 t• -96 • 3 -ie -6z -27 6z t -z z -)t s4 sm -t st • t•7 -•t ]e et • 7s 44
• 4 -• -z16 -ti st • 9 • 4z -34 54 -• t2 •3 t7 4s 2e -24 ] 15 is 6s s4 ts tl 12 • •m 7e •
tez
62
7e Be •e s Je •e
67 4• 67 5 • z5
-3
s
4e
-Z 5•
t
4e 8 -7 -• es 4 -•e -244 -24 z4 -t• -t•s •t • -78 -49 47 -•
-• -478 -3 •t • •
-1•9
-re
-•
-• -• -• -• -rs
-•
-is4 -le -3
-st 4 -3 4e s
-4e -94
4• -4t
46 -46
t t a -3 -•4 t45 s3 2 85 43
2S 4• 2z e• 3• 3ee z t9 1e1 4•
ea s3 s3 t38 t•6 -t 2e 75 ee
67
ee
76
6z
82
•3 47 12 Je -s 9a -27 -•94 25 J9 94 e 44 -62 -28 -•e -•3 -9 -77 S5 -348 -27 -tze -• -t63 -24 -79 -t26 -Ca -tea
e es I tO -9 2J -27 i9 -•9 -4 3g -6• -47 -2e 21 -•t• -34 -• -134 -34 -146 -Sg -27s
24
t4
'l
-34 -147 7 54 -36
-23 96
-37 49 -29 -5
-2e? -•4
-164 -92
-62 -56
35 38 33 95 5B 12
92 38 es 41 •5 54 3 J9 -J2 56 9 -24 4i 35 -2• 12 2 8 5 -ts5 -25 -t4e -•9 -2 -S7 13 23 -st -•2 -tse -82 -ee -296 -7ff -3• -tZg -89 -e2 -8• -45e -166
Upwelling index [Bakun, 1973] at 48øN, 125øW for 1985. Positive valuesindicate upwellingin responseto northwesterly winds' 100 m refersto 100 m of coastline.
June 18 image (Figure 4) shows the cold water from Juan de Fuca as a much narrower tongue extending southward far beyond this earlier limit. In all three images the surface temperatures closest to the coast of Washington state are generally warmer with isolated pockets of very warm water. The cold water dischargedfrom Juan de Fuca also extends northward along the coast of Vancouver Island as the significant
coastal water. The important freshwater contribution that the Juan de Fuca
water
makes
to the coastal
current
cannot
be
nates the density) of the Vancouver Coastal Current (R. Thomson, personalcommunication, 1986). The connectionbe-
seenin the SST images.It must also be remembered, however, that cold coastal water during the summer off Vancouver Island may also be due to wind-driven upwelling [Ikeda and Emery, 1984], which, as was mentioned in the error analysis, may have also had an effecton the MCC velocities. Surfaceadvectivevelocitieswere calculated, using the M CC technique, between the SST gradients from pairs of the three June images. Thus two sets of vectors were calculated; one
tween
between
densitycomponen t (salinityrather than temperaturedomi-
Juan
de Fuca
water
and
the
cold
coastal
water
off
Vancouver Island appears to be broken by the warm surface waters (Figure 4) in Barkley Sound, which, as we have discussed, are likely due to local solar heating in the shallow
June 16 and 17 and the second between
June 17 and
18. The advective velocities represent the temporal changes over first a period of 12 hours and second a period of 24 hours. As a rule, we will display the resultant velocity vectors
12,874
EMERYET AL.; COMPUTINGADVECTIVESURFACEVELOCITIES
• 55140o w
135
• 55140o W
•0
1.30
155
I$0
t?_O 55ø•
•25
20
135
SEA
LEVEL
130
PRESSURE
155
JULY
26
SEA
LEVEL
130
PRESSURE
•?_5
JULY
28
Fig. 8. Sealevelatmospheric pressure (+ 1000mbar)for (a) July26 and(b)July28, 1985.
on the temperaturepatternof the first imageof the pair. Thus the SST imagesof the first 2 days (Plates la and lb) also contain velocityvectors,while the third image(Figure 4) displays only the temperaturepattern. Both setsof velocityvectorsfor this sequenceof imagesdo
not appear to relate directly to currentsflowing along SST gradients.Consistentwith the southwarddirected summer surfacecurrent [Ikeda et al., 1984b], many of the computed vectorspoint south. The velocitiesparallel to the coast are much stronger in the second set of vectors, suggestinga stronger mean current. This may be in response to the strongerwinds off VancouverIsland as revealedin the daily 1200 UT sea level atmospheric pressurepatterns for June 16-18 (Figures6a-6c). The weaker and offshoredirectedgeostrophic winds on June 17-18 may have led to a stronger expressionof the southwardsurfacecurrent betweenJune 17 and 18. It is also interestingto note that the alongshorewinds, on June 16, result in a relatively large value of the Bakun [1973] upwelling index as presentedhere in Figure 7 for a location just off the southernend of VancouverIsland. The upwellingeventin mid-June1985is one of the strongestupwelling eventsin 1985. A combination of wind-driven and geostrophic surface
flows is representedby the first set of vectors(Plate l a). Over the cold eddy,the June 16-17 advectivevelocitiesagreegenerally with the circulationof this cyclonicfeature.Away from the cold eddy, the June 16-17 velocities(Plate l a) are less spatially coherent,which may reflect the sharp increasein wind forcing indicatedby the upwellingindex on this date. The incoherent nature of the offshore advective velocitiesmay be due to the transient nature of these currents which have not
yet reachedan equilibrium with the strongerwind forcing. The northerly velocities at the southern edge of Plate la cannot be explained by an increasein upwelling favorable winds and instead appear to representthe northward intrusion of warm surfacewater, as can be seen by comparing the
SST patterns for June 16 and 17 (Plates la and lb.) This
northward extension of SST cannot be explained by any ad-
vective mechanismand may be the result of rapid surface warmingtaking placeunderclear sky conditions. The subsequentset of image advective velocities (June 17-18) no longercontainsa substantialnumberof northward velocities. Instead, the currents nearest the coast are stronger
and southeastward,consistentwith both the mean and wind-
driven flows.Velocityvectorsstill deviatesomewhatfrom the southeastwarddirection in the vicinity of the cyclonic eddy,
revealingits continuedpresence. Farther offshorethe imagederived velocities(Plate lb) turn westwardin agreementwith
the geostrophic wind patternsin Figures6b and 6c; a delayin the responseof the surfaceadvectivefield to changesin the wind forcing,is suggested by the differences betweenthe June 16-17 and June 17-18 velocities. These short-term changes
emphasizethe needfor and the benefitof beingableto resolve the rapid space-timevariationsin the velocity field and its responseto externalforcing.
Four imageswereavailablefor the latter part of July(Table 1), two from July 26 (12 hours apart) and two from July 28 (5 hoursapart). We presenthere only the first two imagesfrom eachpair togetherwith the velocityvectorscomputedfor the pair. All of the July images(e.g.,Plate 2a for July 26) clearly displayeda cold eddyoff BrooksPeninsula.This is the northernmostcycloniceddy discussedby lkeda et al. [1984a] and observedin situ by Thomson[1985]. The water in this eddy appearsto be colderthan the coastalwater farthersouth,and the temperaturepattern(particularlythat in Plate 2a) suggests a possibleconnectionto coldtemperatures off'the northerntip of Vancouver Island (on both the easternand westernsides). Streamersoff of this cold eddy (Plate 2b) clearly indicate the cyclonicvorticity associated with it. It is surprisinghow well the surfacetemperaturepattern in the interior of this eddy displaysits cycloniccharacter. The two setsof independentsurfaceadvectivevelocityvectorscomputedfor eachpair of Julyimages,whilebeingsimilar in overallpattern (averagecurrentis directedsouthward),are
EMERYET AL.' COMPUTINGADVECTIVESURFACE VELOCITIES
12,875
2b). It appears that the eddy has weakened and combined with the neighboring cold tongue just to the south. This tongue now extends a bit farther offshore (Figure 5a) and terminates in the T-shaped expression of matched counterrotating (or dipole) eddies [lkeda et al., 1984a]. In the next image, from August 15 (Figure 5b), the tongue no longer terminatesin the T shape.The cold-core expressionof the cyclonic eddy is also absent, and the cold tongue is more sharply defined by the intrusion
of warmer
surface water
to its south. A central
core
of colder water runs from the northern tip of Vancouver Island southwrd through the center of the cold tongue. It may be that the cyclonic eddy has separated from the coastal flow as was observed and modeled by lkeda et al. [1984a, b]; after separation from the sustainingcold coastal water, the surface expressionof the cold eddy is quickly erased by solar insolation.
Plate 3. Enlargement of the southwestcorner of image from June 16 with advective velocitiesfrom June 16-17 and trajectories from surface drifters 4.1 and 7.1. (The color version of this figure can be found in the separatecolor sectionin this issue.)
in detail quite different. In the July 28 image (Plate 2b) the velocity vectors,superimposedon the cold tongues,appear to be more related to the temperaturepattern than thosefor July 26 (Plate 2a). Over the cyclonic eddy the July 28 vectors appear to rotate around the cold feature (Plate 2b), while the July 26 vectorssuggestinstead an offshoredisplacementof the eddy (Plate 2a). This is perhaps a consequenceof the longer separationfor the first image pair (12 hours) compared to the shorter(5 hours)separationfor the secondpair. As was stated earlier, the advective assumption is more likely met by the shorterimage separation,evenfor the larger-scale(geostrophic eddy scale)rotational motion. It is interestingthat the velocitiesfrom the secondimage pair (Plate 2b) also show northward directed velocitiesadjacent to the coastjust south of Brooks Peninsula.This is likely an expressionof the Vancouver Island Coastal Current which farther south is masked by warmer water likely due to local solar heating. Elsewhere,both sets of velocity vectorsshow a generally southward current consistent with the accepted mean surfacecurrent pattern. The atmosphericpressurepatterns for this period (Figures 8a and 8b) exhibit near-normal southward geostrophicwinds also expressedby the positive valuesof the upwellingindex for this period (Figure 7). A total of eight relatively clear infrared images were available for the middle of August(Table 1). Again, we presentonly the first of each image pair except for the secondimage on August 15, which is the first image in a subsequentpair (August 1_5and August 16). Temporal separations (Table 1) range from only 4 hours (August 12) to 19 hours betweenthe second August 15 image and that from August 16. The SST patterns from August 12 to August 16 are dominated by a tongue of cold water off Brooks Peninsula that replaces the cold eddy seenin July. A weak expressionof this eddy can still be seen in the August 12 image (Figure 5a) displaced to the south relative.to the July 18 representationof the eddy (Plate
Subsequent images (Figures 5c and 5d) show short-term (both images are within 30 hours of the first Aug. 15 image) changesin the cold tongue and the surroundingthermal structure. It should be noted that all of the August imagesare from the afternoon and early evening,thus reducingthe likelihood that diurnal heating and cooling will substantially alter the surface temperature patterns. Instead, SST changesare more likely due to variations in the surfacecurrents respondingto both geostrophicand wind-driven current fluctuations. In all of these August images the coldest water is found off the northwesttip of VancouverIsland and in Figure 5c appearsto advect southwardand then offshorein the cold tongue. Advective velocities computed for the first August image pair (August 12, Figure 5a) are spatially very coherent showing a southward current which turns sharply westward. The wind-driven nature of these current vectors is indicated by their lack of agreementwith the SST pattern. The velocities run acrossmost of the dominant temperature gradient features. The pattern is, however, very consistentwith the atmosphericpressuredistributionfor this day. This sea-levelpressure pattern yields much strongerwinds in this area than were seen in earlier (Figure 6) and subsequentpressurepatterns. Winds from August 15 are consistent in direction with those from August 12 but are much weaker. It is therefore no surprise that the surfaceadvectivevelocitiesfor the image pair of August 15 are not as spatially coherent (Figure 5b) as those for August 12. The generally southward velocitiesare consistent with the wind pattern but the onshore(southeastward) velocities,in the southern third of the image, cannot be explained by the geostrophicwind, which still turns west at these latitudes. One possible explanation is seen in the eastward intrusion of the warm water tongue just south of 50øN. Whether advective,due to upwelling,or due to solar heating, the MCC techniqueinterpretsthesechangesas purely advective, giving the correspondingvelocity field with its eastward currents.
Velocitiesfor the remaining two image pairs (Figures 5c and 5d) are even lessspatially coherent.Much strongersouthward, alongshore velocities between August 15 and August 1_6 (Figure 5c) may be related to the shift in the geostrophic wind between August 15 and August 16. That thesestronger alongshorevelocitiesare more apparentin the image pair between August 15 and 1_6is likely due to the fact that the time interval between these imagesincludesa night and a morning, while the interval between the imagesof the secondpair is all on a singleafternoon(Table 1). During the night and early morning the solar heating is much reduced, and the colder coastal
12,876
EMERYETAL.' COMPUTING ADVECTIVE SURFACE VELOCITIES
Fig. 9b
Fig.9. Enlargements ofthesouthwest corners of"images from(a)June17withadvective velocities fromJune16-17 and trajectories fromsurfacedrifters4.1 and 5.1,and(b)June17 with advectivevelocities fromJune16-17and trajectories from surface drifters
4.1 and 5.1.
water, related to the southward current structure, can dominate (Figure 5c). In the afternoon sequence(Figure 5d), solar
heating can more strongly influence the surfacetemperature (under the observed relatively cloud free conditions) erasing the expressionof the underlying currents.Thus the velocities in the southern half of the secondimage pair (Figure 5d) indicate changesin the warm and cold tongueswhich may be due to advection,heating and cooling, or upwelling. COMPARISONS BETWEEN ADVECTIVE
VELOCITIES
AND BUOY TRAJECTORIES
As is discussed in the data section and summarized
in Table
2, a seriesof shallow-drogueddrifters were tracked in the area of the cyclonic eddy off the mouth of Juan de Fuca Strait in mid-June. To demonstrate the correspondencebetween these buoy trajectoriesand the surfaceadvectivevelocities,we have plotted both on the imagesfrom June 16 and 17 zoomed in around the cold eddy (Plate 3 and Figure 9). (Plate 3 is shown here in black and white. The color version can be found in the
separatecolor sectionin the issue.)Sincethe buoys had very similar trajectoriesover this relatively short period, and becauseof the strong similarity betweenthe trajectoriesand the advective velocities,we could not plot all of the trajectories together with the velocity vectors(the trajectoriesoverwrote
of the cold eddy and then move predominantly south, turning eastward at the edge of the eddy. These paths are very consistent with most of the advective velocities from the SST gradient images. Superimposed on the June 17 image in Figure 9a we show the tracks of buoys 4.1 and 5.1 along with the advective velocities from June 16-17. Again, the agreement between image derived velocitiesand buoy trajectoriesis excellent.The buoy tracks rotate cyclonically about the eastern edge of the eddy and then turn to the south before turning east at the edge of the eddy. All of these turns are consistent with most of the advective
velocities.
Finally the same two buoy trajectories (buoys 4.1 and 5.1) are superimposedon the infrared image from June 17 (Figure 9h) along with the June 16-17 advective velocities.Both buoy tracks and velocity vectorsappear to rotate cyclonically about the warm patch of water on the eastern side of the cold eddy. Strong southeastward motion, near the southern edge of the eddy, is indicated by both the buoy trajectories and the advective velocities. The stronger velocities are a responseto the strong geostrophicwind from June 16 (Figure 6a). COMPARISON WITH GEOSTROPttlC
CURRENTS
A set of shallow CTD castscollectedduring the buoy trackthe vectors). Instead we have selected some representative ing experiment was usedto define the near-surfacegeostrophic buoy trajectories and plotted them with the corresponding flow by mapping the 15/110-dbar dynamic topography. We advective velocity vectors.In Plate 3, long trajectoriesfrom present this dynamic height map in Plate 4 together with the buoys 4.1 and 7.1 (Table 2) are plotted along with the advec- June 16-17 advective velocities superimposedon the satellite tive velocities from June 16-17 on the image from June 16. image from June 17. The circulation of the cyclonic eddy is The agreementbetweenthe buoy tracks,the advectiveveloci- clearly displayed by the objectively analyzed [Freeland and ties, and the SST pattern is clearly displayed. The buoys Gould, 1976] 15/110-dbar dynamic topography (Plate 4); the appearto movearoundthe warm intrusionon the easternside eddy is centered at 43.3øN and 125.4øW. (Plate 4 is shown
EMERYET AL.' COMPUTINGADVECTIVESURFACE VELOCITIES
12,877
dence between the drifter tracks and the advective velocities. It
shouldbe recognizedherethat for the nearshoreregion,salinity is often the dominant variable in dictating the densitystructure. This is particularly true in early summer when the freshwater discharge of the Fraser River reaches a maximum [Royer and Emery, 1982]. SUMMARY
Sequential NOAA satellite AVHRR images of the British Columbia coastal ocean have been used to compute spatial SST gradients from the 11-•m infrared channel. Successive
Plate 4.
Enlargements of the southeast corner of the June 17
image with June 16-17 advectivevelocitiesand contoursof 15/110dbar dynamicheight (contourinterval = 0.005 dyn m) from the CTD casts (station positions are indicated by white dots). (The color version of this figure can be found in the separatecolor sectionin this issue.)
SST gradient imageswere two-dimensionallylag correlatedin coincident 32 x 32 searchand 22 x 22 template windows. The position of maximum correlation in each window was taken as the end point of an advective surfacevelocity vector, starting from the appropriate window center for the time period between images. Resulting velocities computed for eight images from the summer of 1985 appear consistent with the geostrophically balanced surface currents perturbed by local wind events. Image-derived advective velocities represent a combination of both geostrophic mean and shorter-term wind-driven surface currents. Strong, upwelling favorable winds appear to dominate the advectivevelocities,but a phase lag of about a day is suggestedby comparing the sea level atmospheric pressure-driven upwelling index and the correspondingimage advectivevelocities.During periods of weaker winds the advective velocities appear more geostrophic in character,as is partially st•ggestedby the SST patterns themselves. Unable
here in black and white. The color version can be found in the
separate color section in this issue.)The contours in Plate 4 clearly indicate the geopotentialgradient associatedwith this eddy. The agreement between these two independent realizations of the surface current structure is demonstrated by the similarities in the shapes of the contours and the advective velocity vectors.In interpreting this comparison it should be cautioned that the CTD stations were collectedover a 10-day period (June 9 to June 19), while the image advectivevelocities only pertain to advection occurring over the 14-hour period between the June 16 and June 17 images (Table 1). Thus the agreementbetween the longer-term geostrophicflow and the surface advective
velocities
reflects the dominance
to estimate
motion
other
than
translational
surface advection, the method fails to accurately represent local upwellingand surfaceheating events.In the vicinity of a vigorous,coastal cycloniceddy the image advectivevelocities compare well in both speed and direction with coincident measuresof geostrophiccurrent and Lagrangian trajectories.
Temperature 0
7
8
9
øC 10
11
12
i
of the sur25
face flow by the geostrophicflow of the cyclonic eddy. It is unlikely that similar comparisonsfor areas of the image far removed from this eddy would have been as favorable. This is particularly true of the southwestportion of the study region where, as has been discussed,the northward directed image
velocities(Plate la) are probably expressionsof local surface heating rather than advection. The southeastwarddirected advective velocities,in the southeastquadrant of the eddy, conflict with the geostrophic flow and likely reflect wind-driven rather than geostrophicsurfacecurrents. Another valuable piece of information provided by the CTD data is shown by the sample temperature(T) and salinity (S) profiles in Figure 10. The stippled band between 5 and 10 m correspondsto the drogue depths of the drifting buoys whose trajectorieshave been discussedabove. The T-S stratification reveals that the drogue elements are all within the upper "mixed layer," whosemotion is best representedby the image advectivevelocities.The presenceof the droguesin this
shallow upper layer helps to explain the excellentcorrespon-
5O
Q.
m 75
lOO
125
_
,
I
I
I
I
32
33
34
35
Salinity
Fig. 10. Temperature(T) and salinity (S) profilesat the deployment position of drifter 7 (48ø10.9'N, 125ø12.8'W).The shaded band indicatesthe depth of the drogues.
12,878
EMERYETAL.: COMPUTING ADVECTIVE SURFACE VELOCITIES
This agreement confirms the representative character of the advectivevelocitiesin a region dominated by geostrophiccurrents.
Kelly, K. A., The influence of winds and topography on the sea surfacetemperature patterns over the northern California slope, J. Geophys.Res., 90, 11,783-11,798, 1985. La Violette, P. E., The advection of submesoscale thermal features in
Acknowledgments.This research was supported by a variety of grants to W. J. Emery by the Canadian Natural EngineeringResearch Council; this support is gratefully acknowledged.Many people contributed to the collection and analysis of the satellite imagery; our appreciation goes to P. Nowlan for operating the receiving station and to D. Laplante and W. Meyers for their dedication to the development of useful software. B. Mueller initially processedall of the summer images. Howard Freeland processedmost of the CTD data and contributed to the interpretation of thesedata.
REFERENCES
Bakun, A., Coastal upwelling indices, west coast of North America, 1946-71, NOAA Tech. Rep., NMFS SSRF 671, 103 pp., 1973. Bernstein,R. L., and D. B. Chelton, Large-scalesea surfacetemperature variability from satellite and shipboard measurements, J. Geophys.Res.,90, 11,619-11,630, 1985. Emery, W. J., and M. Ikeda, A comparisonof geometriccorrection methods for AVHRR imagery, Can. J. Remote Sens., 10, 46-56, 1984.
Freeland, H. J., and K. L. Denman, A topographically controlled upwelling center off southern Vancouver Island, J. Mar. Res., 42, 1069-1093, 1984.
Freeland, H. J., and W. J. Gould, Objective analysis of mesoscale ocean circulation features,Deep Sea Res.,23, 915-923, 1976. Ikeda, M., and W. J. Emery, An upwelling event observedin satellite images over the continental shelf off Vancouver Island, J. Mar.
the Alboran Sea Gyre, J. Phys. Oceanogr.,14, 450-505, 1984. Leese,J. A., C. S. Novak, and B. B. Clarke, An automated technique for obtaining cloud motion from geosynchronoussatellite data using crosscorrelatiom J. Appl. Meteorol., 10, 110-132, 1971. McGillem, C. D., and M. Svedlow, Image registration error variance as a measure of overlay quality, IEEE Trans. Geosci. Electron., GE-14, 44-49, 1977.
McGillem, C. D., and M. Svedlow, Optimum filter for minimization of image registration error variance, IEEE Trans. Geosci.Electron., GE-15, 257-259, 1978.
Ninnis• R. M., W. J. Emery, and M. J. Collins, Automated extraction of pack ice motion from AVHRR imagery, J. Geophys.Res., 91, 10,725-10,734,
1986.
Royer, L., and W. J. Emery, Computer simulations of the Fraser River Plume, J. Mar. Res., 43, 289-306, 1982. Svedlow, M., C. D. McGillem, and P. E. Anuta, Image registration: Similarity measure and preprocessingmethod comparisons,IEEE Trans. Aerosp. Electron. $yst., AE$-14, 141-149, 1978. Thomson, R. E., A cyclonic eddy over the continental margin of Vancouver Island: Evidence for baroclinic instability, d. Phys. Oceanogr.,14, 1236-1646, 1985. Van Woert, M., The subtropical front: Satellite observationsduring FRONTS 80, J. Geophys.Res., 87, 9523-9536, 1982. Vastano, A. C., and S. E. Borders, Sea surface motion over an anticyclonic eddy on the Oyashio front, Remote $ens. Environ., 16, 87-90, 1984.
Vastano, A. C., and R. O. Reid, Sea surface topography estimation with infrared satellite imagery, J. Atmos. Technol.,2, 393-400, 1985.
Res., 42, 303-317, 1984.
Ikeda, M., L. A. Mysak, and W. J. Emery, Observation and modelling of satellite-sensed meanders and eddies off Vancouver Island, J.
Phys. Oceanogr.,14, 3-21, 1984a. Ikeda, M., W. J. Emery, and L. A. Mysak, Seasonalvariability of meandersin the California Current systemoff Vancouver Island, J. Geophys.Res.,89, 3487-3505, 1984b. Kelly, K. A., Swirls and plumes or application of statisticalmethods to satellite-derived sea surface temperatures,Ph.D. thesis,SIO Ref 83-15, CODE Tech. Rep., 18, 210 pp., ScrippsInst. of Oceanogr., La Jolla, Calif., 1983.
M. J. Collins and A. C. Thomas, Department of Oceanography, University of British Columbia, Vancouver, British Columbia, Canada
V6T
1W5.
W. R. Crawford and D. L. Mackas, Institute of Ocean Sciences, P.O. Box 6000, Sidney, British Columbia, Canada V8L 4B2.
W. J. Emery• National Center for Atmospheric Research,P.O. Box 3000, Boulder, CO 80307.
{ReceivedMay 2, 1986; accepted June 12, 1986.)
EMERY ET AL.' COMPUTING ADVECTIVE SURFACEVELOCITIES
Vancouver ' I$,taod '
. "
13,085
'tl
'
-
tls
19.-
,
o$
'*
-'
Plate la
Plate lb
Plate 1 [Emery et al.]. Band 4 infrared AVHRR imageswith superimposedadvectivesurfacevelocitiesfor (a) 1208 PST June 16, 1985, with velocitiesfor the June 16--17image pair and (b) 0257 PST June 17, 1985, with velocitiesfor the June 17-18 image pair.
t t
t3 t3
o
95
5
.
'
Plate 2a
Plate 2b
Plate 2 [Emery et al.]. Band 4 infrared AVHRR imageswith superimposedadvectivesurfacevelocitiesfor (a) 0811 PST July 26, 1985,with velocitiesfor a pair of July 26 imagesat 0811 and 1937 PST and (b) 1353 PST July 28, 1985,with velocitiesfor a pair of July 28 imagesat 1353 and 1854 PST.
13,086
EMERY ET AL.: COMPUTING ADVECTIVESURFACEVELOCITIES
ß...
June ,o
ß
Buo9 ½. !
ß
Plate 3 [Emery et al.]. Enlargements of the southwest corner of image from June 16 with advective velocitiesfrom June 16-17 and trajectoriesfrom surfacedrifters4.1 and 7.1.
%
June
Plate 4 [E•nery et al.]. Enlargementsof the southeast corner of the June 17 image with June 16-17 advective velocitiesand contours of 15/110-dbar dynamic height (contour interval - 0.005 dyn m) from the CTD casts(station positionsare indicated by white dots).