An OLAP System for Network-Constrained Moving Objects Tao WAN
Karine Zeitouni
Xiaofeng Meng
PRISM – Versailles University 45 avenue des Etats-Unis F-78035 Versailles Cedex, France 33 139254087
PRISM – University Versailles 45 avenue des Etats-Unis F-78035 Versailles Cedex, France 33 139254046
Renmin University of China
[email protected]
[email protected]
[email protected]
100872 Beijing, China 86-10-62519453
ABSTRACT
historical analysis of MO trajectories to support decision-making.
The continued advances in mobile devices, geo-location wireless sensors and positioning technologies have led to a profusion of Moving Object (MO) data. However, conventional On-Line Analytical Processing (OLAP) systems cannot be applied to MO analysis because the position dimension evolves continuously over time. In this paper, we consider the representation of networkconstrained MOs in OLAP systems and make the three following contributions: (i) We introduce a logical model to support continuous dimensions and facts. (ii) We propose an efficient data structure to index moving objects. (iii) Based on this index structure, we describe an algorithm which optimizes OLAP queries for analyzing MOs.
Let us take an example in environmental health. In this field, experts are interested in analyzing the exposure of population subgroups (e.g., classified by gender, by age, or by profession) to pollution during their daily trips1. This leads to the following typical aggregation queries: Q1: How many persons are exposed to the pollution fields? Q2: How many persons by age category are exposed to the pollution fields? Those queries require mainly aggregation of MOs (here persons) grouped by location, time, and eventually MO attributes (like age). They can be expressed as follows in SQL: SELECT p.location, p.time, count (distinct m.id) AS mo_count FROM moving_person m, pollution p WHERE m.trajectory INTERSECTS (p.location, p.time) GROUP BY p.location, p.time
Categories and Subject Descriptors H2.8 [Database Applications]: Spatial databases and GIS
SELECT p.location, p.time, m.age, count (distinct m.id) AS mo_count FROM moving_person m, pollution p WHERE m.trajectory INTERSECTS (p.location, p.time) GROUP BY m.age, p.location, p.time
General Terms Algorithms, Design, Experimentation.
Keywords Moving object databases, OLAP, Spatiotemporal indexing, Aggregate queries, Query optimization.
Nowadays, OLAP systems are widely recognized as proven and efficient analysis tools. The aforementioned aggregation queries are analogous to those in OLAP systems. However, current multidimensional models do not apply to MO analysis as required by the above queries for two main reasons. First, they require data aggregation by “ranges” of time and space. The aggregation results depend on the MO trajectory that continuously varies in spatial and temporal dimensions. But, multidimensional models are all based on discrete dimensions around discrete facts. Second, they involve spatiotemporal predicates (like the predicate INTERSECTS), which are not supported in usual OLAP systems.
1. INTRODUCTION The management of moving object (MO) databases has received considerable attention during the past few years due to the rapid advances in positioning technologies and mobile devices [4]. Most of this work fits in with the transactional context and mainly aims at: (i) Modeling MOs trajectories [14]; (ii) Indexing motion and trajectory representations; and (iii) Location prediction and query processing [13]. However, many applications require the
Related works: The topic of spatial data warehouse (DW) was first addressed by Stefanovic et al. [11]. Several proposals related to spatiotemporal DW exist, among witch the continuous view of the DW defined by Ahmed et al. [1]. But, those approaches do not
Permission to make digital or hard copies of all or part of this work for personal or classroom use is granted without fee provided that copies are not made or distributed for profit or commercial advantage and that copies bear this notice and the full citation on the first page. To copy otherwise, or republish, to post on servers or to redistribute to lists, requires prior specific permission and/or a fee. SAC’07, March 11-15, 2007, Seoul, Korea. Copyright 2007 ACM 1-59593-480-4/07/0003…$5.00.
1
13
This application is related to HEARTS (Health Effects and Risk of Transport Systems), a European research project in the Thematic Programme on Quality of Life and Management of Living Resources (http://www.euro.who.int/hearts).
which movement is restricted to the network (e.g., cars move on roads), the object location at each timestamp could be given by a relative position in a road segment instead of absolute coordinates in the 2D geographical space.
consider the case of MOs. The first work related to DW for MOs is made by Papadias et al. [7]. However, the authors consider a specific context where only the number of MOs by zone and time interval is known in the original data. They use a conventional data cube and extend the slice operator to spatiotemporal queries. They propose an indexing method combining R-tree and B-tree to store historical measures and accelerate their aggregation for spatiotemporal queries. In the continuation of this work, Tao et al. [12] raise the problem of double counting, since a MO having crossed several spatiotemporal units may be counted several times. To solve this problem, they propose a probabilistic estimation of the number of MO in a so-called sketch index. Limited by their hypothesis, those models can neither represent the individual object trajectories, nor their descriptive attributes (e.g., age, gender). Moreover, OLAP queries can only provide approximate statistics, though the method proposed in [12] enhances this approximation. Recently, a multidimensional modeling for MOs was proposed by Savary et al. [10]. The objective of this work is to integrate the properties of MOs in the analysis of their mobility. However, it is based on predefined units of space and time dimensions, and so, it fails to support spatiotemporal queries that do not conform to those predefined units. Jensen et al. [6] deal with the particular case where spatial values exhibit partial containment relationships in predefined dimension hierarchies. They propose different techniques to manage the imprecision in aggregation paths.
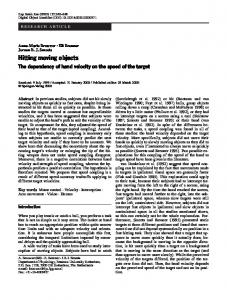
This allows us to use a technique of dimensionality reduction inspired from the proposal of Pfoser and Jensen in [9]. It is indeed possible to map the road segments to intervals of a 1D-space – called transformed network TN - as in figure 1. We adapt this transformation by numbering the road segments and aligning them one after the other along TN2. Meanwhile, projecting any relative position posi (normalized between 0 and 1) to a road segment ridi (i ∈ 1..k) will transform it into a 1D absolute value p in the TN axis such as: p = i’ + posi (i’ ∈ 1..k). Y 8 n2
7
n3
pos =0,1
6
r2
r3
5 n5
4 3 2
r1
r4 n4
n1
1 0
Motivated by the limitations of existing work, this article proposes a novel multidimensional model for MOs in an OLAP system. This model is twofold: it captures the continuous variability of MOs as well as their descriptive attributes; it allows precise aggregations of MOs for any spatiotemporal query. Besides, as the great majority of the mobile objects move in a constrained geographic environment (e.g., within road networks), we focus on network-constrained MOs. Relative location of objects to the network allows us to reduce the dimensionality and to optimize storage costs [9].
2
1
4
3
5
6
7
8
X
p=2,1 0
1
Tr3
2
Tr2
3
4
TN ’
Figure 1. Transformed Network. Projecting a whole MO trajectory to TN will map it to one or many 2D lines. Hence, a network-constrained trajectory T, usually represented in 3D (2D for position plus 1D for time), is translated into a 2D transformed trajectory TT as shown in figure 2. Therefore, querying MO trajectories is reduced to querying 2D spatial features: a spatiotemporal query in the original 3D space is replaced by 2D range queries (sub-queries) in the 2D (TN, Time) space. This makes it possible to use regular 2D spatial access method to solve these sub-queries.
Contributions: (1) In order to describe the continuous variation of MO trajectories, we extend the conventional concepts of DW modeling by introducing continuous dimensions and facts, and then we define mobile facts. (2) We project the network to a one dimensional space, and derive a data structure to represent mobile facts. (3) We propose and implement an index structure and use it to optimize spatiotemporal aggregate queries for networkconstrained MOs.
The advantages of such technique are: (i) to simplify the representation of space without losing its properties; and (ii) to reduce the overall storage space. Its drawback however is the increase of the number of sub-queries after the query mapping, which may affect the query performances. Section 4 will describe how we cope with this problem.
The rest of this paper is organized as follows. Section 2 presents the underlying spatiotemporal model; Section 3 introduces our multidimensional data model and data structure. Section 4 proposes a novel spatiotemporal index and describes an algorithm for spatiotemporal aggregate queries. Section 5 reports experimental results. Section 6 concludes the paper with a discussion and an introduction of future works.
Furthermore, unlike many related works, we do not restrict MOs to their trajectories, but consider their attributes. Hence, we define m
a Moving Object by a tuple: (mid, A1, A2, …An, (tid i ) i =1 ) where
2. SPATIOTEMPORAL MODEL
mid is its identifier, Aj (j ∈ 1..n) denote the object attributes, and tidi (i ∈ 1..m) refers to trajectories made by this object.
In this section, we introduce some preliminaries about the network and network-constrained MOs in transactional context, from where our multidimensional model is derived. A road network is commonly modeled as a set of road segments (mid-blocks) and nodes (junctions). In the context of MOs in
2
14
Notice that the mapping in [9] generates unconnected intervals.
3. MOVING OBJECT DATA WAREHOUSE DESIGN
insufficient when the selection and grouping criteria are different from those predefined in the cube.
By considering the aforementioned requirements, we propose to extend the concepts of dimension and fact to continuous. Hence, beside conventional dimensions and facts, called here discrete dimensions and discrete facts, we introduce:
This occurs when no spatial (or temporal) hierarchy exists, or if the query groups do not conform to the predefined hierarchies. For instance, in the query example Q1, the daily mobility map is aggregated according to the pollution map that is previously unknown (here, the spatial pollution fields vary in time). Thus, the aggregate groups are dynamic. This makes it difficult to apply the common pre-computation techniques like in [11] or approximation techniques using partial containment like in [6].
Definition 1: A continuous dimension is defined as a continuum3. Definition 2: A continuous fact is defined as a continuous function that depends on one or several continuous dimensions.
Besides, the transformation of data into a lower dimensional space engenders also the transformation of the spatial queries. Enlightened by these points, we propose in the next subsection an index structure called Transformed Trajectory R-tree (TTR-tree). Then, we use this index to implement spatiotemporal aggregates for constrained moving objects.
In fact, our definition allows defining continuous views of spatiotemporal cubes as in [1] by an interpolation function on space and time. More importantly, it allows real MO modeling in a data warehouse using a particular case defined as follows. Definition 3: a mobile fact is a fact defined by a continuous function FMO(t) = s from the time dimension to the space dimension for a given moving object MO.
4.1 The Proposed Index: TTR-tree As emphasized in section 3, efficient support of spatiotemporal aggregate queries is needed. The TTR-tree is a combination of a spatiotemporal index and an “aggregate oriented” index. In fact, since mobile facts are mapped to 2D spatial objects, spatiotemporal queries can be optimized by using a 2D R-tree as in |7].Moreover, bitmap indexes are recognized as efficient optimization technique for aggregate queries.
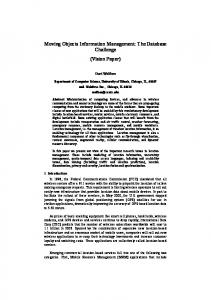
The rest of this paper focuses on this particular case. Actually, a mobile fact measures the presence of a moving object in the space and time dimensions. Thus, it represents a trajectory of the MO. As emphasized in section 2, when this trajectory is constrained by a network, it can be mapped in 2D. This is illustrated in figure 2. In this model, three dimensions are considered: MO Identity, The transformed network and the time dimension. Transformed Network
1
0
0
1
1
0
1
1
Mary Fred Jack Tao 1
Identity
1
1
0
R1
R2
R3
R4
1
0
1
1
Mary Tr4
Fred
Tr3 Tr2
Tao
Transformed Network
Tr1
Jack
Time Trid4
Figure 2. Multidimensional model for constrained MOs. Therefore, it becomes possible to implement mobile facts as 2D spatial objects, which support is now common in database systems. More precisely, a mobile fact is represented as an object: (mid, A1, A2, …,An, i=1..k). Notice that, unlike the model in [14], those 2D lines are not necessarily straight lines and may reflect the speed variation.
Q
Trid3 Trid2 Trid1
4. SPATIOTEMPORAL AGGREGATE QUERIES ON MOVING OBJECT
R3
R4 R1
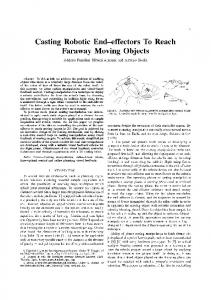
Figure 3. An example of TTR-tree.
Time
The TTR-tree extends an R-tree structure by adding in each node a reference to a bitmap index. This bitmap indicates all MOs whom trajectories intersect the node rectangle. In fact, except in leaf nodes, each internal node in TTR-tree has the form: where pointer refers a child node in the tree, MBR stands for Minimum Bounding Rectangle of this child node, and bitmap_pointer refers to a bitmap index on the MO table. So, the bitmap size is equal to the total number of MOs and
The implementation of data cubes commonly uses different optimization techniques for OLAP queries, the main of which are indexation and pre-aggregation. Nevertheless, these methods are 3
R2
A continuum in mathematics is a set that is infinite and everywhere continuous, such as the set of points on a line. (Hutchinson Encyclopedia: http://encyclopedia.farlex.com)
15
for a bit position p, the index value is set to 1 if and only if the trajectory of the MO occurring at row p in the collection intersects the MBR. Entries in leaf nodes store the segment itself and the MO row number. An example is illustrated in figure 3.
5. EXPERIMENTAL EVALUATION This section experimentally evaluates the proposed index TTRtree by comparing it with other approaches. Although aR-tree [7] also combines an R-tree with aggregates, it does not support holistic functions4 such as “distinct count”. This is the reason we have chosen two other indexes: The technique of Pfoser and Jensen in [9] that converts the trajectories of MOs from 3D to 2D and indexes them using an R-tree (we call it Pfoser for simplicity); and 3DR*-tree [2]. Section 5.1 introduces the datasets used in the comparison and the corresponding parameters. Section 5.2 examines the TTR-tree space consumption. Then, section 5.3 evaluates its efficiency in answering spatiotemporal aggregate queries.
4.2 Spatiotemporal aggregate algorithm Based on the TTR-tree, we have implemented an algorithm which optimizes spatiotemporal aggregate queries. The algorithm returns a bitmap index referring to the MOs that intersect the spatiotemporal query window Q. The interest of using bitmaps rather than an aggregate value as in [5] [7] is the ability to deal with any aggregate and particularly holistic ones because object identities are kept. This avoids the problem of double counting in [7], and fulfils our requirement to combine spatiotemporal and other MO dimensions. Let us take the query Q2 as an example. We previously built a regular bitmap index for the attribute “age” (each age category corresponds to a bit vector). To solve Q2, we use Q1 result (which consists in a bitmap for each combination of location and time); then, we perform an AND between this result and the bitmap index of “age”; finally, we compute the aggregates. Notice that in case there is no other dimension than the trajectory, the TTR-tree completely stores the MO data warehouse, by replacing MO row numbers by trajectory ordering numbers.
5.1 Experimental setting For pages other than the first page, start at the top of the page, and continue in double-column format. The two columns on the last page should be as close to equal length as possible. In these experiments, we have used the two real-world road networks: Oldenburg, San Joaquin, comprising 7035 and 24123 edges, respectively. Due to the lack of real data, the MOs and their trajectories are created by the network-based data generator developed by Brinkhoff [3]. For each of the two networks, we have set the number of generated MOs per timestamp (parameter Obj./time) to 20 MOs. We have varied the total number of timestamps (parameter Max.time) in order to generate different trajectory data sets: Max.time is set to 500 and 1000 respectively. Consequently, for each network, trajectory datasets are generated for 10000 and 20000 MOs. At the end, we obtain different trajectory data sets, described in table 1.
Basically, the search algorithm is similar to the window-query algorithm for common R-trees. But unlike R-trees, when an MBR is totally enclosed in the query window, there is no need to visit the corresponding sub-tree, since the bitmap in the current tree level delivers directly the useful information. As an example, suppose a spatiotemporal query mapped to the shaded query window Q of figure 3. The search starts from the root of the TTR-tree. R2 and R3 are totally contained in Q and the corresponding bitmaps are retrieved. Therefore, the next level of the R-tree does not need to be accessed, and the contribution of R2 and R3 to the query result consists of the bit vectors 1001 and 1011. The second root entry of the R-tree, R2, partially overlaps the query window so the corresponding node is visited and its MOs are retrieved to check which objects are included in the query q. To merge the result, a logical OR is performed on the bitmaps. Here, it performs: 1001 OR 1011 OR 0010 = 1011.
Table 1. Parameter configurations of different datasets
The above example considers the case where the mapping of the original spatiotemporal query produces a unique query, whereas it could be split in several sub-queries in general case. As an example, the mapping of a spatiotemporal query adopted in [9] produces as many sub-queries as the crossed road segments, which may affect the query performances. To remedy this problem, we increase the probability for the spatial sub-queries to be adjacent. At this end, we number the road segments according to their order in the leaves of an R-tree index built on the original network, and map them to intervals accordingly. Then, during the query mapping phase, we merge the adjacent sub-queries. Since our mapping of the network produces connected intervals, the query mapping results mostly in adjacent sub-queries. This provides an important optimization compared to the algorithm in [9], which has been confirmed by the experiments bellow.
Dataset
Network
DS1
Oldenburg
Max time 500
DS2
Oldenburg
DS3 DS4
Data size
#Trajectory segments
24.1 MB
407419
1000
49.4 MB
829103
San Joaquin
500
57.4 MB
804660
San Joaquin
1000
114.1MB
1640815
5.2 Storage costs The TTR-tree is an integration of the R-tree with bitmap indices which gives the identifier of MOs at each granularity level. These bitmap indices engender inevitably an additional storage cost compared to a normal 2D R-tree. This is the reason it is important to evaluate the space consumption for TTR-tree and to compare it with other indexes. The result is shown in Table 2. We remark that the 3DR-tree occupies more than three times the space required in the other methods. We also notice the proximity of the sizes of the other methods. The TTR-tree with bitmap indices has nearly the same size as Pfoser index, even if the number of MOs is augmented as in DS2 and DS4.
4
16
Holistic aggregate for a group computation cannot be derived from the aggregates of its sub-groups.
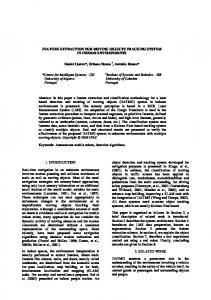
The performances of various indexing methods are mainly measured by the number of nodes accessed during the processing of workload. Usually, a spatiotemporal aggregate query involves two parameters that affect the performance: (i) the area of the query window (qs), represented as area fraction over the spatial universe, and (ii) interval length (qt), represented as a fraction over the time history. These parameters have identical values for all queries in the same workload.
Table 2. Comparison of storage costs Dataset
Pfoser index
3D R-tree
TTR-tree
DS1
8925K
34753 KB
9025 KB
DS2
18020 KB
71351 KB
18884 KB
DS3
18251 KB
67616 KB
18221 KB
DS4
36849 KB
138601 KB
38399 KB 80000
5.3 Query costs
70000
The tested query here is a count distinct combined with spatiotemporal search for various query sizes and positions.
60000
DS1 qs=16% Index P fo ser
E/S
50000
3D R-tree
40000
TTR-tree
30000 35000
20000
DS1 qt=10%
E/S
30000 25000
Index P fo ser
20000
3D R-tree
10000 0 1%
15000
qt
10%
30%
50%
7000
10000
DS3 qs=16%
6000
5000
0.5%
2%
qs
8%
16%
E/S
0 32%
5000
Index P fo ser
4000
3D R-tree TTR-tree
3000 2000
60000
DS2 qt=10%
50000
1000 0
Index P fo ser
40000
E/S
5%
TTR-tree
1%
3D R-tree 30000
5%
qt
TTR-tree
10%
30%
50%
160000 20000
140000
10000
120000
0
100000
DS2 qs=16%
0.5%
2%
qs
8%
16%
E/S
Index P fo ser 32%
3D R-tree
80000
TTR-tree
60000 12000
40000
DS4 qt=10%
10000
20000 0
Index Pfoser
8000
E/S
1%
3D R-tree 6000
qt
10%
30%
50%
12000
4000
DS4 qs=16%
10000
2000
Index P fo ser
8000 0.5%
2%
qs
8%
16%
E/S
0 32%
3D R-tree TTR-tree
6000 4000
6000
DS3 qt=10%
5000
2000 0
Index P fo ser
4000
E/S
5%
TTR-tree
1%
3D R-tree 3000
TTR-tree
2000
5%
qt
10%
30%
50%
Figure 5. Cost vs. size of the query time extent.
1000 0 0.5%
2%
qs
8%
16%
Besides, the dimensionality reduction technique leads to transform the query to sub-queries. Therefore, the query processing cost is also largely determined by the number of transformed sub-query windows, which, in turn, is governed by
32%
Figure 4. Cost vs. size of the query spatial extent.
17
model towards support of multiple time variant parameters (e.g. sensor). Then, we will study the capacity of predicting the future locations of MOs by anticipated updates in TTR-tree. Finally, we plan to define new trajectory aggregates [7] that produce spatiotemporal results.
the ability to map to consecutive intervals the road segments that are initially close to each others. In this experiment, queries are generated by varying: (i) the position of each query window, uniformly distributed in the spatial universe in order to avoid meaningless queries that fall into empty areas; (ii) the interval uniformly distributed along the time; (iii) the spatial query size, and (iv) the temporal interval length. In total, we generated a set of work loads, each consisting of 500 window queries with the same size. The selected values for qs are 0.5%, 2%, 8%, 16% and 32% of the universe, and qt 1%, 5%, 10%, 30% and 50% of the history length. The node size is set to 1KB in all cases. The R-tree implementation is based on R*-tree.
ACKNOWLEDGEMENTS The authors would like to thank Dennis Shasha for his reading and discussions about the ideas of this paper. This work has been partly supported by the French-Chinese Advanced Research Program (PRA SI 05-04 titled “Management Techniques of Moving Objects on Road Networks” involving the authors).
Figure 4 compares the aggregate query processing cost of each indexing method by varying the size of space extent qs for the four datasets. Figure 5 compares the aggregate query processing cost by varying the size of time extent qt. The measures reflect the input/output (I/O) costs, since this is usually the bottleneck in such query processing.
7. REFERENCES [1] Ahmed T., Miquel M. Laurini R. Continuous Data Warehouse: Concepts, Challenges and Potentials. 12th Int. Conf. on Geoinformatics, 2004.
We notice that the TTR-tree always outperforms the 3DR-tree and Pfoser index for every dataset. Moreover, the performances of 3DR-tree and Pfoser index decrease quickly when the window size (qs or qt).increases. Indeed, a larger window covers more indexed objects, which requires many accesses to reach the tree leaves. By contrast, in the TTR-tree, the access stops since an intermediate node is contained in the query window. This enormously reduces the I/O costs. Moreover, the method of Pfoser indexing is more sensitive than the TTR-tree to the enlargement of the spatial query extent qs. It explodes when qs exceeds 32% of the total size. As expected in section 4.2, this is due to the difference in the query mapping process between the two methods.
[2] Beckmann, N., Kriegel, H., Schneider, R., Seeger, B. The R*-tree: an Efficient and Robust Access Method for Points and Rectangles. Proc. of ACM-SIGMOD, 322-331, 1990. [3] Brinkhoff T. Network-based Generator of Moving Objects. http://fh-oow.de/institute/iapg/personen/brinkhoff/generator/ [4] Güting R.H. and Schneider M., Moving Objects Databases. Morgan Kaufmann Publishers, 2005. [5] Ho C., Agrawal R. Megiddo N., Srikant R., Range Queries in OLAP Data Cubes. Proc. of ACM SIGMOD, 73-88, 1997. [6] Jensen C. S., Kligys A., Pedersen T.B., Timko I., Multidimensional data modeling for location-based services. The VLDB Journal, vol. 13 n° 1, 1-21, 2004.
6. CONCLUSION
[7] Lopez I.F.V., Snodgrass R. and Moon B., Spatiotemporal Aggregate Computation: A Survey, IEEE TKDE, 17(2):271286, 2005.
This paper has exposed a novel approach to multidimensional modeling for network-constrained MOs. We have proposed an extension of multidimensional modeling, introducing the notion of continuous dimension and continuous fact. Based on this extension, we have defined a logical model for mobile facts and then, we have derived a physical level that is based on spatial data type. Regarding OLAP principles, this extension enables the navigation in the hypercube at very fine levels of the analysis dimensions, and thus the user can create personal hierarchies according to the applications.
[8] Papadias D., Tao Y., Kalnis P., Zhang J., Indexing SpatioTemporal Data Warehouses. ICDE, 166-175, 2002. [9] Pfoser D. Jensen C.S., Indexing of Network-constrained Moving Objects. ACM-GIS, 25-32, 2003. [10] Savary L., Wan T., Zeitouni K., Spatio-Temporal Data Warehouse Design for Activity Pattern Analysis. DEXA Workshop on Geographic Information Management, 814818, 2004.
In the context of MO analysis, the proposed model captures the MO variability. It provides tools to analyze object mobility together with their other attributes. To efficiently implement our model, we have exploited the constrained location property of MOs to represent their trajectories in a lower dimension space. Then, we have proposed a novel index structure, combination of a spatial index and a bitmap index which supports an algorithm for spatiotemporal aggregates. Experiments show a large superiority of our approach compared to existing spatiotemporal indexes for a useful class of queries. Furthermore, we resolve the double counting problem encountered in the former methods [7][12]. We believe the concept of continuous dimension and facts would apply to other decisional applications than MOs such as financial or scientific applications. In future work, we will extend our
[11] Stefanovic N., Han J., Koperski K., Object-based selective materialization for efficient implementation of spatial data cubes. IEEE TKDE, 12(6):938-958, 2000. [12] Tao Y., Kollios G., Considine J., Li F., Papadias D., Spatiotemporal Aggregation Using Sketches. ICDE, 214225, 2004. [13] Tao, Y., Papadias, D.: Time-Parameterized Queries in Spatio-Temporal Databases. Proc of ACM SIGMOD, Wisconsin, 334-345, 2002. [14] Vazirgiannis. M. and Wolfson. O.: A Spatiotemporal Query Language for Moving Objects. Proc of SSTD, 20-35, 2001.
18