An Ontology-Based Approach for Product Entity Resolution on the Web Raymond Vermaas, Damir Vandic, and Flavius Frasincar Erasmus University Rotterdam PO Box 1738, NL-3000 DR Rotterdam, The Netherlands
[email protected], {vandic, frasincar}@ese.eur.nl
Abstract. Product entity resolution is an important part of online product search, where product entities coming from different websites need to be aggregated in the search results. In this paper, we propose an approach to product entity resolution using the descriptive power of an ontology. In our algorithm, we use similarity measures that are defined specifically for each type of product feature and learn the feature weights by means of a genetic algorithm. In the evaluation of our algorithm, we obtain F1 -measures of 59% and 72% for two product classes that we consider. The obtained results are significantly better than those obtained from a state-of-the-art product entity resolution algorithm.
Keywords: entity resolution, product ontologoy, product features
1
Introduction
With the current increase in Web sales [5], online product search has become an important tool for consumers on the Web. The main reasons for its popularity are simple. First, it allows consumers to search for products they prefer. Compared to traditional shopping, online shopping makes it easier for consumers to find their desired product using information search facilities. Second, by comparing several Web shop offers, consumers have a good overview of the available prices, which allows them to choose the best bargain. However, online product search providers, like Google Product Search and Shopping.com, are suffering from several issues. One of these issues is that the automatic retrieval of products is not easy, as there is some manual work involved if one wants to display the correct product information. The reason for this is that most products are available on more than one website, which results in retrieving products multiple times from different Web shops. In this case, one need an approach to automatic product entity resolution, i.e., automatically finding duplicate products. In other words, in order to allow for comparison of the product offers from different Web shops, it is necessary to map all the offers found to their corresponding product. One solution to this problem is to use a universal product domain ontology to describe products in Web shops. Although this is an interesting approach, it falls outside the scope and goal of this paper.
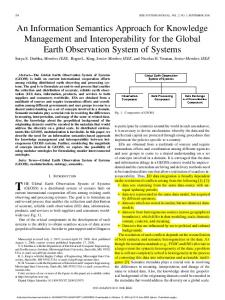
Fig. 1. Duplicate products in Google Product Search
An example of the product entity resolution problem is shown in Fig. 1. The picture shows two instances from the ‘SanDisk Sansa Clip+ 8 GB Digital player ’ on Google Product Search. Although these instances represent the same product, they are shown as two distinct products in the search result. The reason for this is that the information in the title and description is structured differently. Recent semi-automatic approaches for product entity resolution are able to obtain an F1 -measure between 45% and 81% [12,13]. In order to improve these results, in this paper, we consider the use of an ontology-based product entity resolution approach that automatically takes into account the product specific properties. Because product features are heterogeneous and can describe various aspects of products, we hypothesize that a feature-based approach for product entity resolution can improve the current state-of-the-art approaches. For describing products and their features, we make use of a product ontology that refines an existing upper-level e-commerce ontology. The structure of the paper is defined as follows. Section 2 explains the related work. In Sect. 3, we describe the various aspects of our product entity resolution framework. This is followed by the evaluation of our method in Sect. 4. Last, we conclude our work and give directions for future research in Sect. 5.
2
Related Work
Elmagarmid et al. [8] survey the domain of entity resolution and identify several important steps that are involved in this process. The first step mainly focuses on the extraction, transformation, loading (ETL), and standardization of data. The next step is field matching, which deals with the methods used to compare the fields of two selected records. In this step, three types of field matching methods are identified: character-based similarity (e.g., Levenstein), token-based similarity (e.g., n-grams), and phonetic similarity (e.g., Soundex). The next step describes the different duplicate detection techniques in which a set of records is processed. The authors divided the techniques into the following types: probabilistic matching, supervised learning, active learning, distance-based techniques,
rule-based techniques, and unsupervised learning. In the rest of this section, we present a few instances of such entity resolution algorithms. K¨ opcke et al. [12] perform entity resolution on product offers. This is the same domain as we use, only instead of using all the product features, the authors of this paper use only the title of product offers. From the title they extract the product features, the brand, and the model. Next, an adaptive learning strategy using three string measures is applied and a support vector machine for the entity resolution is used. For product matching, they use two different approaches. The Universal Product Code (UPC) is used as a reference mapping for the matching. This gives an F1 -measure of 55% for the product category non-accessories and 45% for the product category accessories. For the category TV’s, the authors achieve a F1 -measure of 69% and for the category digital cameras their approach achieved a F1 -measure of 81%. While the authors of [12] focus on only title of a Web page, we focus on the entire set with product features. Furthermore, because our goal is to have a fully automatic approach, we do not consider comparing our approach to this solution, as it requires to manually create regular expressions. In [22], the authors propose a method that determines whether two Web pages are referring to the same person. They assess the available features, like the URL of the Web page, most frequent names, and other text on the Web pages, using one or more similarity measures like the cosine similarity, string similarity, number of overlaps, Pearson’s correlation, and extended Jaccard similarity. As this method focuses on persons and unstructured data, it is less relevant for our approach, where we focus on products and a structured ontology. Lee et al. [15] use relational evidence to perform Web scale entity resolution. They divide the relational evidence in two types of evidence, negative evidence and positive evidence. The negative evidence relies on the birds of a feather principle, which states that entities that are not similar do not share the same properties. Unfortunately, the birds of a feather principle does not hold when performing entity resolution in the product domain, since product instances in the same product class have many properties in common (e.g., display size and display standard in the TV product class). For positive evidence the authors make use of Wikipedia. Since Wikipedia does not describe products with detailed feature information, we cannot use this approach. In [3] the authors investigate entity resolution in a customer database. The authors propose three algorithms for the propose of pairwise entity resolution. The first is G-Swoosh, a generic brute force algorithm. The second is R-Swoosh, where the source records are immediately discarded if a match between records is found. The last algorithm is F-Swoosh, which uses a cache of the compared data features to perform entity resolution. The authors report that G-Swoosh is extremely expensive and not practical when many matches occur. The authors also report that F-Swoosh is between 1.1 and 11.4 times faster than R-Swoosh. The focus of the three algorithms is on entity resolution in an arbitrary domain. This results in a general purpose matching and merging functions, which can be implemented in any domain. We use R-Swoosh as a starting point for our research, due to its scalability and extensibility.
3
Product Entity Resolution Platform
In this section we describe our entity resolution method for the domain of products, along with its implementation details. We start by giving a description of our problem followed by a more detailed discussion on the different parts of our solution. 3.1
Problem description
As explained in Sect. 1, Web shops use various ways to display their product information. If this information is aggregated into one product ontology, it might occur that the ontology contains some products more than once. With the here proposed product entity resolution framework, we aim to solve this problem. In order to reach this goal, we need to (i) find an efficient way to compare products, (ii) use the extra information available from the product ontology when matching products, and (iii) merge the matching products without losing information. The process of ontology population is outside the scope of this paper. For this task we refer the reader to existing literature [16,18]. 3.2
Overview of the proposed approach
Our proposed solution is called Product Entity Resolution Platform (PERP) and can be divided into two parts. The first part concerns the domain ontology, which contains the data and the structure of the product information. The second part covers the algorithm that employs novel matching and merging routines. In the first part of the approach, i.e., the domain ontology, we use OWL, the standard Web ontology language. An OWL ontology offers more expressivity than a relational database, which is normally used in the field of entity resolution [8]. Compared to relational databases, this increased expressivity allows us to create a more precise representation of a product. For example, entity resolution in a relational database is restricted to the predefined structure of a row, while in an ontology one can specify different types of relations between complex objects. The latter description makes it easier to differentiate between products. Various synonyms for products and product features are stored in our lexicalized domain ontology. This simplifies the instantiation of products from the Web by covering a large set of lexical representations. Although the actual instantiation of an ontology falls out the scope of this research, the structural description of products using domain ontologies can be exploited in the process of entity resolution, as we shall demonstrate. In this paper, an extension of the GoodRelations [10] Consumer Electronics ontology (CEO) [4] is used as the domain ontology. This ontology describes electronic products, like televisions and digital audio players. It also defines several property types (e.g., qualitative properties and quantitative properties) that can be used to describe products. We extend the CEO ontology by adding missing products, like Router and Laptop, and extending the already described products with more product-specific properties, like the number of HDMI ports
on a television or the number of headphone ports on a digital audio player. These extensions make the ontology more suitable for entity resolution, because of the extra information gained by using these new features. We also extended the Consumer Electronics ontology to support units of measurement, which is achieved using the The Unified Code for Units of Measure ontology (UCUM) [19]. This allowed us to add units of measurements to product properties and identify the relations between the units of measurements (e.g., meter vs. centimeter and inch vs. centimeter). Figure 2(a) shows an excerpt of the domain ontology from the UCUM ontology and Fig. 2(b) shows how for ‘Voltage’ the UCUM ontology and our product ontology are linked. As we can see, this is done using the ‘Quality value’ of UCUM and the ‘Quantitative value float’ from the CEO ontology. The second part of our platform involves the product matching and merging routines. The foundation that underlies our approach is the R-Swoosh algorithm [3]. The reason for choosing R-Swoosh is that the algorithm offers an efficient alternative to a brute-force approach in pairwise entity resolution by decreasing the number of comparisons needed. It is an abstract algorithm, which allows us to use custom match and merge functions. We did not choose for the more scalable F-Swoosh, because we experiment on a relatively small dataset for which caching is not needed. We use the R-Swoosh implementation of the Stanford Entity Resolution Framework (SERF) [2]. The pseudo-code of the R-Swoosh algorithm is shown in Algorithm 1. The requirements for the R-Swoosh algorithm are a set of records, a match function, and a merge function. First, an empty set of records I 0 is created. After this is done, the algorithm starts a loop that continues until there are no records left in the original set of records I. Within the loop, the algorithm first picks the first
Thing
UCUM Derived unit of measurement
Quality value
Physical quality
is-a is-a
is-a
is-a
Quality value
is-a
is-a is-a
Metric unit
is-a
is-a Prefix
Unit of measurement
is-a is-a
Basic unit of measurement
CEO
Quantitative value float
Thing is-a
CEO Quantitative value
is-a
CEO SI Unit
(a) An excerpt of the UCUM ontology
Voltage (V)
(b) An example of the link between UCUM and part of the CEO product ontology
Fig. 2. The UCUM ontology and the CEO product ontology.
Algorithm 1 The R-Swoosh algorithm [3] Require: a set of records, I Require: a matching function, match Require: a merging function, merge 1: I 0 ← ∅ {set of records without duplicates} 2: while I 6= ∅ do 3: currentRecord ← a record from I 4: remove currentRecord from I 5: candidate ← ∅ 6: for all records r0 in I 0 do 7: if match(currentRecord, r0 ) = true then 8: candidate ← r0 9: breakfor 10: end if 11: end for 12: if candidate = ∅ then 13: add currentRecord to I 0 14: else 15: r00 ← merge(currentRecord, candidate) 16: remove candidate from I 0 17: add r00 to I 18: end if 19: end while 20: return I 0
record from the original set of records I and removes it from I. Next, it checks if there is a record r0 in the set I 0 that matches the current record. If there is a matching record r0 , r0 is saved as a merging candidate of the current record. If a merging candidate is found, it is merged with the current record and the merging candidate record is removed from I 0 and the merged record is added to I 0 . If no merging candidate is found, the current record is added to the set I 0 . The result of the algorithm is the set of records I 0 , which does not contain any duplicate records. 3.3
Matching
In this section we describe the matching function of PERP. We start with an explanation of the different types of data and the corresponding distance measures. This is followed by a motivation for the use of product features weights. Last, we present the algorithm that employs the matching function. Matching functions Product features can be roughly divided in three categories. First, there are the qualitative properties. These properties contain mainly categorical data, for example, the different supported data formats in digital audio players. The second category are the quantitative properties, which contain quantitative data that differs per product instance, for example, the number of HDMI ports on a television. Quantitative properties can also be ex-
pressed in a particular unit of measurement, for example, the weight of a product in kilograms. The last category are the data type properties, which contain product features that do not fit in the two previous categories. These are mainly Boolean features (e.g., has remote control) and complex features (e.g., contrast ratio). For each of these categories we have different matching functions. The matching functions always return a Boolean value that indicates if two product instances match for a particular category. Matching functions can consist of an exact match or an approximate match between features, where the latter is achieved by using one or more distance measures and a threshold. The matching function of the qualitative properties is rather simple, it is an exact match between two product features. Such a precise comparison is needed, because these values are predefined in the domain ontology, so there is no room for their approximation. The quantitative values are handled differently. These are processed using two distance measures. The first is the numerical distance measure, which is defined as the relative difference between two values. If this distance is below a certain threshold, the values are considered similar. In case the quantitative value is a conjunction between a numerical value and a unit of measurement, we use the numerical distance measure for the numerical part and an exact match for the unit of measurement. The units of measurement are of the same magnitude in our representation. The data type property values are also processed using two types of distance measures. Boolean variables are compared using the exact match from the qualitative values and complex values (represented as strings) are compared using the Level 2 Jaro Winkler distance [11,17,21]. We have chosen to use this distance because it showed to perform well compared to other distance measures when used for string comparisons [6]. The Jaro distance is defined in Equation 1, where s1 and s2 represent two strings, m is the number of matching characters and t is half the number of transpositions to get from s1 to s2 . The Jaro-Winkler distance is calculated using the Jaro distance between s1 and s2 , the length ` of a prefix at the beginning of a string, and a factor p between 0 and 1 for an upwards adjustment of the score for having a common prefix. In our case, ` is set at 4 and p is set at 0.1, which is the optimal value reported by the used similarity measure library [6]. The Level 2 Jaro Winkler similarity in Equation 3 is somewhat different from the regular Jaro Winkler similarity function in Equation 2. It calculates the Jaro Winkler multiple times on contiguous subsets (wi and vj are the lists of characters of the original input strings), which gives a more robust similarity. djaro (s1 , s2 ) =
m m−t 1 m ( + + ) 3 |s1 | |s2 | m
djw (s1 , s2 ) = djaro (s1 , s2 ) + (`p(1 − djaro (s1 , s2 ))) Level2jw (s1 , s2 ) =
1 X max djw (wi , vj ) |s1 | w ⊂s wj ⊂s2 i
1
(1) (2) (3)
Weights Because products usually have many features, an interesting issue arises, i.e., among the products within a certain product type, some features are far more important than others. For example, all digital audio players are able to play MP3 files. This does not really help in the process of entity resolution, so we need to focus on the more distinct product features for entity resolution. To address the previous problem, we propose to use weights for the different product features. The weights are different for each product type, since some features (like weight) are used in multiple product types and can have a different importance depending on the product type. The weights are decimal values between 0.0 and 10.0. We determine the weights using a genetic algorithm built on the Watchmaker Framework [7], which is also used in the literature [9,14] and in the Apache Mahout project [1]. Our fitness function is the F1 -measure for a set of merged products. We use the genetic algorithm to determine the weights for one product type at a time. In order to run the genetic algorithm we split the data in a training and a test set, and run the genetic algorithm on the training set. Matching algorithm The matching functions and feature weights are used in the matching algorithm. The matching algorithm is outlined in pseudo-code in Algorithm 2. It executes a pairwise comparison on two records R1 and R2 containing product features that represent the same product type. In order to run this comparison, a set of keys of product features in the records is required, where a key is the name of the feature in the current concept. Each key has a similarity function that operates on the corresponding data type and a weight, as described previously. Another variable required for the algorithm is the matching threshold. This is the minimum percentage of matching product features and it is determined using a hill climbing procedure on the training dataset. In lines 1 to 3 of the algorithm the variables are initialized. The first two variables contain the weighted number of matching and non-matching product features. The matchResult variable contains the final result, which is the percentage of matching product features. Lines 4 to 14 show the first loop of the algorithm, which iterates through all the possible keys (product attributes) of the product type in question. In lines 5 and 6 the similarity function is selected for a certain key and the similarity is calculated for all possible pairs of values between the two records for a certain key. This is necessary, because a record can have multiple values for a certain key (e.g., weight in ounce and grams). Next the algorithm loops through all the results and adds the weight to matchCount if the result matches, otherwise, it adds the weight to noM atchCount (we simulate a multiplication with the weight here). In the last part of the algorithm (lines 14-15) the percentage of matching values is calculated and compared to the threshold. 3.4
Merging
The merge algorithm, shown in Algorithm 3, merges two records for a given set of keys. It starts by checking if the two records are exactly the same. If that is the case, one of the two records is returned. If that is not the case, the algorithm
Algorithm 2 Match function for PERP Require: a set of keys K of a particular product class Require: a set of matching functions S for K Require: a set of weights W for K Require: two records, R1 and R2 Require: a match threshold m 1: matchCount ← 0 2: noM atchCount ← 0 3: matchResult ← 0 4: for all k ∈ K do 5: /* The weights are used in simk */ 6: results ← simk (R1k , R2k ) 7: /* The simk is selected from S */ 8: for all result ∈ results do 9: if result = true then 10: matchCount ← matchCount + wk 11: else 12: noM atchCount ← noM atchCount + wk 13: end if 14: end for 15: end for matchCount 16: matchResult = matchCount+noM atchCount 17: return matchResult ≥ m
Algorithm 3 Merge function for PERP Require: a set of keys K of a particular product class Require: two records, R1 and R2 Require: R1 and R2 represent the same entity 1: if R1 = R2 then 2: return R1 3: end if 4: for all k ∈ K do 5: R1k ← R2k 6: end for 7: return R1
iterates through all the keys and adds for each key all the non-matching values of R2 to R1. The reason to add only non-matching values is that one does not want to have the same values twice in a record. We chose to also include the different values for matching keys, since we do not want to lose product relevant information. For example, if a product has a height in centimeters and in inches, we include both measurements in the new product. Also, in the case of contradicting product feature values, we keep both values. For example, one Web shop might suggest that a particular television has one HDMI port, while another Web shop might claim that it has two HDMI ports. Subsequently processing this data, an expert could decide which one of
the conflicting values is the correct one, although this step is not required by our platform.
4
Method Evaluation
In this section we evaluate our proposed approach. First, we analyze the structure of our data. Then, we give the details of the evaluation set-up. We conclude this section by reporting the evaluation results. 4.1
Structure of the data
In Sect. 3.2, we mentioned that our domain ontology was based on the GoodRelations Consumer Electronics ontology [4]. This ontology does not contain any product instances, so we had to instantiate those ourselves. As we mentioned previously, in a production environment, ontology population should be automated [16,18]. However, in order to perform a fair evaluation of the considered algorithms, we performed the instantiation manually. Having relatively detailed product descriptions in our data set, the instantiation and verification of this data turned out to be a very time consuming task, sometimes taking up to 5 hours per product instance. Consequently, we obtained a relatively small dataset, nevertheless of similar size as reported in related work for similar reasons [20]. We gathered data for only two product classes, i.e., TV’s and Digital Audio players, due to the tremendous effort involved in the manual instantiations. We chose for TV’s and Digital Audio Players because of the variation in the granularity of the available information for the two product categories. Whereas televisions are usually described in a lot of detail, the description of Digital Audio Players is often limited to some basic features, like color and memory capacity. In order to ensure that we would have enough duplicates to conduct our experiments on, we used two Web shops (BestBuy.com and NewEgg.com) to gather the data. We chose for these websites, since they both have a wide assortment in consumer electronics, which made it easy to find duplicates. We instantiated in total 49 products for two product types using the data from the two Web shops. We aimed to create a fair product distribution between BestBuy.com and NewEgg.com, so that we would not create a bias in our results, while at the same time have enough duplicate records for our product entity resolution algorithm. We also aimed to get a fair distribution between duplicate and non-duplicate records (or unique records) in order to prevent overfitting. The different distributions are shown in Table 1. In this table, B and N stand for the number of products from a Web shop within one category, where B is BestBuy.com and N is NewEgg.com. 4.2
Evaluation Setup
In the evaluation we compare our method, using multiple distance measures, feature weights, and a domain ontology, to the state-of-the-art method described
Table 1. Distribution of product instances
Digital Audio Players Televisions T otal
Duplicate 12 (B:6 N:6) 14 (B:7 N:7) 26
Unique 11 (B:5 N:6) 12 (B:6 N:6) 23
T otal 23 26 49
in [3], which uses no feature weights and only one distance measure, i.e., the Jaccard distance. However, for performance reasons, both methods use the RSwoosh algorithm. The experiments are run separately for each product class. In order to compensate for the small dataset, we ran our experiments 100 times. In each run, we randomly selected a training and a test set. The distribution of unique and duplicate records is the same for the training and test set and proportionately depends on the product distribution for each product class. In each run 60% of the products are randomly assigned to the training set and 40% of the products are randomly assigned to the test set, while fulfilling the above distribution constraint. The genetic algorithm is run for 100 generations for each random training set. This is only used for our own method. The method of [3] does not use weights, so there is also no need for a genetic algorithm. The same test set is used for both methods in each run. We tested different configurations of the crossover rate, mutation rate, and selection method for the genetic algorithm. We varied the crossover rate randomly from 10% up to 50% during one generation of the algorithm. The mutation rate was set to 15% and we used the Roulette Wheel selection as selection technique. These values were determined by using a hillclimbing procedure on the training dataset. The quality of the methods was measured by the F1 -measure of the merged products. We used the same measure as fitness function for the genetic algorithm. For the F1 -measure, we took a correctly merged product (duplicate records) as a true positive, the correctly non-merged products (unique records) as a true negative, the incorrectly merged products (merged unique records) as false positive, and the incorrectly non-merged products (non-merged duplicate records) as false negative. We ran our experiments on a computer with an Intel Core i5 480M processor and 8 gigabyte internal memory running Windows 7. 4.3
Results
We use a two-sample two-tailed paired t-test with a 95% confidence interval to compare our method to the benchmark method of [3] based on the F1 -measure from each run. The null hypothesis is H0 : µour = µref and the alternative hypothesis is HA : µour 6= µref . The µour is for our method and µref is for the reference method. From the parameter optimization process described earlier, we used the best parameters for both our own method and those for the benchmark method. For our own method, the best set of parameters are a match threshold of 0.8, a
threshold for the Level2 JaroWinkler distance of 0.9 and a threshold for the numerical comparison 0.9 (so a maximum difference of 10% between two numerical values). The benchmark method has a match threshold of 0.9 and a threshold for the Jaccard distance of 0.75. These parameters are applied for both product classes. When we ran the experiment, the F1 -measures varied from 0.0 up to 1.0 for both methods in both product classes. This can be easily explained by the fact that some product instances contain more information than others. So, if a test set contained mainly instances with little information, the F1 -measure was as expected low. The average F1 -measure over 100 runs for both algorithms can be seen in Table 2. As seen in the table, our PERP scores significantly better than the benchmark method on both product classes, so H0 is rejected. Another notable fact is the difference in results between the two product classes. This is caused by the amount of available information on one side and the feature weights in our method on the other side. We explain this in more detail in Sect. 4.4. Table 2. Algorithms results
Digital Audio Player Television
4.4
F1 PERP 0.7205 0.5945
F1 Benchmark 0.1770 0.5090
p-value 0.00001 0.02335
Weights
Feature weights are an important aspect in our algorithm. They compensate for poorly defined products by placing extra weight on distinct product features. In Tables 3 and 4 the weights and the occurrence for each property for the two product classes are displayed. The weights in this table are the weights from one of the hundred runs, where we scored an F1 -measure of 1.0. According to Table 3 the most distinctive features of a digital audio player are the equalizer, the number of speakers, and the display resolution. The least distinctive features are the color of the device, if the device is energy star qualified, and the playable data formats. One can note that the top quartile (average occurrence of 7.6) features do not occur that often, while the bottom quartile (average occurrence of 8.9) occur more often in digital audio player. Table 4 shows the optimal weights for the television product class. In this class the most distinctive properties are the screen refresh rate, the number of S-Video ports, and the number of headphone ports. The least distinctive properties are the number of component inputs, the number of HDMI ports, and the included accessories. For this product class we also note a similar difference as before in occurrence of property types between the top quartile (average occurrence of 12) and the bottom quartile (average occurrence of 15.4).
Table 3. Weights and occurrences of product features for digital audio player in a sample with a F1 -measure of 1.0 Property
Weight # Property
Equalizer
9.7815
1 ID3 Support
Speaker Quantity
9.7135
1
Display Resolution Horizontal
9.4167 10 USB Ports Quantity
Number Of Headphones Ports
9.1295
Connectivity
9.0639 14 Frequency Range 9.0590 21
Number Of HDMI Outputs Number Of FireWire Ports Signal To Noise Ratio Touchscreen
Radio Tuner
9.0417
7
Display Size
8.9628
9
Energy Source Display Resolution Vertical
8.8265
1
8.4469
9 Battery Capacity
Feature
Weight # Property Battery Recharge 5.4693 1 Time
Weight # 3.3551
2
7.8663
1 Data Interface Type
5.2975
1 Width
7.7340
1 Internal Microphone
4.5916
4
Aspect Ratio 5 Horizontal
4.3685
1 Height
6.7174
7 Operating Time
4.3015
2
2.0404
1
6.5416
1 Depth
4.2516 16 RAM
1.9861
1
6.4203
1 Brand
Compatible 4.1709 23 Operating System
1.8681
9
6.3963
1 Display Type
3.8912 10 Storage Capacity
1.2130 18
5.9332
5 Battery Run Time 2 Weight
3.8277 16 Body Color Energy Star 3.4892 14 Qualified
0.9336 14
5.8760
Number Of Batteries 3 7.0281 Required
Harmonic Distortion
Storage Media
Weight # Property Audio Interface 8.1945 2 Type
Aspect Ratio Vertical
Processor Clock Speed
Rechargeable Energy Power Requirement 8.3909 8 5.7717 12 3.4545 1 Data Format Source Voltage Average 7.6 Average 3.4 Average 8.0
2.5119 16 2.4145
1
2.1497 16
0.7361
1
0.6197 19 Average 8.9
Table 4. Weights and occurrences of product features for television in a sample with a F1 -measure of 1.0 Property Screen Refresh Rate Number Of S-Video Inputs Number Of Headphones Ports Height With Stand Weight
Weight 9.9975 9.7988 9.6010 9.4717 9.1658
Power Requirement Watt WiFi Connection
1 Speaker Quantity is EnergyStar Qualified 26 Display Size Usage Power 24 Consumption 3
Weight 7.8516 7.8372
Aspect Ratio Vertical 7.8881 26 Display Type Average 12.0 7.9980
4
#
2.3699
23 12
2.1499
26
7.4877
26 Body Color
5.1257
11 TV Tuner
2.0144
8
6.6786
10 Width
5.0085
26 Width With Stand
1.8466
14
20
4.7661
19
1.7918
17
1.4937
26
1.1473
19
0.9120
8
0.6787
1
6.5737
17 Contrast Ratio
Weight
2.2447
6.6714
6.2795
Aspect Ratio Horizontal 26 Response Time On Screen Menu 5 Language
5.6496
# Property Display Resolution Vertical Audio Output 4 Power
23
14 Depth
1 Depth With Stand Number Of Optical 5 Audio Outputs
8.3424
5.8089
5.3083
1 Feature
Connectivity
Weight
20 USB Ports Quantity
8.7001 8.4202
# Property Display Resolution 2 Horizontal Standby Power 12 Consumption
7.7690
8.9148
Remote Control
Number Of Lan Ports Resolution
# Property 24 Radio Tuner
3.2481 2.9610
6.2387
14 Height
2.8742
6.1846
19 Weight With Stand
2.5540
5.8650 1 Average 14.0
Number Of HDMI Inputs 4 Brand Number Of 12 Component Inputs Number Of HDMI 26 Ports 26 Accessory
Average 16.5
Average 15.4
The number of feature occurrences are different between the two product classes. The average number of occurrences for digital audio player is lower than that of TV’s. The better performance of our method for digital audio players, compared to our reference method, can be explained by the fact that the low number of occurrences is compensated by the discriminative feature weights.
5
Conclusion and Future Work
In this paper we investigated the problem of product entity resolution using a domain ontology-driven approach. Most solutions in the literature use databases for entity resolution, while employing the extra descriptive power of ontologies can help to obtain better results. We created a domain ontology for electronic
devices that is based on the GoodRelations [10] Consumer Electronics Ontology [4]. Our approach is based on the state-of-the-art R-Swoosh algorithm [3], as this approach is both extensible and scalable. We propose a novel matching algorithm that, differently than the matching algorithm from R-Swoosh, employs product feature type-specific similarity measures, determined by the type information stored in the product ontology. Furthermore, the proposed matching algorithm uses weights for the duplicate detection task, in order to account for the difference in importance among the product features. We evaluated our algorithm on a dataset that contains two different product classes: televisions and digital audio players. We obtained a F1 -measure on the merging of 59% on the television product class and 72% on the digital audio player product class. These results are significantly higher than the results obtained with the reference method [3]. From this, we can conclude that the use of product feature type-specific similarity measures and product feature weights improves the overall performance of product entity resolution. In future work we would like to further exploit the descriptive power of an ontology by employing negative relations to emphasize that a certain product does not have a certain feature. Also we plan to make use of the part-whole relations, e.g., a memory chip is part of a laptop rather than a simple property and thus should have a higher importance in the product matching process.
Acknowledgment Damir Vandic is supported by an NWO Mozaiek scholarship; project 017.007.142, Semantic Web Enhanced Product Search (SWEPS).
References 1. Apache: Apache Mahout. http://mahout.apache.org/ (2014) 2. Benjelloun, O., Garcia-Molina, H., Kawai, H., Larson, T.E., Menestrina, D., Su, Q., Thavisomboon, S., Widom, J.: Generic Entity Resolution in the SERF Project, in: Bulletin, June 2006, pp. 1-9. http://ilpubs.stanford.edu:8090/779 (2006) 3. Benjelloun, O., Garcia-Molina, H., Menestrina, D., Su, Q., Whang, S.E., Widom, J.: Swoosh: a Generic Approach to Entity Resolution. The VLDB Journal 18(1), 255–276 (2008) 4. Brandl, X., Deckert, C., Frommer, F., Karl, D., Koslowski, D., Schley, D., Sonntag, D., Wechselberger, A., Hepp, M.: CEO: Consumer Electronics Ontology - An Ontology for Consumer Electronics Products and Services. http://www. ebusiness-unibw.org/ontologies/consumerelectronics/v1 (2014) 5. Carini, A., Sehgal, V., Freeman Evans, P., Roberge, D.: European Online Retail Forecast, 2010 To 2015, Tech rep., Forrester Research, Inc. http://www.forrester.com/European+Online+Retail+Forecast+2010+To+ 2015/fulltext/-/E-RES58597 (2011) 6. Cohen, W.W., Ravikumar, P.D., Fienberg, S.E.: A Comparison of String Distance Metrics for Name-Matching Tasks. In: IJCAI 2003 Workshop on Information Integration on the Web (IIWeb 2003). pp. 73–78 (2003)
7. Dyer, D.W.: Watchmaker Framework. http://watchmaker.uncommons.org/ (2014) 8. Elmagarmid, A., Ipeirotis, P., Verykios, V.: Duplicate Record Detection : A Survey. IEEE Transactions on Knowledge and Data Engineering 19(1), 1–16 (2007) 9. Halalai, R., Lemnaru, C., Potolea, R.: Distributed Community Detection in Social Networks with Genetic Algorithms. In: 6th IEEE International Conference on Intelligent Computer Communication and Processing (ICCP 2010). pp. 35–41. IEEE Computer Society (2010) 10. Hepp, M.: GoodRelations: An Ontology for Describing Products and Services Offers on the Web. In: Knowledge Engineering: Practice and Patterns, Lecture Notes in Computer Science, vol. 5268, pp. 329–346. Springer Berlin / Heidelberg (2008) 11. Jaro, M.A.: Advances in Record-Linkage Methodology as Applied to Matching the 1985 Census of Tampa, Florida. Journal of the American Statistical Association 84(406), 414–420 (1989) 12. K¨ opcke, H., Thor, A., Thomas, S.: Tailoring Entity Resolution for Matching Product Offers. In: 15th International Conference on Extending Database Technology (EDBT 2012). pp. 545–550. ACM (2012) 13. K¨ opcke, H., Thor, A., Rahm, E.: Evaluation of Entity Resolution Approaches on Real-World Match Problems. VLDB Endowment 3, 484–493 (2010) 14. Kryvyy, R., Tkachenko, S., Karkuljovskyy, V.: Analysis of Frameworks for Developing Genetic Algorithms. In: 7th International Conference on Perspective Technologies and Methods in MEMS Design (MEMSTECH 2011). pp. 209–210. IEEE Computer Society (2011) 15. Lee, T., Wang, Z., Wang, H.: Web Scale Entity Resolution using Relational Evidence, Microsoft Research, Technical Report MSR-TR-2011-30. http://research. microsoft.com/apps/pubs/default.aspx?id=145839 (2011) 16. McDowell, L.K., Cafarella, M.: Ontology-Driven, Unsupervised Instance Population. Journal of Web Semantics: Science, Services and Agents on the World Wide Web 6(3), 218–236 (2012) 17. Monge, A., Elkan, C.: An Efficient Domain-Independent Algorithm for Detecting Approximately Duplicate Database Records. In: SIGMOD Workshop on Data Mining and Knowledge Discovery (DMKD 1997). ACM (1997) 18. Petasis, G., Karkaletsis, V., Paliouras, G., Krithara, A., Zavitsanos, E.: Ontology Population and Enrichment: State of the Art. In: Paliouras, G., Spyropoulos, C., Tsatsaronis, G. (eds.) Knowledge-Driven Multimedia Information Extraction and Ontology Evolution, Lecture Notes in Computer Science, vol. 6050, pp. 134–166. Springer Berlin/Heidelberg (2011) 19. Polo, L., Berrueta, D.: Measurement Units Ontology. http://idi.fundacionctic. org/muo/muo-vocab.html (2008) 20. Singla, P., Domingos, P.: Entity Resolution with Markov Logic. In: Sixth International Conference on Data Mining (ICDM 2006). pp. 572–582. IEEE (2006) 21. Winkler, W.E.: Using the EM algorithm for weight computation in the fellegisunter model of record linkage. In: Section on Survey Research Methods. pp. 354– 359. American Statistical Association (1990) 22. Yerva, S.R., Mikl´ os, Z., Aberer, K.: Towards Better Entity Resolution Techniques for Web Document Collections. In: 1st International Workshop on Data Engineering meets the Semantic Web (DESWeb 2010). pp. 209–214 (2010)