Hindawi Publishing Corporation Mathematical Problems in Engineering Volume 2014, Article ID 395263, 8 pages http://dx.doi.org/10.1155/2014/395263
Research Article An Optimized Classification Algorithm by Neural Network Ensemble Based on PLS and OLS Weikuan Jia,1 Dean Zhao,1 Yuyang Tang,1 Chanli Hu,1 and Yuyan Zhao2 1 2
School of Electrical and Information Engineering, Jiangsu University, Zhenjiang 212013, China Changzhou College of Information Technology, Changzhou 213164, China
Correspondence should be addressed to Dean Zhao;
[email protected] Received 19 May 2014; Accepted 30 June 2014; Published 20 July 2014 Academic Editor: Shifei Ding Copyright © 2014 Weikuan Jia et al. This is an open access article distributed under the Creative Commons Attribution License, which permits unrestricted use, distribution, and reproduction in any medium, provided the original work is properly cited. Using the neural network to classify the data which has higher dimension and fewer samples means overmuch feature inputs influence the structure design of neural network and fewer samples will generate incomplete or overfitting phenomenon during the neural network training. All of the above will restrict the recognition precision obviously. It is even better to use neural network to classify and, therefore, propose a neural network ensemble optimized classification algorithm based on PLS and OLS in this paper. The new algorithm takes some advantages of partial least squares (PLS) algorithm to reduce the feature dimension of small sample data, which obtains the low-dimensional and stronger illustrative data; using ordinary least squares (OLS) theory determines the weights of each neural network in ensemble learning system. Feature dimension reduction is applied to simplify the neural network’s structure and improve the operation efficiency; ensemble learning can compensate for the information loss caused by the dimension reduction; on the other hand, it improves the recognition precision of classification system. Finally, through the case analysis, the experiment results suggest that the operating efficiency and recognition precision of new algorithm are greatly improved, which is worthy of further promotion.
1. Introduction Neural network (NN) is based on the intelligent computing, which makes use of the computer network to imitate the biological neural network. It shows powerful function in dealing with nonlinear process and large-scale computing. The essence of classification system is regarded as an input/output system. The transformational relations are mainly about three aspects which includes numerical fitting, logical reasoning, and fuzzy transforming; all of these can be well expressed by neural network. The research of neural network classification has obtained widespread application in many fields [1]. However, while dealing with the small sample, it is a big challenge to use neural network to classify. Overmuch feature inputs will influence the structure design of the neural network and restrict the operating efficiency. However, fewer numbers of samples easily lead to incomplete training or overfitting, which restricts the final classification precision. Thus, in this paper, we introduce the feature dimension
reduction and ensemble learning into neural network algorithm. The principle of feature dimension reduction theory [2, 3] is to extract most useful feature from many complex feature variables, which eliminates the influence of repetition or correlation factors. It means that reducing the feature dimension as much as possible on the premise of solving the problems normally. Because feature dimension reduction will cause the loss of information, but it can’t influence the problem solving. To reduce the inputs of the neural network, we will design and simplify structure conveniently. Optimized neural network algorithm based on feature dimension reduction has obtained gratifying achievement in many fields [4–6]. The traditional feature extraction algorithm which depends on the measure of variance (such as principal component analysis, factor analysis, etc.) is hard to get ideal low dimensional data for small sample, which is with higher dimension and fewer samples. In this paper, we adopt partial least square (PLS) to feature dimension reduction algorithm [7, 8], which can take
2
Mathematical Problems in Engineering
the level of correlation feature variables and the dependent variables into consideration and obtain the relatively ideal low-dimensional data with strong interpretation. It has a unique advantage for dealing with small sample data. Using PLS to optimize the classification algorithm and neural network, it has got some progress [9–11]. Hansen and Salamon first proposed neural network ensemble learning [12]. They proved the performance of a series of integrated neural network is better than the best single neural network by the experiment; the generalization ability and recognition precision of multiple classifier integration system have been improved obviously. In order to improve the classification precision, the method of multiple classifiers integration has been considered. Meanwhile, the ensemble learning reaches a climax, a series of concepts and algorithms have been proposed [13–15], and applied in many fields. The history of neural network has more than 70 years; hundreds of models are proposed and different models have their own advantage in dealing with different problems. However, it is not perfect for the nature of neural network. In this paper, choose BP, RBF, Elman three neural networks as subclassifier to study. The integrator design is the key point of ensemble optimization algorithm, which is to determine the final recognition precision of integrated classification system. The key of ensemble learning is how to determine the weights of each subclassifier; it attracts many scholars’ research interests [16–18]. This study is using ordinary least squares (OLS) principle to ensemble learning for classification system, through establishing the regression equation to determine the weights of three subclassifiers. Brief and to the point, in view of the nature of small sample and neural network, in this paper, an ensemble optimized classification algorithm by neural network based on PLS and OLS is proposed. The new algorithm by PLS dimension reduction is to improve the operating efficiency and the recognition precision through OLS ensemble learning. The new algorithm aims at providing a high efficiency and precision classification system. Finally, through the test of two data sets, one from the actual production, the other one form UCI standard data sets, the experimental results suggest that the new algorithm is valid and worthy of further popularization and application.
2. PLS Dimension Reduction Algorithm Partial least squares is the characteristic development of ordinary least squares (OLS), its basic idea is that the feature variable matrix 𝑋 is reduced; at the same time, it gives consideration to the correlation of the dependent variable matrix 𝑌. Suppose there are 𝑛 feature variables, 𝑥1 , 𝑥2 , . . . , 𝑥𝑛 , 𝑝 dependent variables, 𝑦1 , 𝑦2 , . . . , 𝑦𝑝 , after preprocessing, matrix 𝑋 is reduced into 𝑋 = 𝑇𝑃𝑇 + 𝐸.
column of matrix 𝑇) and load vector 𝑝𝑖 (the 𝑖th column of matrix 𝑃); then the above formula can be written as 𝑛
𝑋 = ∑ 𝑡𝑖 𝑝𝑖𝑇 + 𝐸,
𝑖 = 1, 2, . . . , 𝑛.
(2)
𝑖=1
Similarly, matrix 𝑌 is decomposed into 𝑌 = 𝑈𝑄𝑇 + 𝐹.
(3)
Here, 𝑈 is the score matrix, 𝑄 is the load matrix, and 𝐹 is the residual error matrix. Matrix multiplication of 𝑈𝑄𝑇 can be expressed as the sum products of score vector 𝑢𝑗 (the 𝑗th column of matrix 𝑈) and load vector 𝑞𝑗 (the 𝑗th column of matrix 𝑄); then the above formula can be written as 𝑝
𝑌 = ∑ 𝑢𝑗 𝑞𝑗𝑇 + 𝐹,
𝑗 = 1, 2, . . . , 𝑟.
(4)
𝑗=1
PLS analysis separately extracted the scores 𝑡 and 𝑢 form corresponding 𝑋 and 𝑌; they are the linear combination of feature variables and dependent variables. And both scores satisfied the maximum load of variation information of feature variables and the dependent variables; the covariance between them is the largest. Establishment of the regression equation is 𝑢𝑗 = 𝑏𝑘 𝑡𝑖 .
(5)
Here, 𝑏𝑘 is regression coefficient; the formula can be expressed in matrix form as 𝑌 = 𝐵𝑋.
(6)
Here, 𝐵 is coefficients matrix; −1
𝐵 = 𝑊(𝑃𝑇 𝑊) 𝑄𝑇 .
(7)
Here, 𝑊 is the weights matrix. PLS aims to each dimension iterative calculation by using each other’s information; each iteration continuously according to residual information of 𝑋, 𝑌 to adjust 𝑡𝑖 , 𝑢𝑗 for the second round extracted, until the residual matrix element of absolute value approximate to zero. The precision satisfied the requirements; then the algorithm stops. In the iteration process, 𝑡𝑖 , 𝑢𝑗 can maximize the expression of variance of 𝑋 and 𝑌 simultaneously. PLS regression does not need to use all the components to establish the regression equation, which just need to select the front 𝑙 components (0 ≤ l ≤ 𝑛) and then get better regression equation. Generally, K-fold cross-validation method is used to calculate prediction residual sum of squares and determine the number of components extracted, reaching the purpose of dimension reduction.
(1)
Here, 𝑇 is the score matrix, 𝑃 is the load matrix, and 𝐸 is the residual error matrix. Matrix multiplication of 𝑇𝑃𝑇 can be expressed as the sum products of score vector 𝑡𝑖 (the 𝑖th
3. Neural Network Ensemble Optimization 3.1. Subclassifier (Individual Neural Network). Select BP, RBF, and Elman regression three different types of neural networks
Mathematical Problems in Engineering Input layer
x1 x2 .. . xn
3
Hidden layer Output layer wjk wij y
1
.. .
.. .
.. .
Input layer
x1
y2 x2 .. .. . . x n y
Hidden layer Output layer wij wjk y1 Σ
.. .
m
.. .
Σ .. .
y2 . ..
Σ
ym
Hidden layer Input layer w1 u1 x1 . .. .. x(k − 1) .
Output layer w3
ur
xn w2
y1
.. . y(k) ym
uc1 .. . Connecting layer uc𝑟
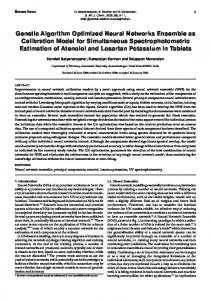
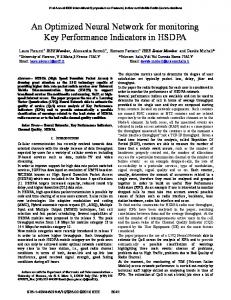
Figure 1: The topology structures of BP, RBF, and Elman neural network.
as subclassifier in this paper. These three subclassifiers, to a certain extent, play a complementary role. The topology structure of three neural networks is as shown in Figure 1. BP neural network is denoted by subclassifier I; it adopts the error back propagation learning. A three-layer BP neural network can imitate any nonlinear function with arbitrary precision. It has good adaptive robustness and generalization ability. With the expanding scope of application, the defects of BP neural network emerge gradually, which includes fixed learning rate that caused long training time, easily trapped in local minimum, and the overfitting illusion, hidden layer, and its uncertain neurons numbers. All these above become the inherent defects of BP network. RBF neural network is denoted by subclassifier II; it is a kind of feed forward model, which can adjust the hidden layer adaptively in the training process according to the specific problems. The distribution of hidden layer units is determined by the training sample’s capacity, category, and distribution. It can dynamically determine the hidden layer, even its center and width; meanwhile, the convergence speed is fast. The biggest advantage is to use linear learning algorithm to complete the work done by nonlinear learning algorithm and maintain high precision of nonlinear algorithm; it has the characteristics of the best approximation and global optimal. It can use the sum of local approximation to attain the global approximation of training data, so using the sum of low-order local approximation can be finished the training data fitting. During the training process, it is easily appear over-fitting phenomenon, low learning ability, and so on. All of these insufficient will lead the bigger prediction error, further influence the recognition precision of RBF neural network. Elman regression neural network is denoted by subclassifier III; it is a kind of feedback model that adds a context layer based on hidden layer of BP neural network. The context layer is regarded as a delay operator; it can delay and store the output of hidden layer and achieve the memory. That means the system has the ability of adapting the timevarying dynamic characteristics and strong global stability. Thus, Elman neural network optimization is always based on BP neural network, naturally; it inevitably inherits the inherent defects of BP neural network which will lead to the unsatisfactory operating efficiency. 3.2. Construct of Neural Network Ensemble Algorithm. Consider the complex pattern classification problems; single
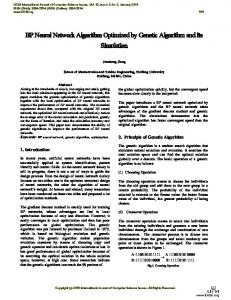
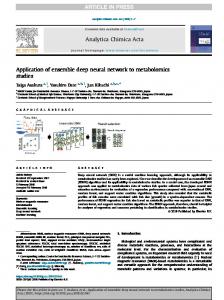
classifier is usually difficult to achieve the ideal recognition precision and has some of its own deficiencies. The generalization ability and recognition precision of multiple classifier integrated system will be more outstanding obviously. Each classifier is regarded as subclassifier of integrated system; the main idea of ensemble learning is mainly about using many subclassifiers to solve the same problem and integrating the outputs of each subclassifier, finally obtaining the results of integrated classification system. The purpose is to improve the ability of generalization and recognition of the learning algorithm. Neural network ensemble is a pattern classification system, which integrates a series of single neural networks. The performance of the integrated system is better than any single neural network. The main purpose of neural network ensemble is to improve the recognition precision of classification system. Obviously, determining the weights of each subclassifier is the key of ensemble algorithm. The main task of neural network ensemble algorithm is seeking the weights of each subclassifier based on the characteristics of subclassifier and reducing the recognition error of integrated classification system. There are three subclassifiers for ensemble learning, in order to deal with the small sample, adopt dimension reduction before ensemble learning and optimizing original data, and then we further attempt to establish neural network ensemble learning models. Figure 2 presents the established ensemble learning model. Its operating principle consists of dimension reduction for small sample by PLS algorithm, getting the low-dimensional data as the input of each subclassifier and regarding the output of each subclassifier as the input of integrator. The outputs of sub-classifiers weighted learning by integrator, finally the system gets relatively optimal classification results. Figure 2 presents the basic flow chart of neural network ensemble algorithm; this study applies three subclassifiers, for example. Respectively, we use three subclassifiers to recognize the pending sample data; the cognition results of subclassifiers I are denoted by 𝐴, the cognition results of subclassifiers II are denoted by 𝐵, and the cognition results of subclassifiers III are denoted by 𝐶. Three subclassifiers are independent of each other, so are the results. Respectively, the weights of three subclassifiers are denoted by 𝑤1 , 𝑤2 , and 𝑤3 , the output of integrated system is denoted by 𝑌, and the value of 𝑌 is obtained by sum
4
Mathematical Problems in Engineering
Output 1
BP
Original data
w1
Subclassifier 1 PLS
Output 2
RBF
w2
Subclassifier 2
Low-dimensional data
Output 3
Elman
OLS integrator
w3
Subclassifier 3 . ..
Output n
NN
wn
Output result
Subclassifier n
Figure 2: Optimized classification algorithm assembled with neural network.
of weighted 𝐴, 𝐵, 𝐶, and the ensemble learning model is established as 𝑌 = 𝐴𝑤1 + 𝐵𝑤2 + 𝐶𝑤3 .
(8)
Model (8) reflects the follow discussion obviously. While 𝑤1 = 1, 𝑤2 = 0, 𝑤3 = 0, it means that only subclassifier I works, the system output results are determined by the subclassifier I. While 𝑤1 = 0, 𝑤2 = 1, 𝑤3 = 0, it means that only subclassifier II works; the system output results are determined by the subclassifier II. While 𝑤1 = 0, 𝑤2 = 0, 𝑤3 = 1, it means that only subclassifier III works, the system output results are determined by subclassifier III. The optimized integrated system, that is, find out the optimal weights of each sub-classifier, and then makes the recognition results of model (8) to achieve optimal state. 3.3. Optimized Weights. The study of neural network ensemble learning, that is, the optimized the model (8), is to determine the value of three individual neural networks’ weights 𝑤1 , 𝑤2 , 𝑤3 . We use the thought of multiple regressions to establish ternary regression equation for the output of three subclassifiers and determine the optimal estimated value of weights 𝑤1 , 𝑤2 , 𝑤3 by OLS algorithm. Suppose the recognized results of three subclassifiers are denoted by 𝑎𝑖 , 𝑏𝑖 , 𝑐𝑖 , respectively, for the 𝑖th training sample; the output of integrated system is denoted by 𝑦𝑖 and the actual value of the sample is 𝑦𝑖𝑜 , where 𝑖 = 1, 2, . . . , 𝑛. By the actual value 𝑌𝑜 of training sample, the ternary regression equation is established as follows: 𝑌 = 𝜃 + 𝛼𝐴 + 𝛽𝐵 + 𝛾𝐶 + 𝜀,
𝜀 ∼ 𝑁 (0, 𝜎2 ) .
unknown parameters 𝛼, 𝛽, 𝛾, 𝜃, it needs the minimum residual error value 𝑄:
(9)
Here, 𝛼, 𝛽, 𝛾 present the partial regression coefficient; using the method of maximum likelihood estimation to estimate
𝑛
2
𝑄 = ∑ (𝑦𝑖𝑜 − 𝑦𝑖 ) .
(10)
𝑖=1
Satisfy, namely, 𝑛
2
min 𝑄 = ∑ (𝑦𝑖0 − 𝜃 − 𝛼𝑎𝑖 − 𝛽𝑏𝑖 − 𝛾𝑐𝑖 ) .
(11)
𝑖=1
If we make 𝑄 minimum, 𝛼, 𝛽, 𝛾, 𝜃 should satisfy the following equation sets: 𝑛 𝜕𝑄 = ∑ (𝑦𝑖0 − 𝜃 − 𝛼𝑎𝑖 − 𝛽𝑏𝑖 − 𝛾𝑐𝑖 ) 𝑎𝑖 = 0, 𝜕𝛼 𝑖=1 𝑛 𝜕𝑄 = ∑ (𝑦𝑖0 − 𝜃 − 𝛼𝑎𝑖 − 𝛽𝑏𝑖 − 𝛾𝑐𝑖 ) 𝑏𝑖 = 0, 𝜕𝛽 𝑖=1 𝑛 𝜕𝑄 = ∑ (𝑦𝑖0 − 𝜃 − 𝑎𝑖 𝛼 − 𝛽𝑏𝑖 − 𝛾𝑐𝑖 ) 𝑐𝑖 = 0, 𝜕𝛾 𝑖=1
(12)
𝑛 𝜕𝑄 = ∑ (𝑦𝑖0 − 𝜃 − 𝑎𝑖 𝛼 − 𝛽𝑏𝑖 − 𝛾𝑐𝑖 ) = 0. 𝜕𝜃 𝑖=1
Set 1 [1 [ 𝑋 = [ .. [. [1
𝑎1 𝑎2 .. .
𝑏1 𝑏2 .. .
𝑐1 𝑐2 ] ] .. ] .]
𝑎𝑛 𝑏𝑛 𝑐𝑛 ]𝑛×4
,
𝜃 [𝛼] ] 𝜂=[ [𝛽] . [ 𝛾 ]4×1
(13)
Mathematical Problems in Engineering
5
The equation set (12) translates into matrix form
effectively avoid overlearning or under-fitting and get more persuasive result.
𝑋𝑇 𝑋𝜂 = 𝑋𝑇 𝑌𝑜 .
(14)
Obtain the least squares estimate of coefficient matrix 𝜂: −1
𝑇
𝑇 𝑜
𝜂 = (𝑋 𝑋) 𝑋 𝑌 .
(15)
By the coefficient matrix 𝜂, get the values of regression coefficients 𝛼, 𝛽, 𝛾, and the values of weights 𝑤1 , 𝑤2 , and 𝑤3 can be further obtained: 𝑤1 =
𝛼 , 𝛼+𝛽+𝛾
𝑤2 =
𝛽 , 𝛼+𝛽+𝛾
𝑤3 =
𝛾 . 𝛼+𝛽+𝛾 (16)
When values of 𝑤1 , 𝑤2 , 𝑤3 as formula (16), then substitute them into formula (8), will makes the output value 𝑌 is closer to the actual value 𝑌𝑜 , so the residual error 𝑄 reach the minimum. Consider 𝑛
2
𝑛
min 𝑄 = ∑ (𝑦𝑖𝑜 − 𝑦𝑖 ) = ∑ (𝑎𝑖 𝑤1 + 𝑏𝑖 𝑤2 + 𝑐𝑖 𝑤3 − 𝑦𝑖𝑜 ) . 𝑖=1
𝑖=1
(17) Formula (16) is the optimal weights of the three subclassifiers by training; model (8) achieves the most optimal and further establish ensemble optimization algorithm. 3.4. Elementary Parameters of Ensemble Optimized Algorithm. To sum up the above, using PLS for small sample dimension reduction realized the preliminary optimization of the classification system and then optimized the weights of each subclassifier by OLS. For the high dimensional and small sample problems, we may as well try to establish ensemble optimized classification algorithm by neural network based on PLS and OLS. Some parameters setting of the new algorithm are as follows. (1) Data Preprocessing. Data preprocessing eliminates the incommensurability by different data index distribution and numerical differences, which ensures the quality of the application of data from the source. Using standardized transformation obtains the data which is in accordance with the distribution of 𝑁(0, 1). The standardized transformation formula is 𝑥𝑖𝑗 =
(𝑥𝑖𝑗 − 𝑥𝑗 ) 2
√ (1/𝑛) ∑𝑛𝑖=1 (𝑥𝑖𝑗 − 𝑥𝑗 )
.
(18)
(2) Parameters of PLS. PLS feature dimension reduction is using K-fold cross validation (K-CV) method to calculate prediction residual sum of squares. This method can
(3) Parameters of BP Neural Network. The number of neurons using Gao’s empirical formula [19] to determine 𝑠 = (0.43𝑛𝑚 + 0.12𝑚2 + 2.54𝑛 + 0.77𝑚 + 0.35)
1/2
+ 0.51. (19)
In the formula, 𝑠, 𝑛, 𝑚, respectively, are on behalf of the number of neurons of hidden layer, input layer, and output layer. The neural network training uses trainlm (LM) algorithm, which is the combination of gradient descent and quasi-newton algorithm. Its advantage is give full play to the gradient descent algorithm can rapid convergence at the beginning training, and the quasi-newton algorithm can quickly produce an ideal search direction near the extremum. Connection weights and threshold learning use the Learngdm algorithm. (4) Set the Center of RBF Neural Network. Set up the center of the RBF network and choose the center of the basis function empirically; as long as the distribution of the training samples can represent the given problem, the 𝑠 centers of the uniform distribution can be chosen according to experience; the distance is 𝑑; choose the width of Gaussian basis function 𝜎=
𝑑 . √2𝑠
(20)
Select the basis function by K-clustering method; exploit the center of clustered class as the center of the basis function. (5) Parameters of Elman Neural Network. Elman neural network, which is optimized by BP neural network, the number of context layer is the same as the hidden layer. Parameter set is equal to BP neural network. 3.5. Steps of Ensemble Optimized Algorithm. The basic steps of neural network ensemble algorithm based on PLS and OLS are as follows. Step 1. Normalize the original data according to formula (18); get the characteristic variables matrix 𝑋 and dependent variable matrix 𝑌. Step 2. Respectively, extract the first pair component 𝑡1 , 𝑢1 from 𝑋, 𝑌 and make up to the maximum correlation, respectively; establish the regression equation of 𝑋 on 𝑡1 and 𝑌 on 𝑢1 . Step 3. Using residual error matrix 𝐸 and 𝐹 instead of 𝑋 and 𝑌, repetition Step 2, until the absolute value of the residual matrix elements is close to zero. Step 4. With K-CV method, by the principles of crossvalidation and residual sum of squares to determine the number of components extracted. Step 5. From the perspective of information feature compression, get the compression matrix 𝑋 and 𝑌, as new samples.
6
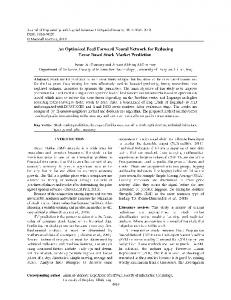
Mathematical Problems in Engineering Table 1: Comparison of every classifier’s performance for Test 1.
Network model Subclassifier I (BP NN) Subclassifier II (EBF NN) Subclassifier III (Elman NN) PLS-Elman Assembling system
Weights
Training steps
SSE
Accuracy, %
0.3207
1132
2.3167
73.33
0.2457
45
4.0261
66.67
0.4336
881
1.0595
80.00
— —
475 —
0.8676 0.3284
80.00 100
Step 6. Divide the new samples into two parts as training samples and simulation samples according to the need of the problem. Step 7. Set up three subclassifiers, respectively; classification training, the output of the three subclassifiers are 𝐴, 𝐵, 𝐶; Step 8. By the output of three subclassifiers, establish the ternary regression model (9). Step 9. Transform (9) into equations set (12) by maximum likelihood estimation. Step 10. Get the formula (13) by solving equations set (12) and using OLS theory. Step 11. By regression coefficient and formula (16), the weight of three subclassifiers can be obtained. Step 12. Get the optimal solution of integrated model (8) and terminate the algorithm.
4. Case Analysis Respectively, use three subclassifiers, PLS-Elman neural network and neural network ensemble algorithm to test the data set and contrast the test results. From the follow three aspects to evaluate the performance of each algorithm (model), which includes convergence steps, sum of squared errors and recognition accuracy rate. Convergence steps, we test 10 times, the experiment tests 10 times, we record the best once, and list in table. The sum of squared errors, the sum of squares of the difference of predicted value and actual value, is usually used to estimate the degree of closeness between recognition value and actual value. In the circumstances of the same accuracy simulation, the smaller the error sum of squares is, the higher the precision of the algorithm is. Accuracy rate, the ratio of correct recognized samples and simulation samples, which reflects the recognize accuracy of each algorithm. In order to illustrate the validity of new algorithm better, we use two data sets for testing. One data set is agricultural pests forecasting data, which is from the actual production [20], and the other data set is the ionosphere data subset of radar, which is from the UCI machine learning standard data sets [21].
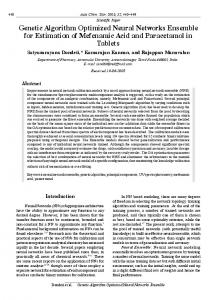
4.1. Test 1. This data comes from agricultural production, using the meteorological factor to predict the occurrence degree of wheat midge. The data set includes 60 samples from 1941 to 2000, which regards 14 feature variables (meteorological factors) as the input of neural network. The single output presents the occurrence degree of wheat midge. 4.1.1. Algorithm Performance. Select the last 30 samples to test among 15 training samples and 15 simulation samples, in accordance with the characteristics of small sample. By PLS dimension reduction, the data extracts 6 features, which means the dimensions of data from reduce 14 to 6. The simulation test results are listed in Table 1. 4.1.2. Recognize Precision of Algorithm. In order to better illustrate the classification ability of the new algorithm, we continue to do the following test; divide the selected samples into 25 training samples and 5 simulation samples. Compared with the simulation results and the actual value, the test results are listed in Table 2. 4.2. Test 2. We using another UCI data set to test the new algorithm, the radar data includes 351 samples that have 34 characteristics and each sample is used to predict the quality of the radar, which means 34 inputs and 1 output. 4.2.1. Performance of Each Algorithm. We selected the front 40 samples, among 20 training samples and 20 simulation samples. It is in accordance with the characteristics of small sample. By PLS dimension reduction, this data extracts 19 features; that is, the dimensions of data reduce from 34 to 19. The simulation test results are listed in Table 3. 4.2.2. Every Algorithm’s Recognize Precision. In order to better illustrate the classification ability of the new algorithm, we continue to do the following test and divide the selected samples into 35 training samples and 5 simulation samples. Comparing the simulation results with the actual value, the test results are listed in Table 4. 4.3. Results. According to the results of Tables 1 to 4, compared among the three subclassifiers, RBF neural network training is fastest, but the recognition accuracy is the worst; Elman neural network’s recognition accuracy is the best; BP
Mathematical Problems in Engineering
7
Table 2: Comparison of every classifier’s accuracy for Test 1. Network model Actual value Subclassifier I (BP NN) Subclassifier II (EBF NN) Subclassifier III (Elman NN) PLS-Elman Assembling system
Weights
Training steps
1996
1997
1998
1999
2000
SSE
—
—
1
2
2
2
1
—
0.3179
1036
0.5031
1.8796
2.2593
1.6927
1.1268
0.4392
0.2311
45
1.8109
2.3207
1.3358
2.2819
0.6651
1.3932
0.4510
925
1.5218
1.9076
1.8978
2.1038
0.8255
0.3325
— —
447 —
1.4129 1.2919
2.2106 1.9942
1.9073 1.8828
1.8775 2.0145
0.8691 0.9451
0.2556 0.1022
Table 3: Comparison of every classifier’s performance for Test 2. Network model Subclassifier I (BP NN) Subclassifier II (EBF NN) Subclassifier III (Elman NN) PLS-Elman Assembling system
Weights
Training steps
SSE
Accuracy, %
0.3301
976
2.0533
70.00
0.2117
45
3.1048
60.00
0.4582
907
1.8368
75.00
— —
459 —
1.4739 0.4469
80.00 100.00
Table 4: Comparison of every classifier’s accuracy for Test 2. Network model Actual value Subclassifier I (BP NN) Subclassifier II (EBF NN) Subclassifier III (Elman NN) PLS-Elman Assembling system
Weights
Training steps
1
2
3
4
5
SSE
—
—
0
1
0
1
0
—
0.3127
1205
−0.2163
1.5213
0.2027
0.6994
−0.1050
0.4610
0.2208
45
0.3255
1.4126
−0.1685
1.5012
0.2167
0.6027
0.4665
877
−0.1294
0.8927
−0.5101
1.2093
−0.0972
0.3417
— —
408 —
0.1273 −0.0561
0.5792 1.2041
−0.2216 −0.2118
1.1749 1.1143
0.1132 −0.0303
0.2858 0.1036
neural network’s training is the slowest; on the training speed and recognition accuracy, Elman is slightly better than BP neural network. Comparing PLS-Elman algorithm with traditional Elman neural network, it has better training speed and is slightly better in recognition precision. It shows that the recognition precision of classifier is not influenced; on the contrary, the operating efficiency has been improved after PLS optimization. The classification ability of ensemble optimization is the best. The data of Tables 1 and 3 prove that Comparing with other traditional neural network, the ensemble learning algorithm with the highest recognition accuracy rate and minimum error, it can suggest that the new algorithm with the highest recognition precision. The experimental results reflect that the recognition precision of ensemble algorithm is obviously higher than any subclassifier, to a certain degree, compensating for the information loss caused by data dimension reduction. Recognition
results meet the ideal requirements, which means the new algorithm is effective.
5. Conclusion and Discussion From the two groups of experimental results above, The optimized classification algorithm by PLS, algorithm, improves the training speed of subclassifier, and and the recognition accuracy is not reduced. It shows that the new algorithm reduces the inputs of neural network by PLS feature dimension reduction, which is convenient for designing the network structure and improving the operating efficiency. The recognition accuracy rate and test error of integrated system have been greatly improved, which shows that the classification precision of the ensemble algorithm has been greatly improved and higher than any subclassifier. The purpose of neural network ensemble is to improve the recognition precision of pattern classification and the point of ensemble learning is to determine the weights of each
8 sub,classifier effectively. In this paper, using OLS principle to design integrator, establish multiple regression model and further determine the weight of each subclassifier. In view of the small sample classification problem, this paper proposes an ensemble optimized neural network classification algorithm based on PLS and OLS. PLS has unique advantage to reduce dimension for small sample data, which obtains ideal low-dimensional data. By OLS algorithm, do neural network ensemble learning, to determine the weights of each subclassifier. The new algorithm has higher operating efficiency and classification precision, which shows the worthness of further popularization and application.
Conflict of Interests The authors declare that there is no conflict of interests regarding the publication of this paper.
Acknowledgments This work is supported by the National Natural Science Foundation of China (nos. 60875052, 61203014, and 61379101); Priority Academic Program Development of Jiangsu Higher Education Institutions; Major Projects in the National Science & Technology Pillar Program during the Twelfth Fiveyear Plan Period (no. 2011BAD20B06); Major Projects in Jiangsu Province Science & Technology Pillar Program Plan (Industrial) (no. BE2012136); The Specialized Research Fund for the Doctoral Program of Higher Education of China (no. 20133227110024), Ordinary University Graduate Student Research Innovation Projects of Jiangsu Province (no. KYLX14 1062).
References [1] S. F. Ding, W. K. Jia, C. Y. Su, L. W. Zhang, and Z. Z. Shi, “Neural network research progress and applications in forecast,” in Advances in Neural Networks—ISNN 2008, vol. 5264 of Lecture Notes in Computer Science, pp. 783–793, Springer, New York, NY, USA, 2008. [2] S. F. Ding, H. Zhu, W. K. Jia, and C. Y. Su, “A survey on feature extraction for pattern recognition,” Artificial Intelligence Review, vol. 37, no. 3, pp. 169–180, 2012. [3] F. X. Song, X. M. Gao, S. H. Liu, and J. Y. Yang, “Dimensionality reduction in statistical pattern recognition and low loss dimensionality reduction,” Chinese Journal of Computers, vol. 28, no. 11, pp. 1915–1922, 2005. [4] B. Garlik and M. Kˇrivan, “Identification of type daily diagrams of electric consumption based on cluster analysis of multidimensional data by neural network,” Neural Network World, vol. 23, no. 3, pp. 271–283, 2013. [5] K. R. Janes, S. X. Yang, and R. R. Hacker, “Pork farm odour modelling using multiple-component multiple-factor analysis and neural networks,” Applied Soft Computing Journal, vol. 6, no. 1, pp. 53–61, 2005. [6] J. Zhou, A. H. Guo, B. Celler, and S. Su, “Fault detection and identification spanning multiple processes by integrating PCA with neural network,” Applied Soft Computing A, vol. 14, pp. 4– 11, 2014.
Mathematical Problems in Engineering [7] H. W. Wang, Partial Least Squares Regression Method and Application, National Defense Industry Press, Beijing, China, 2000. [8] G. Z. Li, R. W. Zhao, H. N. Qu, and M. Y. You, “Model selection for partial least squares based dimension reduction,” Pattern Recognition Letters, vol. 33, no. 5, pp. 524–529, 2012. [9] J. Marques and D. Erik, “Texture analysis by a PLS based method for combined feature extraction and selection,” in Machine Learning in Medical Imaging, vol. 7009 of Lecture Notes in Computer Science, pp. 109–116, 2011. [10] S. F. Ding, W. K. Jia, X. Z. Xu, and C. Su, “Elman neural network algorithm based on PLS,” Acta Electronica Sinica, vol. 38, no. 2, pp. 71–75, 2010. [11] X. G. Tuo, M. Z. Liu, and L. Wang, “A PLS-based weighted artificial neural network approach for alpha radioactivity prediction inside contaminated pipes,” Mathematical Problems in Engineering, vol. 2014, Article ID 517605, 5 pages, 2014. [12] L. K. Hansen and P. Salamon, “Neural network ensembles,” IEEE Transactions on Pattern Analysis and Machine Intelligence, vol. 12, no. 10, pp. 993–1001, 1990. [13] D. Opitz and R. Maclin, “Popular ensemble methods: an empirical study,” Journal of Artificial Intelligence Research, vol. 11, pp. 169–198, 1999. [14] Z. H. Zhou and S. F. Chen, “Neural network ensemble,” Chinese Journal of Computers, vol. 25, no. 1, pp. 1–8, 2002. [15] N. Kourentzes, D. K. Barrow, and S. F. Crone, “Neural network ensemble operators for time series forecasting,” Expert Systems with Applications, vol. 41, no. 9, pp. 4235–4244, 2014. [16] C. X. Zhang and J. S. Zhang, “A survey of selective ensemble learning algorithms,” Chinese Journal of Computers, vol. 34, no. 8, pp. 1399–1410, 2011. [17] Z. Zhou, J. Wu, and W. Tang, “Ensembling neural networks: many could be better than all,” Artificial Intelligence, vol. 137, no. 1-2, pp. 239–263, 2002. [18] M. Alhamdoosh and D. Wang, “Fast decorrelated neural network ensembles with random weights,” Information Sciences, vol. 264, pp. 104–117, 2014. [19] D. Q. Gao, “On structures of supervised linear basis function feed forward three-layered neural networks,” Chinese Journal of Computers, vol. 21, no. 1, pp. 80–86, 1998. [20] Y. M. Zhang, The Application of Artificial Neural Network in the Forecasting of Wheat Midge, Northwest A&F University, Shaanxi Province, China, 2003. [21] http://mlearn.ics.uci.edu/databases/.
Advances in
Operations Research Hindawi Publishing Corporation http://www.hindawi.com
Volume 2014
Advances in
Decision Sciences Hindawi Publishing Corporation http://www.hindawi.com
Volume 2014
Journal of
Applied Mathematics
Algebra
Hindawi Publishing Corporation http://www.hindawi.com
Hindawi Publishing Corporation http://www.hindawi.com
Volume 2014
Journal of
Probability and Statistics Volume 2014
The Scientific World Journal Hindawi Publishing Corporation http://www.hindawi.com
Hindawi Publishing Corporation http://www.hindawi.com
Volume 2014
International Journal of
Differential Equations Hindawi Publishing Corporation http://www.hindawi.com
Volume 2014
Volume 2014
Submit your manuscripts at http://www.hindawi.com International Journal of
Advances in
Combinatorics Hindawi Publishing Corporation http://www.hindawi.com
Mathematical Physics Hindawi Publishing Corporation http://www.hindawi.com
Volume 2014
Journal of
Complex Analysis Hindawi Publishing Corporation http://www.hindawi.com
Volume 2014
International Journal of Mathematics and Mathematical Sciences
Mathematical Problems in Engineering
Journal of
Mathematics Hindawi Publishing Corporation http://www.hindawi.com
Volume 2014
Hindawi Publishing Corporation http://www.hindawi.com
Volume 2014
Volume 2014
Hindawi Publishing Corporation http://www.hindawi.com
Volume 2014
Discrete Mathematics
Journal of
Volume 2014
Hindawi Publishing Corporation http://www.hindawi.com
Discrete Dynamics in Nature and Society
Journal of
Function Spaces Hindawi Publishing Corporation http://www.hindawi.com
Abstract and Applied Analysis
Volume 2014
Hindawi Publishing Corporation http://www.hindawi.com
Volume 2014
Hindawi Publishing Corporation http://www.hindawi.com
Volume 2014
International Journal of
Journal of
Stochastic Analysis
Optimization
Hindawi Publishing Corporation http://www.hindawi.com
Hindawi Publishing Corporation http://www.hindawi.com
Volume 2014
Volume 2014