Technical Journal of Engineering and Applied Sciences Available online at www.tjeas.com ©2014 TJEAS Journal-2014-4-04/485-492 ISSN 2051-0853 ©2014 TJEAS
Texture Classification Using Optimized Neural Networks Based on Firefly Algorithm Maryam honarmand1, Navid Razmjooy2*, Bibi Somayeh Moosavi3 Department of Computer Engineering, Zahedan branch, Islamic Azad University, Zahedan, Iran Young Researchers and Elite Club, Majlesi branch, Islamic Azad University, Isfahan, Iran Electrical Engineering Department, Hatef Higher Education Institute, Zahedan, Iran Corresponding author Email:
[email protected] ABSTRACT: Texture classification is a process to category a texture image into its related class. Texture features can be extracted by different methods, using structural, statistical, model-based and transform information. In this work geometric invariant moments (GM) feature is utilized as a rotation, scale and translation invariant classifier. For omitting the image intensity of the features, thresholding technique is used before feature extraction. After that a new optimized neural classifier employed to classify the input images into their category. The classifier consists of optimizing the weights of neural network by a new algorithm, Firefly algorithm. Brodatz database are used to perform the experiment and final results show 90.18% classification rate as the system efficiency. Keywords: Texture Detection, Rotation, scale, translation and intensity invariant, Kapur's Thresholding, Artificial Neural Network, Optimization, Firefly Algorithm. 1. INTRODUCTION Image texture feature extraction is one of the difficult discussions in image processing which needs a detailed understanding of object properties and imaging optics on a treatment of some important topics in this context such as radiation, illumination, radiometry, solid state imaging, imaging optics and calibration of imaging systems (B. Jähne and H. Haubecker, 2000). The texture also describes mostly to a specific, spatially repetitive structure of surfaces formed by repeating a special element or multiple elements in different dependent spatial positions. Kundu and Chaudhuri used fuzzy geometric features for texture classification. In their procedure, first a set of 2D local membership value extreme is detected for the image; a number of features are then computed from the including perimeter, fuzzy area, height compactness, and width that form the basis of texture classification. A recognition rate of 90% correct classification was obtained (P. Kundu and B. B. Chaudhuri, 1993). Pietikänen et al. studied the efficiency of distribution based classification; the proposed feature set was a rotation-invariant texture classifier. Texture measures based on center-symmetric autocorrelation, rotational invariant binary patterns and grey-level differences used. The output was multiplied by a binomial function and the final matrix is summed into a single value that acts as a feature which called Local Binary Pattern (LBP) (M. Pietikäinen et al., 2000). Davis et al. and Davis et al. considered generalized co-occurrence matrices for texture discrimination which were based on three qualifications: spatial predicate, image feature prototype and prototype attribute. These did not demonstrate texture directly. The best nearest neighbor result of 61% correct is achieved using the contrast and entropy pair of features on edge-pixel prototype and for the linear classifier the best result of 77% correct is achieved for pixel intensity prototype (L.S. Davis et al., 1979; L.S. Davis et al, 1981). Kovalev and Petrou used quantitative estimation of relations between elementary image structures for object recognition and matching purposes (V. Kovalev and M. Petrou, 1996). Multidimensional co-occurrence matrices of order 10 on each axis are utilized for the statement and demonstration of these image structures. The features achieved are rotation and reflection invariant. Haley and Manjunath used 2D Gabor wavelet polar representation and a multi-resolution family of these wavelets to compute micro-features. These micro-features specify the frequency, spatially located amplitude and the directional behavior of texture. Further, macrofeatures are branched from the estimated selected parameters of the micro-model (G.M. Haley and B.S. Manjunath, 1999). Moreover, using a proper classifier is the other important category in texture extraction; classification is basis to many sciences. Generally, data classification means arrangement, what directs to the process of mapping instances into classes. Recently, Artificial Neural Networks (ANNs) have demonstrated good performance for modeling complicated systems (D. Guyer, X. Yang, 2000). Classification section is an important step of texture
Tech J Engin & App Sci., 4 (4): 485-492, 2014 extraction which needs a proper insulator between two different texture images. Multi-layer percepton (MLP) is the most usage neural network model in which the connection weight training is normally performed by a back propagation learning algorithm (S .S. Panda et al., 2012). 2. THE PROPOSED METHOD This study proposes an operative design for rotation, scale, translation and intensity invariant classification for the gray scale texture images. The rotation, translation and scale invariant feature extraction for given images are prove negligible by applying a geometric invariant moment (GM). GM has been successfully implemented in texture classification, aircraft identification and radar images to optical images matching (J.Flusser, 2006). The GM technique is derived from algebraic invariants implemented into the moment generating function under a rotation transformation. The set of complete moment invariants contains a set of nonlinear combinations of central moments that hang over invariant under rotation. Further using GMs, the images are also converted into binary color space to have an intensity independent and real-time system. And finally an optimized classifier by using neural networks will demonstrate the final result. For optimize the network structure, evolutionary system is implanted; some optimization algorithms used for this purpose are: Genetic Algorithm (GA) (X. Qu1 et al., 2008), Back Propagation (BP) (P.Tang and Z. Xi et al., 2008), Pruning Algorithm (R.Reed, 1993), Simulated Annealing (M.C.P.de Souto et al., 2002) and Particle Swarm Optimization (C.zhang et al., 2000). 3. BRODATZ DATABASE The Brodatz texture database is a well-known benchmark database for texture-related research (Brodatz Texture Database). The images in Brodatz database are photographs taken by Phil Brodatz, a professional photographer. It contains 112 different texture classes. The whole electronic Brodatz pictures can be achieved from the website. 4. PRE-PROCESSING There are several types of physical events make intensity changes like: surface reflectance separation which changes in value of the reflected light to the viewer, shadow, surface orientation (normal) dissimilarity, depth dissimilarity where surface orientation is stable to line of sight, etc. For solving the problem, an intensity enhancement is first applied to reduce the changes between two same textures with different intensities; after that and for eliminating the noises, kapur's threshold is employed (J.N. Kapur et al., 1985). 4.1. Intensity Enhancement Each of the input Images can have different intensities but with a same texture with the query image; the purpose of intensity normalization in this study is to solving the problem of detecting the same textures with some intensity difference between them. This provides the texture extraction to get better classification. In this work, look up table (LUT) is implemented. 8-bit is employed through segment and writing the resulting imagery back to disk. This allows bulk radiometric normalization of the image data. The LUT transformation is given as below: Output
Input Min Max Min
(1)
Min and Max present the minimal and the Maximal gray level values of the probability density for input image respectively. x 10
4
2.5 2 1.5 1 0.5 0 0
(a)
50
100
150
200
250
(b)
486
Tech J Engin & App Sci., 4 (4): 485-492, 2014 4
x 10 2 1.5 1 0.5 0
50
(c)
100
150
200
250
(d)
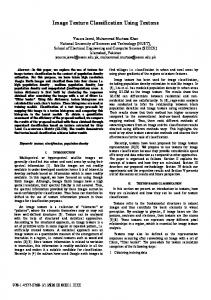
Fig.1. (a) Input Image, (b) Histogram of (a), (c) Image after Enhancement, (d) Histogram of (c) 4.2. Image Thresholding Image thresholding is a way to get rescue of the impression of noise and to develop the signal to noise ratio (Historic UC Berkeley Robotics and Intelligent Machines Lab). It is a way to keep the principal information of the image while get rescue of the negligible part which makes the system faster and more accurate. In this study Kapur's method (J.N. Kapur et al., 1985) is selected as a well-known method and its good performances. The Kapur’s method is developed by the entropy theory. It maximizes class entropies which are interpreted as a measure of class compactness and accordingly, of class separately. In this case, the probability distribution of the gray levels over the black segment of the query image is as below: p0 p1 ps , , PB PB PB
(2)
and for the white segment is: (3) where s is the threshold point; pi (i=0, 1…n-1) is the statistical probability of pixels with gray level i in the whole image and PB is the probability of pixels with gray level less than or equal to threshold s. s
PB
p,
(4)
i
i 0
In such condition, the entropy of the black and white segments of the image are: s
H B( S )
P
pi
i 0
B
n 1
HW( S )
log 2 (
1 P
i s 1
pi
B
pi ) PB
log 2 (
(5) pi ), 1 PB
(6)
The total entropy of the image is then calculated as: HT( S ) H B( S ) HW( S ) ,
(7)
H T(S )
The threshold s is chosen as the one which maximizes . After converting the input images into binary mode (thresholding), it is time to achieving good features for textures recognition. 5. Feature Extraction by geometric invariant Moment The lower order moments demonstrate some well known fundamental geometric properties of the underlying image functions. Moments are scalar values utilized to specify a function and to capture its principal features. Geometric invariant moments (GM) feature tries to extract Rotation, Scale and Translation (RST)-invariant definite features. Two-dimensional moments of a digital image f(x,y) is presented below: (8) m pq x p y q f ( x, y )
x
y
The central moments of f(x, y) are defined as: pq ( x x ) p ( y y ) q f ( x, y )
x
(9)
y
where x and y are the coordinates of the centre and are as below:
x
m10 m00
(10)
487
Tech J Engin & App Sci., 4 (4): 485-492, 2014 (11)
m01 m00 The normalized central moment of order (p+q) is presented as: y
pq
pq pq
(12)
Where: (13) pq 1 2 The set of absolute moment invariants includes a set of nonlinear compositions of central moments that stand invariant under rotation. Hu specifies the following seven functions calculated from central moments through order three, which are invariant with respect to object translation, scale and rotation (M. K. Hu, 1962): (14) 1 20 02
2 ( 20 02 ) 2 4112 3 ( 30 312 ) 2 (3 21 03 ) 2 4 ( 30 12 ) 2 ( 21 03 ) 2 5 ( 30 312 )( 30 12 )[( 30 12 ) 2 3( 21 03 ) 2 ] (3 21 03 )( 21 03 ) [3( 30 12 ) 2 ( 21 03 ) 2 ] 6 ( 20 3 02 )[( 30 12 ) 2 (12 03 ) 2 ] 411 ( 30 12 )( 21 03 ) 7 (3 21 03 )( 30 12 )[( 30 12 ) 2 3( 21 03 ) 2 ] (312 30 )( 21 03 ) [3( 30 12 ) 2 ( 21 03 ) 2 ] Tables 1-4 present some examples of features for a brick texture are presented before and after pre-processing step.
A
B
Fig.2. Description of bricks (A) and non-bricks (B) textures.
No. 1 2 3 4 5
1
6.8612 6.6725 7.1158 6.7478 6.4611
Table.1. Brick texture measurement before thresholding. 2 4 5 3 22.4194 19.7372 23.2768 25.1697 24.4209
28.0997 24.9224 29.7556 30.0754 29.2905
27.8892 24.7538 31.0963 31.8798 29.5420
56.1827 50.2430 64.2431 62.8609 59.0470
6
40.9140 36.1586 42.8861 44.4740 41.8043
7
56.3702 49.8496 61.5248 65.3290 61.2470
488
Tech J Engin & App Sci., 4 (4): 485-492, 2014
No. 1 2 3 4 5
No. 1 2 3 4 5
No. 1 2 3 4 5
1
6.6588 6.7180 7.0012 6.6223 6.8809
1
1.7420 1.7403 1.7631 1.7333 1.7736
1
1.5172 1.4711 1.0665 1.1351 1.0787
Table.2. Non-Brick texture measurement before thresholding. 2 4 5 6 3 20.3070 16.9550 20.0360 20.4636 24.5493
26.9660 23.2016 28.3132 26.0158 29.3373
27.3253 25.7704 27.8030 27.6047 29.5304
54.5623 51.5571 56.3322 54.4794 59.3432
38.1894 34.4286 37.8487 37.9312 44.0975
Table.3. Brick texture measurement after thresholding. 2 4 5 6 3 14.4814 14.4940 14.6631 14.1634 16.2986
14.8865 14.8855 15.1343 15.9287 17.8158
14.0369 14.0029 17.2541 17.7802 16.5955
29.0818 29.0215 33.9331 35.1365 34.5983
22.4007 22.3653 27.4577 25.4865 25.4111
Table.4. Non-Brick texture measurement after thresholding. 2 3 4 5 6 10.1975 5.5199 10.1083 10.4309 11.4179
11.5495 6.9362 8.6221 8.3515 11.5925
11.8736 11.9478 10.4329 8.8600 12.5335
24.6226 21.6676 20.1842 18.0224 24.9255
19.0094 17.3164 15.4988 14.4837 18.5126
7
57.8155 50.4015 56.1081 55.5595 59.3673
7
28.6851 28.6379 33.9482 34.9671 34.1037
7
23.8967 22.5769 20.7095 17.9420 25.3327
6. Artificial Neural Network (ANN) based Texture Classification The main purpose of the classification proceeding is to categorize all pixels in a digital image into one of predefined classes; with utilizing supervised classification, we identify samples of the Information classes (i.e., a specified texture) of interest in the image. Texture is a considering case which can become a classification problem. The purpose of texture classification is to specify whether a selected pixel is related to the defined texture or not. Such a problem is well-suited to artificial neural networks, which have been proven as a useful tool for pattern classification purposes where decision rules are hidden in a high complicated data and can be learnt only from samples. The artificial neural network (ANN) is inspired from the brain which attempts to simulate the function of a brain by imitating the scheme. An ANN includes several interconnected neurons. Each link between the neurons has a particular weight which impresses how much the output from the neuron will affect the input to the next neuron. Basically, each neuron has also a weight of its own called a bias term which specifies the impression of the neuron itself. The information in an ANN is reserved in its weights; therefore needs the weights to be defined. Various algorithms are exist deal with this process. Back propagation (BP) is a well-known approach is utilized for feed forward networks. In BP, the error on each of the training pairs computes for adjusting the weights to coordinate the desired output. This step is accomplished in several epochs until the total error on the training set get low enough or when the error stops to reduction. After training, the network weights get frozen and can be employed to calculate output values for new given samples. BP is a gradient descent algorithm and more times gets trapped into a local minimum; since, BPs achievement wholly dependent on initial (weight) settings. This deficiency can be eliminated by an exploration searching capability of the optimization algorithms such as FA. The image is then categorized by attempting the performance for each pixel and making a decision about which of the samples it resembles most; a sample of texture classification is shown in fig.3.
489
Tech J Engin & App Sci., 4 (4): 485-492, 2014
Fig.3. Steps in Supervised Classification. 7. Firefly Algorithm (FA) The firefly algorithm first expanded by Xin-She Yang; it is inspired by the light attenuation over the distance and fireflies’ bilateral gravitation, instead of the phenomenon of the fireflies’ light flashing (Yang, X. S. , 2008; Yang, X. S. , 2009). The schema of flashes is frequently unique for specific types. The flashing light is generated by bioluminescence process; nevertheless the valid functions of the signaling systems are still discussing. However, two essential functions of the flashes are to communicate and entice mating partners, and also to entice potential hunt. Furthermore, flashing may also serve like a preserver warning mechanism. The rhythmic flash, the amount of time form part of the signal system and the rate of flashing hold both sexes together. Females respond to a male’s unique schema of flashing in the same species, while in some species such as photuris, female fireflies can imitate the mating flashing schema of other species so as to lure and eat the male fireflies who may mistake the flashes as a potential convenient mate (Yang, X. S. , 2009). The flashing light can be formulize in such a way that it is depended to the fitness function to be optimized; so it can uses to formulate new optimization algorithms. In the firefly algorithm, there are two significant subjects: the light intensity changes and formulation of the attractiveness. In other words, it can be assumed that the attractiveness of a firefly is specified by its brightness which in turn is dependent with the encoded fitness function. As a firefly’s attractiveness is proportional to the light intensity seen by neighbor fireflies, we can now characterize the attractiveness of a firefly as below:
0 .e .r
(15)
The distance between two fireflies i and j at xi and xj , is calculated by Cartesian distance: rij
( xi x j ) 2 ( yi y j ) 2
(16)
The movement of a firefly i is attracted to another more brighter firefly j is presented as: X i X i 0 .e .r ( X j X i ) .(rand 0.5)
(17)
where 0 [0,1] , [0, ) and [0,1] . The pseudo code of firefly algorithm is shown below:
490
Tech J Engin & App Sci., 4 (4): 485-492, 2014 8. ANN weights evolution using Firefly Algorithm (NNFA) The approach used to train a neural network to texture classification is to utilize firefly algorithm to evolve the weights of the neural network. The FA algorithm is used to dominant the back propagation network (BPN) problems, like: finding optimize weights and trapping in the local minimum search space. Unlike many search algorithms, which perform a local, greedy search, firefly algorithm accomplishes a global search. The FA can be used to improve the performance of BPN in different ways. Optimized search of weights values can be formulated as follows: 1) Produce the initial population of N weight fireflies. Considering the fitness of each FANN belonging on the problem. 2) Depending on the cost and using suitable selection methods reproduce a number of children for each individual in the current generation. 3) Apply update operators to each child individual generated above and achieve the next generation. 4) Check whether the network has got the required error rate or the determined number of generations has been reached then goes to step 2. 5) End. Two layered network as example is formulated below:
H
d
w w x i
i 1
j j
j 1
b
(18)
where H is the number of neurons in the hidden layer, w is the weights of the network, b is the bias value and σ presents the activation function of each neuron (in this case considered as sigmoid). The network is trained by applying optimization the value of the weights for each node interconnection and bias terms in order to the values of the output layer neurons are as close as possible to the real outputs. The considering mean squared error of the network (MSE) is presented below: MSE
1 2
Y (k ) T (k ) g
m
k 1
j 1
(19)
2
j
j
where m is the number of output nodes, g is the number of training samples, Y j (k ) is the purposed output, and
T j (k ) is the actual output. 9. Experiments and Results To demonstrate the system performance and consider its efficiency, the experiments are conducted with a set texture images collected from the Brodatz database [16]. This image database includes major collection of textures, both in form of surface textures and natural scenes. The main objective is to enable efficient classification of texture images. We used an optimized neural network algorithm, and categorized the query images into two classes: related textures and non-related textures which related word shows the belonging to the desired texture. Using the geometric invariant moments makes the texture descriptor more efficient. Pixel-based texture classification is utilized in this paper which classifies each pixel, independently from the neighbors. The classifier consists of a vector of 7×n pixel coefficient vectors from each image which n is the number of neurons in hidden layer; the transfer function used in MLP network is sigmoid. Three performance metrics are employed for evaluating the system performance; the first metric is the correct detection rate (CDR) and is given in Equation (20). The second is the false acceptance rate (FAR) which is described in Equation (21) and is the percentage of identification moments in which false acceptance occurs. The false rejection rate (FRR) is the last metric and presents the percentage of identification moments in which false rejection occurs. The FRR are expressed in (22); table 5 illustrates the result of this process. CDR
No.of .Pixels.Correctly .Classified Total.Pixels.in.the.Test .Dataset
No.of .non skin.Pixels.Classified .as.skin.PixelsClassified Total.Pixels.in.the.Test .Dataset No.of .skin.Pixels.Classified .as.non skin.PixelsClassified FRR Total.Pixels.in.the.Test .Dataset FAR
(20 ) (21 ) (22 ) 491
Tech J Engin & App Sci., 4 (4): 485-492, 2014
Table.5. texture classification performance for Hybrid NNFA. Algorithm CDR FRR FAR Hybrid NNFA
90.18
3.57
6.25
Simple MLP
77.67
8.93
13.39
10. CONCLUSIONS In this study, a new approach was presented to classify texture images. Feature extraction step was contained a mixed method of thresholding and geometric invariant moments, in which makes the system invariant from any translation, rotation, scale and intensity. After that, artificial neural network was employed to classify the information achieved from texture feature extraction. Artificial neural network is a well-known approach in classification purposes. One of the important categories in the neural networks is the proper selection of their weight. In this paper, a new known method, firefly algorithm is utilized to optimize the value of the weights by minimizing the network error. Final results show that this proposed method leads to a good performance texture classifier. REFERENCES [1] [2] [3] [4] [5] [6] [7] [8] [9] [10] [11] [12] [13] [14] [15] [16] [17] [18] [19] [20] [21] [22]
B. Jähne and H. Haubecker, “Computer vision and applications: a guide for students and practitioners”, Academic Press, New York, 2000. P. Kundu and B. B. Chaudhuri, “ Fuzzy geometric feature-based texture classification”, Pattern Recognition Letters, vol. 14, pp. 825-832, 1993. M. Pietikäinen, T. Ojala and Z. Xu, “ Rotation-invariant texture classification using feature distributions”, Pattern Recognition, vol. 33, pp. 43-52, 2000. L.S. Davis, S.A. Johns and J.K. Aggarwal, “ Texture analysis using generalised co-occurrence matrices”, IEEE Transactions on Pattern Analysis and Machine Intelligence, vol. 1, no. 3, pp. 251-259, 1979. L.S. Davis, M. Clearman and J.K. Aggarwal, “ An empirical evaluation of generalised cooccurrence matrices”, IEEE Transactions on Pattern Analysis and Machine Intelligence, vol. 3, no. 2, pp. 214-221, 1981. V. Kovalev and M. Petrou, “ Multidimensional co-occurrence matrices for object recognition and matching”, Graphical Models and Image Processing, vol. 58, no. 3, pp. 187-197, 1996. G.M. Haley and B.S. Manjunath, “ Rotation-invariant texture classification using a complete space-frequency model”, IEEE Transactions on Image Processing, vol. 8, no. 2, pp. 255- 269, 1999. D. Guyer, X. Yang, “Use of genetic artificial neural networks and spectral imaging for defect detection on cherries”, Computers and Electronics in Agriculture, vol. 29, pp. 179-194, 2000. S .S. Panda, M.S.R.S Prasad, MNM Prasad, Ch. SKVR Naidu, “Image compression using back propagation neural network”, INTERNATIONAL JOURNAL OF ENGINEERING SCIENCE & ADVANCED TECHNOLOGY, Vol. 2(1), pp. 74–78, 2012. J.Flusser, “Moment Invariants in Image Analysis”, Proc. Of World Academy of Science, Engineering and Technology, Vol. 11, 2006. X. Qu1, J. Feng, W. Sun, “Parallel Genetic Algorithm Model Based on AHP and Neural Networks for Enterprise Comprehensive Business”, IEEE Intl. Conf. on Intelligent Information Hiding and Multimedia Signal Processing, pp.897-900, 2008. P.Tang and Z. Xi, “The Research on BP Neural Network Model Based on Guaranteed Convergence Particle Swarm Optimization”, Second Intl. Symp. on Intelligent Information Technology Application, IITA '08, Vol.2, pp.13 – 16, Dec. 2008. R.Reed, “Pruning algorithms—a survey”, IEEE Trans. Neural Networks Vol.4, pp.740–747, 1993. M.C.P.de Souto, A.Yamazaki, T.B.Ludernir, “Optimization of neural network weights and architecture for odor recognition using simulated annealing”, Proc. 2002. Intl. Joint Conf. on Neural Networks, vol.1, 2002, p.547– 552. C.zhang, H.Shao, Y.Li, “Particle swarm optimization for evolving artificial neural network”, 2000 IEEE Intl. Conf. on Systems, Man, and Cybernetics, Vol. 4, pp.2487 – 2490, Oct. 2000. Brodatz Texture Database. http://www.ux.his.no/~tranden/brodatz.html. M. K. Hu, Visual pattern recognition by moment invariants, IRE Trans. Information Theory, vol. 8, 1962, pp. 179–187. Historic UC Berkeley Robotics and Intelligent Machines Lab: http://robotics.eecs.berkeley.edu/~sastry/ee20/thdemo.html Yang X S.( 2010a) Firefly Algorithm, Stochastic Test Functions and Design Optimization, Int. J. Bio-Inspired Computation, Vol. 2, No. 2, pp.78-84. J.N. Kapur, P.K. Sahoo, and A.K.C.Wong, “A new method for graylevel picture thresholding using the entropy of the histogram,” Comput. Vis. Graph. Image Process., vol.29, pp.273–285, 1985. Yang, X. S. , “Nature-Inspired Metaheuristic Algorithms,” Luniver Press, UK, 2008. Yang, X. S., “Firefly algorithms for multimodal optimization,” in: Stochastic Algorithms: Foundations and Applications (Eds O. Watanabe and T. Zeugmann), SAGA 2009, Lecture Notes in Computer Science, 5792, Springer-Verlag, Berlin, pp. 169-178, 2009.
492