An SLA Perspective on the Router Buffer Sizing Problem Joel Sommers
Paul Barford
Colgate University
University of Wisconsin-Madison
[email protected]
[email protected]
Albert Greenberg
Walter Willinger
Microsoft Research
AT&T Labs-Research
[email protected]
[email protected]
ABSTRACT In this paper, we discuss recent work on buffer sizing in the context of an ISP’s need to offer and guarantee competitive Service Level Agreements (SLAs) to its customers. Since SLAs specify the performance that an ISP guarantees to its customers, they provide critical context for many configuration and provisioning decisions and have specific relevance to buffer sizing. We use a controlled laboratory environment to explore the tradeoffs between buffer size and a set of performance metrics over a range of traffic mixtures for three different router designs. Our empirical study reveals performance profiles that are surprisingly robust to differences in router architecture and traffic mix and suggests a design space within which buffer sizing decisions can be made in practice. We then present a preliminary approach for making buffer sizing decisions within this framework that relates directly to performance and provisioning requirements in SLAs.
1.
INTRODUCTION
Modern routers are complex systems with many features and capabilities intended to improve performance of basic packet switching tasks. At the core of any router architecture is a series of buffers that absorb bursts of packets when the aggregate demand on ingress links exceeds the capacity of an egress link. While the implementation of buffers on router line cards varies significantly from system to system, the objective in their design and configuration is to enable the system, and by extension the network, to meet specified performance targets. The problem of determining how to configure and size buffers in routers has received significant attention from the research community. A recent example is the work by Appenzeller et al. in [6] that argues that a buffer size B equal to the product of the capacity C of the link and round trip time T divided by the square root of the number N of long-lived TCP flows results in full utilization of the link and challenges the conventional wisdom that router buffers should be sized to be (at least) the bandwidth-delay product (BDP) of√a link (e.g., [19, 30]). The practical significance of the B = CT / N formula is that it suggests that buffers can be configured significantly smaller than commonly thought, to the point of eliminating the need for up to 99% of output buffers for line speeds of 10 Gb/s and above. However, routers are part of the physical infrastructures of ISPs, and are managed and configured for the purpose of guaranteeing their customers a certain level of service. These performance objectives are spelled out in detail in contracts called Service Level Agreements (SLAs) that provide critical context for many configuration and provisioning decisions. We argue in this paper that
buffer sizing and configuration decisions should explicitly account for the tussle space defined by ISP economics, router hardware design, and network performance measures [9]. For any ISP, SLAs involve trading off risk and expense. On one end of the spectrum, risk-averse ISPs tend to build expensive infrastructures to satisfy a wide range of SLA-related performance objectives with high probability despite genuine uncertainties in user behavior, traffic mix and network conditions. At the other end of the spectrum are more risk-tolerant ISPs that build less expensive network infrastructures to meet similar SLA objectives. Such providers are more likely to incur additional expenses in the form of credits to customers whose SLAs cannot consistently be met. A similar tradeoff applies to customers who have a choice of buying more or less expensive (i.e., stringent) SLAs depending on their willingness to tolerate sub-par performance in the presence of a range of network-related uncertainties. The main objective of this paper is to provide initial insights into this tussle space defined by ISP economics, router hardware design, and network performance measures. To this end, we proceed in two steps. We first revisit the original router buffer sizing problem considered in [6], examining thoroughly the assumptions and premises underlying this work. We report on a detailed empirical evaluation of the tradeoffs that result from considering different performance metrics, different traffic scenarios, different router architectures and different queuing mechanisms. We consider performance measures that include delay, loss, goodput, throughput and jitter computed for the aggregate traffic and on a per-flow basis; our traffic scenarios range from homogeneous (i.e., long-lived TCP flows) to highly heterogeneous (i.e., mixture of self-similar TCP traffic and multimedia-type UDP traffic), with a spectrum of realistic aggregate demands. In contrast to most buffer sizing studies to date (a noticeable exception is the empirical evaluation in [6]), instead of relying on idealized router models and abstract queuing simulations, we use three different popular commodity router setups (two Cisco and one Juniper) and configure them for different sizes of both drop tail and RED queues. A systematic exploration of the resulting parameter space enables us to broadly assess and compare prior methods for sizing buffers. We find that while throughput is relatively insensitive to differences in router architecture, buffer size, and traffic mix, other performance metrics such as loss and delay by and large tend to be much more sensitive. In particular, √ our findings shed light on the performance risks of the B = CT / N method and the performance gains that result from other methods that advocate somewhat larger buffers. We also observe that RED queues can provide improvements in both aggregate and per flow performance profiles in restricted buffer configurations.
Next, we present initial results from a laboratory-based case study that shows how ISP economics in the form of SLAs impact router buffer sizing decisions. In particular, by experimenting with a set of “toy” SLAs that resemble real-world SLAs, we fix a set of canonical performance requirements and illustrate how an SLA-centric perspective exposes new factors that contribute to a more informed decision making process for router buffer sizing, especially at the edge of the network. These results suggest that since networks are managed to provide a level of service specified by these guarantees (i.e., this is what network providers and customers care about the most), SLAs should play an important role in configuring router buffers. They also motivate studying new problem areas such as measuring SLA (non-)compliance, engineering for robust SLA compliance, or quantifying the risk of SLA non-compliance. For example, we find that for the same SLA, the service provider’s risk of SLA non-compliance is typically greater with fine-grained SLA compliance measurement/reporting than with coarse-grained ones. Moreover, we observe that this risk can be quantified in terms of the degree of sensitivity of SLA compliance to uncertainties in traffic mix and volume. At the same time, an analytic treatment of these problems poses formidable technical challenges and is beyond the scope of this paper.
2. 2.1
BACKGROUND AND RELATED WORK Router buffer sizing
Villamizar and Song are commonly credited for establishing the popular BDP formula for router buffer sizing [30]. (Earlier references suggesting the use of BDP for sizing Internet router buffers are by Jacobson [19].) These authors found that a buffer size of CT guarantees full utilization of the outgoing link. Morris expanded this work in a simulation study by examining the behavior of a large number of long lived TCP flows competing for a buffer sized at CT [25]. Several additional studies have considered the effects of router buffer size through queuing analysis and in simulation (see, e.g., [7, 17, 26]). The consideration of Web-like traffic workloads instead of only long-lived TCP flows has been of particular relevance in many of the more recent simulation-based studies. The recent Stanford study by Appenzeller et al. [6] has generated renewed interest in the problem of sizing router buffers. The poten√ tial implications of their B = CT / N result have motivated other researchers to scrutinize the work in [6]. In particular, Dhamdhere and Dovrolis [10, 11] highlight the fact that the traffic model and performance objective used in making buffer sizing decisions are critical. Of the two, the former is perhaps the most difficult to address due to the well known variability and complexity of packet traffic in the Internet [22]. Determining the value N specified as the number of “long lived TCP flows” (i.e., flows that exit slow start) for a given link is challenging (e.g., see [31], and so is estimating the value T for any non-trivial topology. Dhamdhere and Dovrolis also demonstrate effectively the impact that open-loop versus closed-loop TCP transfers for a given buffer size can have on performance. For related earlier work that demonstrated the importance of considering workload models that account for both the feedback regulation inherent in TCP and the heterogeneity of actual traffic see Joo et al. [20]. A series of recent papers have been concerned with additional details of sizing buffers, controlling synchronization in routers with small buffers, and fairness [13, 27, 32, 33]. The primary focus of these papers is on core routers with a high degree of statistical multiplexing, and arguments are made for the feasibility of tiny buffers (i.e., tens of packets) under certain conditions. The problems of understanding the behavior of different traffic mixes and active queue management (AQM) schemes are
identified as open issues. The question of the “right” performance metric for buffer sizing decisions has also attracted renewed attention. Appenzeller et al. focus in [6] on link utilization, which has been shown in [10, 31] to be oblivious to significant loss rates that would likely be unacceptable to network operators. Dukkipati and McKeown [12] argue that flow completion time (FCT) is the most important metric. FCT is problematic, however, because as an end-to-end performance metric it is beyond the purview of any single network within which specific buffer sizing decisions are made. Gorinsky et al. suggest a formulation that considers end-to-end goodput at the right performance target (directly related to FCT), and show that small buffers can still result in high goodput [18]. The related problem of understanding performance in the context of AQM, specifically Random Early Detection (RED) [16], has been widely examined [14]. Many of these studies have focused on RED tuning and performance evaluation, e.g., [8, 21] which consider the context of Web performance in particular. The RED study by May et al. bears some similarity to ours in its use of a commercial router and different traffic mixes [24]. It considers performance with four different buffer sizes and shows that throughput is relatively insensitive to the choice of RED parameters. Interestingly, the results also show that throughput is relatively insensitive to buffer size, but that observation is not highlighted. A distinguishing feature of our work is that we advocate a broad experimental approach. We argue that a “one size fits all” model for traffic or performance metric is unlikely to expose the impact of realistic traffic behavior or relevant performance measures on buffer sizing decisions. Therefore, the issues of traffic models and performance metrics must be broadly considered, and the empirical study described in this paper addresses them by taking a comprehensive and flexible experimental approach.
2.2
Service Level Agreements
SLAs reflect the immense importance of IP networking to today’s business enterprises and governmental institutions. A ten minute disruption of network service can cause millions of dollars of loss, or can jeopardize the functionality of essential infrastructure. SLAs spell out the technical and business relationship between network providers and customers, with positive financial consequences if the SLA is met (fees collected for services delivered) and negative ones if it is not met (e.g., penalties and damage to the business relationship). SLAs for IP networks today may span the globe and multiple autonomous systems under the control of a single network provider or a set of cooperating providers. At a technical level, SLAs provide assurances on a plethora of conditions regarding connectivity, time to handle outages or close trouble tickets, and increasingly on network performance, e.g., packet delay, loss and jitter. In this paper, we concentrate on TCP-based applications where loss and delay play a major role, but jitter is typically of lesser concern. SLAs are of particular importance for Virtual Private Networks (VPNs). VPNs can be implemented using a variety of networking technologies, but all essentially provide a clear separation of the Provider Edge (PE) and Customer Edge (CE) routers or interfaces. The customer’s CEs attach to the provider’s PEs, and the provider’s core routers offer transport between PEs. VPN services (which may be point to point or any to any among the customers CEs) thus allow customers to out-source their private network to a shared provider infrastructure. The provider manages the PE routers, core routers connecting the PEs, and (depending on the business relationship) the CE routers. The provider can support SLAs within the perimeter it controls, e.g., from CE to CE. SLAs covering performance
(e.g., loss and delay) in these networks are of increasing importance to customers who want assurances of little variation from agreed-upon performance targets. For example, large enterprise networks often have a hub and spoke topology (with a small number of hubs and a large number of spokes), where SLAs assure good performance from hubs to associated spokes, as well as between the hubs. However, performance cannot be assured during intervals when resources are oversubscribed. Thus, SLAs may allow for discarding all measurements collected when utilization exceeds a given threshold. The question is, what role does buffer sizing play in these environments? Performance across today’s large IP network cores is largely determined by two factors: (i) transmission characteristics, i.e., fiber layouts and transmission rates, and (ii) PE and CE router configuration and resource management. To design and manage for SLAs, the details of core router behavior play a relatively small role, given the capacity and redundancy built into modern network cores. Transmission characteristics are readily accounted for through understanding lower layer routing and restoration capabilities. The key to engineering to meet SLA targets then quickly reduces to understanding the per-hop performance characteristics of the routers on the edges, the CEs and the PEs, and this is where our experimental study meets SLA engineering. To meet realistic customer expectations and to engineer their networks effectively and efficiently, providers recognize that SLAs involve trading off risk and expense, and they seek to design for robust compliance to an SLA, i.e., configurations that support an SLA in the presence of genuine uncertainties—packet sizes, application mix, or traffic volatility, which even if understood in advance, may change rapidly. Providers also seek simple and universal rules for determining router buffer allocations, packet scheduling and shaping algorithms, class of service and drop priority (RED) profiles, and so forth. By universal, we mean that to the largest extent possible, the rules are identical for all routers in the same role (e.g., CE or PE), irrespective of the details of their geographic placement in the network. Of course, geographic details do matter in setting SLA targets (e.g., the delay target between Shanghai and Miami), but providers seek CE configuration rules that would be identical for those two cities. We are not aware of any detailed treatment of SLAs in the research literature, though general aspects have been discussed in e.g., [23, 28]. This is largely due to the fact that SLAs are considered proprietary by ISPs. There is some general information available online from ISPs like Sprint [4], AT&T [1], and NTT [3].
3.
TEST SETUP AND TRAFFIC SCENARIOS
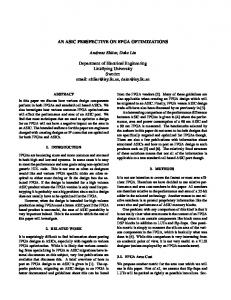
Our laboratory testbed, shown in Figure 1, was organized as a dumbbell topology. At its core was a bottleneck OC3 (155 Mb/s nominal) or Gigabit Ethernet (GE) link connected between either two Cisco GSR routers, or between a Juniper M320 and a Cisco GSR (routers A and B in the figure). Both OC3 and GE bottlenecks were used with the two-GSR configuration, and only the OC3 bottleneck was used with the M320-GSR configuration. Some detailed differences between these architectures are discussed below. In general, the primary flow of traffic was in the direction of router A to router B (left to right in the figure). Synchronized Endace DAG cards were connected via optical splitters to the links on either side of router A (either Cisco GSR or Juniper M320) for the purpose of comprehensive packet-level measurement. DAG 4.3 cards were used for GE and a DAG 3.8 card was used for OC31 . 1 The
DAG software version used was 2.5.5.
Router A Cisco 12000 (OC3, GE) or Juniper M320 (OC3)
traffic generator hosts Cisco 6500 GE
Si
Router B Cisco 12000
OC3
traffic generator hosts Cisco 6500 GE
GE
GE GE
Si
GE
NetPath delay emulation systems DAG monitor systems primary direction of traffic flows
Figure 1: Laboratory testbed. Multiple Gigabit Ethernet (GE) links connected Cisco 6500 routers to two routers separated by a bottleneck link of either OC3 or GE. Router A was either a Cisco GSR or a Juniper M320.
At each end of the topology were 14 hosts (28 hosts total) running Harpoon [29] to generate a variety of traffic scenarios. Traffic from these workstations was aggregated via two Cisco 6500 routers. These hosts ran either Linux 2.6 or FreeBSD 5.4 and were equipped with either one or two Intel Pentium 4 processors, at least 1 GB RAM, and an Intel Pro/1000 network interface cards. Each host had another network interface for management traffic, which flowed over a separate physical network (not shown in Figure 1). The TCP stacks on each host were configured with 64 KB receive windows and were configured to be SACK-capable. Linux hosts running NetPath [5] were interposed in the testbed to perform propagation delay emulation. Two round-trip time distributions were used. The first distribution (“intra-continental”) was uniformly distributed between 20 and 80 msec with a mean of 50 msec. The second distribution (“inter-continental”) was uniformly distributed between 140 and 260 msec with a mean of 200 msec. We monitored these systems during experiments and periodically reconfigured our DAG cards to run calibration tests on the NetPath systems to ensure that load was well-distributed and that they were able to handle maximum offered loads.
3.1
Router Architectures
The three router configurations used in our tests and summarized in Table 1 each have significantly different capabilities with respect to the specific line/interface card attached to the bottleneck link, the amount of memory available for packet buffers, and how particular features are implemented (e.g., in software or specialized ASICs). Even between the two Cisco GSR line cards, there are many significant differences [2]. While there are certainly other architectural differences, notably between the Cisco GSR and Juniper M320 chassis2 , our focus here is on the packet forwarding path specifically as it relates to a single (potentially) congested egress interface. Finally, there are implementation differences in how each line card above handles the division of local buffer space among multiple physical interfaces. Since our focus is on a single congested egress interface, we leave the problem of understanding the impact of multiple, simultaneously congested interfaces on a single line card for future work.
3.2
Traffic Scenarios
We used four traffic mix scenarios in our tests and a range of offered loads for each mix. The first setup consisted solely of longlived TCP flows. Offered load was varied by changing the number of flows, with the minimum number of flows set to be large enough to saturate the bottleneck link. For the second traffic setup, we used Harpoon [29] with a heavy-tailed file size distribution to cre2 The M320 imposes a hard limit on maximum buffer size. For core-class routers like the M320 and T640, a relatively low upper limit is set on the maximum buffer size. For edge routers like the M20, there are higher limits.
Table 1: Summary of router architectures used in experiments. Feature Implementation (e.g., RED)
Buffer Limit
Cisco GSR/GE
Software, general purpose processor (MIPS R5000) ASICs
Juniper M320/OC3
ASICs
65535 packets (Available memory 128 MB) 262143 packets (Available memory 512 MB) 50 millisec. hard limit
Cisco GSR/OC3
ate self-similar traffic approximating a mix of web-like and peer-topeer traffic commonly seen in today’s networks. We used average offered loads of 60%, 90%, 100%, and 110% of the bottleneck capacity. We configured 90% of the flows to have maximum segment sizes of 1448 bytes, and 10% of the flows to use 512 bytes. File transfers were initiated using a fixed population of on/off threads over the duration of an experiment which results in a closed loop system. For the third scenario, we used self-similar TCP traffic as in the previous setup at an offered load of 50%, and created UDP constant-bit rate (CBR) flows of 64 Kb/s to produce overall offered loads of 60%, 90%, 100%, and 110% of the bottleneck capacity. In addition, we experimented with a fixed ratio between web-like traffic and UDP CBR traffic of 90%/10%, respectively, and tuned overall offered loads to be 60%, 90%, 100%, and 110% of the bottleneck capacity. In the final scenario, we again used self-similar TCP traffic at an offered load of 50%, and created UDP CBR flows of 1 Mb/s to produce overall offered loads of 60%, 90%, 100%, and 110% of the bottleneck capacity. For these traffic mixes, we used two configurations of traffic direction. In the first, all data traffic flowed in the direction of router A to router B (left to right) in Figure 1. In this setup, the reverse (right to left) direction consists entirely of TCP ACK traffic. In the second configuration, data traffic flowed in both directions in equal proportions, on average, according to the desired offered load.
3.3
Buffer Configurations
The key additional dimension in our tests was to use a broad set of queue configurations. For each of the traffic mixes and offered loads, traffic directions, and round-trip time distributions, we ran experiments using both drop-tail and RED queues, over a range of sizes. We set the output queues on the bottleneck interfaces on both routers A and B identically for each experiment. No other buffer or queue in our testbed was modified from its default setting. Table 2 shows drop-tail queue lengths in numbers of packets used for three bottleneck and mean round-trip time configurations. Our settings follow a quasi-logarithmic distribution, which we created by starting with the BDP and dividing by successive factors of four and multiplying by one factor of four, with a size of 1 explicitly selected as a special case. Output buffer sizes on Juniper routers are configured in terms of µsec. To arrive at a buffer size in µsec, we multiplied the number of packets by the time taken to transmit a 1500 byte packet at OC3 or GE speed.
Table 2: Quasi-logarithmic drop-tail queue settings (in number of packets, assuming 1500 byte packets). Bandwidth-delay product appears in boldface. Bottleneck
Mean RTT
OC3 OC3 GE
50 msec 200 msec 50 msec
Queue Sizes
1
1 1 65
39 156 261
156 624 1044
624 2496 4167
2496 9984 16668
Table 3 shows the RED configurations used in our 50 msec RTT experiments. These configurations were drawn from Cisco’s de-
fault recommendations. We used the Cisco recommended setting (appropriately translated) for the OC3 Juniper tests. The small, medium and large settings indicate the three different RED queue thresholds used in these experiments. While there is a large literature on RED tuning, experiments with additional configurations were beyond the scope of our study. Table 3: RED configuration settings for 50 milllisecond round-trip time tests (in number of packets assuming 1500 byte packets). small minth maxth OC3 GE
3.4
50 333
150 1000
medium minth maxth
large minth maxth
225 1500
400 2667
675 4500
1200 8000
Testing and Analysis Protocol
For each experiment, we calculated aggregate and per-flow throughput, goodput, loss, delay, and delay variation. We processed the DAG traces taken on either side of router A to extract delay and drop information, then threw away the first and last 30 seconds of the traces before calculating aggregate and per-flow statistics. Tests using long-lived TCP sources were run for 3 minutes and all other tests were run for 10 minutes. Between each experiment, the DAG traces were moved to a separate host for offline analysis. In total, we ran approximately 1200 experiments, producing about 1 terabyte of compressed packet header data.
4.
BUFFER SIZING: SENSITIVITY PROPERTIES
Performance measures that are robust or insensitive to a wide range of networking-related uncertainties are appealing for service providers and customers alike. For service providers, they offer the hope of coping with many of the unknowns associated with traffic demands and operating the network in an economically sound manner. From the customer perspective, the existence of robust performance measures avoids the need to specify a detailed traffic profile or application mix and still obtain acceptable service from the network. In the following, we discuss the robustness of performance metrics from the customer perspective, while Section 5 looks at the same issue from a provider’s point of view. The design space within which we explore sensitivity issues related to the buffer sizing problem accounts for the different traffic scenarios and different router architectures and buffer configurations detailed in Section 3, as well as for a variety of different performance metrics. Because of limited space, we show results of only a small subset of the full set of experiments that we ran for all possible combinations of performance metric, traffic scenario, offered load, router architecture and buffer configuration. Results of experiments that we do not explicitly discuss are consistent with the results shown below. The selected plots are meant to be representative for the discussions at hand, but may differ in detail from comparable plots. Our focus is on qualitative comparisons and less on quantifying particular differences. In particular, we do not show results of experiments with bidirectional traffic and 200 millisecond average round-trip times, however they are consistent with the results shown below.
4.1
Performance Profiles: Aggregate Traffic Statistics
We first consider the case where router A can be viewed as an access router (Cisco GSR/OC3 with drop-tail queue) that is fed by traffic generated by long-lived TCP sources. In Figure 2 (top
row), we show the performance profiles that result from running this setup for 5x6=30 different buffer size/traffic load combinations. A separate curve is plotted for each source configuration. The buffer size is on the x-axis and the metric of interest is on the y-axis. The three plots show average throughput (left), delay (middle) and loss (right). To gauge the variability of these average-based performance profiles, we depict in the bottom row in Figure 2 the sets of 30 cumulative distribution functions (CDFs) associated with these profiles. For example, the plot on the left shows the 30 throughput CDFs resulting from running this setup for the 30 pairs of buffer size and traffic load combinations, with specific corner cases labelled. The CDFs in the middle (delay) and on the right (loss) are similarly constructed. A common feature of these CDFs is that with the exception of some of the corner cases, they are tightly concentrated around their means (i.e., they are almost step functions). This implies that almost identical performance profiles would result when using percentiles rather than averages. Upon closer examination, Figure 2 reveals a surprising degree of insensitivity of the throughput performance profile (top left) to a wide range of changes in buffer size and offered load. In contrast, the delay profile (top middle) shows the expected increase in delay with larger buffers, while the loss profile (top right) reflects the common wisdom that losses generally increase with higher traffic loads. To demonstrate that these features are by and large insensitive to the underlying traffic model, we show the performance profiles resulting from running the same experiments with heterogeneous self-similar TCP sources in Figure 3, and with the Cisco GSR/OC3 router replaced by a Juniper M320/OC3 system, also fed by self-similar TCP sources in Figure 4. Results for additional configurations are not shown, but are similar to those found in Figures 3 and ??. In particular, plots for the two remaining traffic scenarios and with the Juniper M320/OC3 or Cisco GSR/GE system in place for router A are not shown but have similar characteristics. Together, Figures 2–3 confirm and provide additional support for the concerns expressed in [11] regarding the exclusive reliance √ on the throughput metric in [6] when advocating the B = CT / N result. In fact, the performance profiles make it clear why throughput is not a very useful metric for buffer sizing, and that other metrics such as loss and/or delay are better for making a more informed decision. To put some of the previously proposed buffer sizing techniques into perspective, Table 4 shows buffer sizes in numbers of packets for four different proposed formulas. In particular, Table 4 shows the values corresponding to (i)√ the traditional bandwidthdelay product (BDP), (ii) the B = CT / N formula advocated in [6] (Stanford), (iii) the BSCL (buffer sizing for congested Internet links) scheme proposed by Dhamdhere et al. [10], and (iv) Morris’s flowproportional queuing method (FPQ) [25]. To derive these values, we calculated the number of flows long enough to have √ exited slow start and used this value to parameterize the CT / N and BSCL models. We used the total number of flows for the FPQ model. Additionally, we followed the methodology in [10] to empirically derive other parameters required for BSCL. In essence, the values of Table 4 provide indices into the performance profiles of Figures 2–3. From the perspective of the throughput performance profiles, all 4 methods would do well in achieving high throughput and, judging from the shape of the profiles, so would many other methods. However, some differences become clear when considering the delay and loss performance profiles. For one, considering the buffer sizes proposed by the Stanford model along with the loss performance profiles of Figures 2–3, there is a clear tradeoff between
Table 4: Comparison of buffer sizing schemes for infinite TCP source and self-similar traffic setups for OC3 bottleneck and 50 millisec. mean RTT. Values indicate buffer size in packets. Infinite source load (flows) 30 60 150 300 600 1200
BDP 624 624 624 624 624 624
Stanford 113 80 50 36 25 18
BSCL 121 59 780 2085 4695 9915
FPQ 180 360 900 1800 3600 7200
Self-similar traffic offered load 60% 90% 100% 110%
BDP 624 624 624 624
Stanford 84 68 65 60
BSCL 414 651 725 872
FPQ 2767 4140 4565 4958
choosing small buffers and risking poor performance in terms of high loss rates. Moreover, using the BSCL formula tends to yield much larger buffers which, considering the delay performance profiles, is at the cost of incurring significant delay. Likewise, the FPQ scheme has a tendency to keep losses low even when it comes at the expense of unreasonably large delays. In short, our results demonstrate that buffer sizing could benefit from a new perspective that provides critical context for configuration and provisioning decisions in general.
4.2
Performance Profiles: Per-Flow Traffic Statistics
In addition to “what” performance metric(s) to consider for the buffer sizing problem, there is also the issue of “how” the metric(s) in question should be computed. In Section 4.1, the metrics were computed based on the aggregate customer traffic. In the following, we present our empirical findings for the same three performance metrics, but now computed on a per-flow basis. Per-flow characteristics can also be considered as related to metrics such as flow completion time. Using the same set of experiments as in Section 4.1, we computed in each case throughput, delay, and loss for each individual flow encountered during the experiment, and plot in Figures 5–6 the resulting averages to obtain the throughput, delay, and loss performance profiles. Results for additional configurations are similar to those shown in Figure 6. As in Figure 2, Figure 5 also depicts the individual CDFs of the three performance metrics for the 5x6=30 pairs of buffer size and offered load combinations for the setup that deploys a Cisco GSR/OC3 router with drop-tail queue fed by long-lived TCP sources. Comparing Figures 2 and 5, we note that the variability of the per-flow based performance profiles around the depicted averages in Figure 5 is more pronounced than for the aggregate-based profiles in Figure 2. The evidence for this is provided by the CDF plots in Figure 5 (bottom row) that generally show a wide spread for the different values of a given performance metric, and typically not just for the corner cases. The practical implication is that performance profiles based on, say, 90th percentiles would deviate significantly from their average-based counterparts shown in Figure 5 (top row) and look quite different. Keeping this feature in mind when interpreting average- and per-flow based performance profiles, the main feature in Figure 5 is that the throughput performance profiles, when computed on a per-flow basis, are no longer insensitive to changes in buffer size and/or offered load. In fact, per-flow throughput tends to decrease as offered load increases, causing an increase in per-flow loss rates. Not surprisingly, we typically also observe an increase in per-flow delay as buffer size
0.30
0.10 ●
0.25 ●
0.05 ●
156
624
2496
●
●
1
0.00
0.00 39
30 sources 60 sources 150 sources 300 sources 600 sources 1200 sources
0.10 ●
0 1
loss rate
0.06
delay (seconds)
0.04
30 sources 60 sources 150 sources 300 sources 600 sources 1200 sources
0.02
●
●
0.20
0.08
●
●
50
throughput (Mb/s)
100
●
30 sources 60 sources 150 sources 300 sources 600 sources 1200 sources
0.15
150
●
●
39
156
624
2496
●
1
39
●
●
156
624
2496
1.0 0.8
0.8
0.8
●
drop tail queue length (pkts)
1.0
drop tail queue length (pkts)
1.0
drop tail queue length (pkts)
●
120
130
140
150
0.6 0.4 0.0
0.2
0.4 0.2 0.0
0.0
0.2
0.4
30 sources, 39 pkt queue
cdf
0.6 cdf
cdf
0.6
30 sources, 1 pkt queue
160
0.00
0.05
aggregate throughput (Mb/s)
0.10
0.15
0.20
0.00
0.05
delay (seconds)
0.10
0.15
0.20
aggregate loss rate
0.30 0.25 0.20
0.06
39
156
624
drop tail queue length (pkts)
2496
●
●
1
39
●
●
●
156
624
2496
drop tail queue length (pkts)
0.00
●
0 1
0.05
0.02
60% offered load 90% offered load 100% offered load 110% offered load
0.00
●
60% offered load 90% offered load 100% offered load 110% offered load
0.10
●
loss rate
●
●
0.04
●
delay (seconds)
100
● ●
60% offered load 90% offered load 100% offered load 110% offered load
50
throughput (Mb/s)
0.08
●
0.15
150
0.10
Figure 2: Aggregate results for Cisco OC3 with infinite TCP sources and drop-tail queuing discipline. Profiles of mean throughput, delay, and loss shown on top row and corresponding CDFs shown along bottom row.
●
1
39
●
●
●
156
624
2496
drop tail queue length (pkts)
Figure 3: Aggregate profiles of mean throughput, delay, and loss for Cisco OC3 with self-similar sources and drop-tail queuing discipline.
0.30
0.10
0.25 loss rate
0.10
50
60% offered load 90% offered load 100% offered load 110% offered load
0.05
0.02
●
60% offered load 90% offered load 100% offered load 110% offered load
0.20
0.08 0.04
●
●
0.06
delay (seconds)
100
throughput (Mb/s)
●
● ●
60% offered load 90% offered load 100% offered load 110% offered load
0.15
150
●
1
39
156
624
2496
●
●
●
1
39
156
624
drop tail queue length (pkts)
0.00
0
0.00
● ●
2496
1
●
●
●
39
156
624
drop tail queue length (pkts)
2496
drop tail queue length (pkts)
0.30
●
2
0.02 0.00
loss rate ●
0.05
1
●
0
30 sources 60 sources 150 sources 300 sources 600 sources 1200 sources
0.10
●
●
●
0.04
●
0.06
delay (seconds)
●
30 sources 60 sources 150 sources 300 sources 600 sources 1200 sources
0.25
0.08
●
0.20
30 sources 60 sources 150 sources 300 sources 600 sources 1200 sources
3
throughput (Mb/s)
4
●
0.15
5
0.10
Figure 4: Aggregate profiles of mean throughput, delay, and loss for Juniper OC3 with self-similar sources and drop-tail queuing discipline. As noted in Section 3.1, the Juniper M320 OC3 interface has a hard upper limit of 50 millisec. (≈624 1500 byte packets) on buffer size.
●
1
39
156
624
2496
1
●
39
156
624
2496
●
●
●
1
39
156
drop tail queue length (pkts)
●
2496
1.0 0.8
0.8
1.0 0.8
●
624
drop tail queue length (pkts)
1.0
drop tail queue length (pkts)
0.00
●
60 sources
0.4
cdf
0.6
0.6 cdf
0.0
0.2
624 pkt queue 156 pkt queue 39 pkt queue 1 pkt queue
0.0
0.0
0.2
0.2
0.4
0.4
cdf
0.6
30 sources
0
1
2
3
per−flow throughput (Mb/s)
4
5
0.00
0.05
0.10 delay (seconds)
0.15
0.20
0.0
0.1
0.2
0.3
per−flow loss rate
Figure 5: Per-flow results for Cisco OC3 with infinite TCP sources and drop-tail queuing discipline. Profiles of mean throughput, delay, and loss shown on top row and corresponding CDFs shown along bottom row.
0.4
156
624
2496
0.25 0.20 0.15
loss rate
0.06
0.05
0.02 0.00
0.0
39
60% offered load 90% offered load 100% offered load 110% offered load
0.10
●
●
●
●
1
39
drop tail queue length (pkts)
●
●
●
156
624
2496
drop tail queue length (pkts)
●
0.00
●
delay (seconds)
●
60% offered load 90% offered load 100% offered load 110% offered load
0.04
0.2
0.08
●
●
1
0.30
0.10
0.4
60% offered load 90% offered load 100% offered load 110% offered load
●
0.1
throughput (Mb/s)
0.3
●
●
1
39
●
●
●
156
624
2496
drop tail queue length (pkts)
Figure 6: Per-flow profiles of mean throughput, delay, and loss for Cisco OC3 with self-similar sources and drop-tail queuing discipline.
increases. These and other observations (not shown) for certain subclasses of flows (e.g., classified by RTT or flow size) confirm the per flow-based findings reported in [11] and complement them by using our large design space to validate these main characteristics for a wider range of possible traffic, load, router, and buffer scenarios. As mentioned in [11], gaining a better understanding of the tradeoffs between per-flow throughput, delay, and loss is an important open issue for assessing application-layer performance.
4.3
Performance Profiles: Impact of RED
In a final set of experiments that explore sensitivity aspects of the buffer sizing problem, we consider the same experimental setups as in Figure 2, but with routers that have RED queues instead of droptail queues, with the RED configuration settings given in Table 3. Figures 7 and 8 should be compared to Figures 2 and 5, respectively, and show the resulting RED-induced performance profile (with corresponding CDFs), computed for the aggregate (Figure 7) and on a per-flow basis (Figure 8). We observe that the resulting aggregate-based performance profiles exhibit in general only small variability around the plotted averages (as evidenced by the stepfunction like CDFs) and show typically a higher degree of insensitivity to differences in buffer size and/or offered traffic load for throughput and delay than their drop-tail counterparts. In addition, RED-induced performance tends to be better than drop-tail based performance when performance is measured in terms of throughput or delay and about the same in terms of loss-based performance. With respect to the per-flow based performance profiles shown in Figure 8, RED-induced performance appears overall comparable to drop-tail based performance, with the exception of delay, with RED’s delay performance profile being less sensitive and better than its drop-tail counterpart (which is to be expected, as reducing delay is one of the goals of RED). In short, without special tuning of the RED parameters and simply by relying on a set of default configuration settings, RED queues appear to result in somewhat more robust and slightly improved aggregate and perflow performance profiles when compared to their drop-tail counterparts, even in rather constrained buffer configurations. These stronger insensitivity properties of RED queues are appealing in view of SLA-related efforts to meet certain levels of performance when carrying a customer’s traffic, largely irrespective of the volume and type of traffic the customer generates.
5.
BUFFER SIZING: AN SLA PERSPECTIVE
The empirical findings discussed in Section 4 illustrate that the “black art” of buffer sizing [11] could benefit from a new perspective, especially one that provides critical context for a range of traffic engineering issues, including configuration and provisioning decisions. In this section, we seek to illuminate the extent to which providers can engineer networks for robust SLA compliance, and help to quantify the risk (for a given buffer size, a given traffic mix, and a given router configuration) of SLA non-compliance.
5.1
SLAs and Buffer Sizing: Illustrative Examples
We consider a range of “toy” SLAs that provide assurances for network performance expressed in terms of delay and loss. While the SLAs we consider resemble real-world SLAs, they are necessarily much simpler than the latter, but we use them here mainly for illustrative purposes. In particular, our SLAs cover a range of target loss rates and target delay bounds, from reasonably tight (i.e., 0.1% loss, 5 msec delay) to rather loose (i.e., 2% loss, 50 msec delay), and we set the link utilization threshold beyond which an SLA becomes non-binding to 70%. As a result, some of our traffic scenarios with high offered loads are eliminated, since they are intended to saturate the bottleneck link and, in turn, tend to make the SLA non-binding for most of the time. For a given buffer size-traffic scenario pair (X,Y ), to measure SLA compliance, we obtain the “ground truth” by relying on the passive measurements of the traffic seen on the access link that is generated by the particular traffic scenario Y and fed into router A (see Figure 1) with buffer size X. We imitate actual SLA reporting by slicing the passive trace data into smaller intervals (here we use 10 second segments; actual intervals are typically 5-10 minutes). For each interval, we check whether or not the utilization during that interval was below the 70% threshold. If so, we compute loss rate and (average) delay, and if not, we simply discard the interval. To obtain the final score, we compute the average of all (valid) 10 second scores across the entire trace and report SLA compliance/non-compliance depending on whether the final scores are within the target delay and loss rate thresholds. In Figure 9a, each of the sixteen 2D plots corresponds to a particular SLA. For a given buffer size X (x-axis) and traffic/load scenario Y (y-axis), we plot a particular letter in the corresponding (X,Y ) coordinate if
0.30
0.10
0.25 loss rate
0.06
delay (seconds)
●
large
0.00
●
0.00
0
medium
0.05
●
small
small
medium
large
small
135
140
145
150
155
●
medium
large
1.0 0.8 0.6 0.0
0.2
0.4
cdf
large thresholds
medium thresholds
small thresholds
cdf 0.4 0.2 0.0 130
●
RED queue configuration
1.0 0.8 0.6
0.8 0.6 Fn(x) 0.4 0.2 0.0
30 sources
125
●
RED queue configuration
1.0
RED queue configuration
120
30 sources 60 sources 150 sources 300 sources 600 sources 1200 sources
0.10
0.04
30 sources 60 sources 150 sources 300 sources 600 sources 1200 sources
0.02
●
50
throughput (Mb/s)
100
●
●
0.20
0.08
●
●
30 sources 60 sources 150 sources 300 sources 600 sources 1200 sources
0.15
150
●
0.00
0.05
aggregate throughput (Mb/s)
0.10 delay (seconds)
0.15
0.20
0.00
0.05
0.10
0.15
0.20
aggregate loss rate
Figure 7: Aggregate profiles of mean throughput, delay, and loss shown for Cisco OC3 with infinite TCP sources and RED queuing discipline. Profiles of mean throughput, delay, and loss shown on top row and corresponding CDFs shown along bottom row.
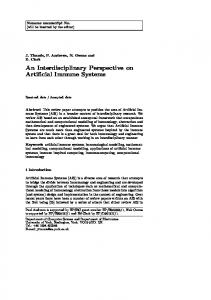
the SLA is violated in some way. A blank indicates that the SLA is met. Coarse-grained reporting of SLA compliance is preferred by service providers because it allows for temporary violations which smooth out when averaging over a large time interval (e.g., week or month). Nevertheless, Figure 9a shows that from an SLA perspective, small buffer configurations are to be avoided across the spectrum of traffic types and loads. Moreover, for a tight SLA (top left plot), the buffer size needs to be substantial, in which case delay is almost certain to cause problems. This unavoidable tradeoff is evident and to some degree quantified in Figure 9a. Complying with a tight SLA is costly for the provider because it can easily be violated by a number of realistic traffic scenarios, despite configuring buffers to be large. In turn, the provider will charge the customer to compensate for the loss of revenues due to providing large buffers and crediting the customer when the SLA is not met. On the other hand, since a loose SLA (bottom right plot) is relatively easy to satisfy for a wide range of possible traffic mixtures, even with moderate buffer sizes, they are less taxing for the provider and hence cheaper for the customer. SLAs with mixed constraints (top right or bottom left plot) have their own economics and their tradeoffs can be read from Figure 9a. To show the impact that the choice of time scale has on reporting SLA compliance, and by extension, on buffer sizing, Figure 9b shows the results of a fine-grained reporting of SLA compliance. Instead of averaging the scores of the (valid) 10 second slices across
the entire trace, we take the individual 10 second slices and associated raw scores (i.e., no averaging) and plot a particular letter in the corresponding (X,Y ) coordinate if the SLA is violated one way or another during at least one 10 second segment. A blank indicates that the SLA is met in each (valid) 10 second interval across the whole trace. The letter coding is explained in the caption of the figure. While fine-grained SLA compliance reporting is favored by customers because it relates more directly to customerperceived quality of service, Figures 9a and 9b depict one aspect of how this tension between what the provider prefers and what the customer desires materializes when making configuration and provisioning decisions. For one and the same SLA, the risk of SLA non-compliance is typically greater with fine-grained SLA compliance reporting than with coarse-grained and can be quantified to some degree by the increase in buffer size needed to achieve roughly the same degree of robustness (to uncertainties in traffic type and volume) of SLA compliance.
5.2
Quantifying Risk of SLA Non-Compliance
A common way for customers and ISPs to limit risk of noncompliance with an SLA is through a utilization threshold: the SLA becomes non-binding if the threshold is exceeded over a given monitoring interval. A lower threshold effectively shields an ISP from uncertainties in the traffic mix while a higher threshold may be used by more risk-tolerant ISPs. Thus, we consider the trade-
0.30
0.10
0.25 loss rate
30 sources 60 sources 150 sources 300 sources 600 sources 1200 sources
0.10
2
●
●
0.04
●
0.06
delay (seconds)
●
30 sources 60 sources 150 sources 300 sources 600 sources 1200 sources
0.20
0.08
●
0.15
5
30 sources 60 sources 150 sources 300 sources 600 sources 1200 sources
3
throughput (Mb/s)
4
●
small
medium
large
0.05
●
0.00
0
0.00
1
0.02
● ●
small
medium
large
small
●
medium
large
1.0 0.8 0.6
1200 sources
0.4
cdf
0.8 0.4
cdf
0.6
0.8 0.6 0.4
cdf
30 sources
●
RED queue configuration
1.0
RED queue configuration
1.0
RED queue configuration
●
0
1
2
3
4
5
0.2 0.0
0.2 0.0
0.0
0.2
30 sources, large thresholds
0.00
0.05
per−flow throughput (Mb/s)
0.10 delay (seconds)
0.15
0.20
0.0
0.1
0.2
0.3
per−flow loss rate
Figure 8: Per-flow profiles of mean throughput, delay, and loss shown for Cisco OC3 with infinite TCP sources and RED queuing discipline. Profiles of mean throughput, delay, and loss shown on top row and corresponding CDFs shown along bottom row.
offs between risk of non-compliance and expense, i.e., buffer size. While the notion of cost is complex, we make the simplifying assumption that it can be equated with buffer size for illustrative purposes. For given delay and loss rate thresholds (i.e., one of the sixteen subplots of Figure 9b), we check actual utilization levels in each interval. We consider the 90th percentile of the utilization measures over intervals where the thresholds are not exceeded as giving an indication of how much “wiggle room” remains before becoming non-compliant, i.e., we use the 90th percentile utilization as a proxy for risk. Considering now the results from Figure 9b, we make the following observations. First, there may be buffer configurations for which no realistic SLA can be supported. Indeed, the 1 packet buffer is one such case, since the loss rate threshold is routinely violated even with low overall utilization. Similarly for the 39 packet buffer case, the loss rate threshold is frequently violated. For very small buffer configurations like these, it is unlikely that an ISP will accept such risk. Referring to Table 4, we note that there are a number of buffer sizes predicted by the Stanford scheme which fall in this category. Second, for a given buffer size, as traffic becomes more heterogeneous (i.e., from self-similar traffic, to self-similar traffic with different types of UDP flows) risk increases. Not surprisingly, there is also an increase in risk as the offered load increases from 60% to 90%. For 60% load average scenarios, the level of wiggle room tends to mirror the headroom in utilization,
i.e., about 40%. For high load averages, the level of wiggle room shrinks to between 20% and 5% of the link capacity. Lastly, for a given threshold pair and traffic mix, risk related to changes in configured buffer size tends to decrease as buffer size increases. The specific level of risk depends on the thresholds and traffic scenario. Referring again to Table 4, the lowest levels of risk but highest levels of cost can generally be associated with the BSCL and FPQ buffer sizing schemes. The SLA perspective captured in Figure ?? coupled with observations above illuminates how a desire to engineer for robust SLA compliance can influence buffer sizing at the CEs and the PEs, and how buffer sizing decisions for edge routers can help to quantify the risk of SLA non-compliance. Clearly, an analytical treatment of how to engineer for robust SLA compliance and how to more generally quantify the risk of SLA non-compliance looms as a promising open problem, but looks very daunting at this point.
6.
DISCUSSION AND CONCLUSIONS
Our experiments show that all performance metrics are by and large insensitive to router architecture, and that aggregate throughput (the performance metric used in [6]) is also insensitive to buffer size and traffic mix. However, all other performance metrics show clear dependencies on buffer size, traffic mix, traffic volume and round trip time delay. By mapping four different known buffer sizing policies into the
0.4
loss threshold
loss threshold
0.1%
delay threshold 5 millisec
0.5%
L
B
B
D
L
L
B
D
D
L
L
L
L
L
L
D
L
L
L
ND
D
L
L
L
L
L
ND
L
L
L
L
L
L
L
L
L
D
L
10 millisec
L
ND
D
ND L
ND
D
D
D
web+high CBR 90%
L
ND
D
web+low CBR 90%
L
ND
L
D
ND
0.1%
delay threshold
web 90%
D
web+high CBR 60%
5 millisec
0.5%
L
B
B
B
D
L
B
L
L
L
D
D
L
L
L
L
B
D
D
L
L
L
L
B
D
D
L
L
1% B
D
L
B
D
D
L
L
B
D
D
L
L
B
D
D
L
L
B
D
L
D
D
L
D
D
D
L
ND
B
D
D
L
L
web+low CBR 60%
L
L
L
L
L
L
L
web 60%
L
L
L
L
D
web+high CBR 90%
L
L
B
B
D
L
L
D
web+low CBR 90%
L
L
L
ND
D
L
L
web 90%
L
L
L
D
L
L
L
D
web+high CBR 60%
L
L
B
D
L
L
B
D
D
L
L
L
L
L
L
L
D
L
L
L
L
L
L
L
L
L
L
L
L
L
L
L
L
D
D
L
L
D
L
L
L
D
D
L
D
L
L L
D
D
L L
L
D
D
10 millisec
ND
B
B
D
L
L
ND
D
L
L
L
L
ND
D
L
L
B
D
ND
B
B
D
L
ND
D
L
ND
L
L
L
web+low CBR 60%
L
L
L
L
L
L
L
web 60%
L
L
L
L
D
web+high CBR 90%
L
L
L
D
web+low CBR 90%
L
L
L
L
L
L
D
L
L
L
L
L
L
L
D
L
L
L
L
L
L
L
L
L
L
L
L
L
L
L
L
L
L
L L
ND
D
L
L
D
L
L
L
ND
D
L
D
L
ND
B
D
L
L
D
L
L
L
L
L
L
L
L
L
B
D
L
L
D
L
L
L
L
L
L
L
B
D
L
D
L
L
web 90%
L
L
L
L
web+high CBR 60%
L
L
L
L
L
web+low CBR 60%
L
L
L
L
L
L
web 60%
L
L
L
L
L
web+high CBR 90%
L
L
L
L
web+low CBR 90%
L
L
L
web 90%
L
L
web+high CBR 60%
L
L
D
L
L
L
L
L
L
L
L
L
L
web+high CBR 90%
D
D
web+low CBR 90%
D
D
D
web 90%
D
D
D
web+high CBR 60% web+low CBR 60% web 60%
L
L
B
D
D
web+high CBR 90%
ND
D
web+low CBR 90%
ND
D
D
D
web 90%
ND web+high CBR 60% web+low CBR 60% web 60%
L
L
D
D
web+high CBR 90%
D
web+low CBR 90%
L L
L
D
L
L
L
L
L
L
L
L
L
L
web+low CBR 60% web 60%
L
L
L
L
L
L
L
L
L
L
L
L
L
L
L
L
L
L
L
L
L
L
L
L
L
L
L
L
L
L
web+low CBR 60%
L
L
L
L
web+low CBR 60%
L
L
L
web 60%
L
L
L
L
web 60%
L
L
D
L
L
D
L
web+high CBR 60%
L
D
L
D
L
L
L
web 90%
L
L
L
L
L
L
ND
D
web+high CBR 90% web+low CBR 90% web 90%
L
web+high CBR 60%
2496
624
156
39
1
2496
624
156
39
1
2496
624
156
39
1
2496
624
156
39
1
2496
624
156
39
1
2496
624
156
39
1
2496
624
156
39
1
2496
624
156
39
drop−tail queue length
L
D
L
L
L
D
L
50 millisec
L
D
B
L
L
L
20 millisec
B
L
L
L
traffic scenario
2% B
B
L
B
D
L
D
D
L
L
1
drop−tail queue length
ND
traffic scenario
2% D
L
L
L
50 millisec
L
B
L
ND
L
L
20 millisec
1%
L
(a) Scores from 16 SLAs using coarse-grained (entire trace) SLA com-(b) Scores from 16 SLAs using fine-grained (10 second time scale) pliance reporting. Blank squares indicate SLA compliance. SLA compliance reporting. Blank squares indicate SLA compliance in every (valid) 10 second interval across the entire trace. Figure 9: 4x4 matrices of the scores from 16 SLAs (OC3, 50 millisecond round-trip time) using (a) coarse- and (b) fine-grained SLA reporting. Each SLA has a delay and loss rate threshold. Four delay thresholds (top to bottom) are used and four loss rate thresholds (left to right) are used. Each of the 16 SLAs corresponds to one of the 4x4 matrix elements, and each of them is a 6x5 block, with columns representing 5 different drop-tail queue sizes and with rows representing 6 different traffic scenarios. Scores from an individual traffic scenario/queue length combination are coded as L=loss violation, NL=near loss violation, D=delay violation, ND=near delay violation, B=both delay and loss thresholds violated, and NB=near violation of both delay and loss thresholds. “Near” means that the score is within 10% of the threshold. Blank squares indicate SLA compliance.
design space established by our experiments, we are able to compare them and assess their advantages and disadvantages. In particular, this mapping highlights the performance risks of the buffer sizes specified by [6], and shows that the other policies either result in relatively large buffers or in buffers similar to [6], depending on traffic mix. This illustrates the need for a new perspective in support of making more informed buffer sizing decisions. Thus, The second goal of our work is to put forward a novel perspective: that of the ISP and by extension the SLAs that drive their networks. That is, we argue that buffer sizing decisions must not only grapple with constraints of router design and network performance, but also ISP economics [9]. To this end, we consider a set of toy SLAs and use them to study the buffer sizing problem within the context of the economic incentives behind a marketplace for SLAs. We find that the stringency of the SLA and how SLA compliance is monitored to be contributing factors for making informed buffer configuration decisions at the network edge. For example, tying SLA-specific performance closely to traffic mix and load opens up the possibility that careful traffic engineering may enable smaller router buffers to meet certain SLAs. In this context, the observed benefits of AQM in small buffer configurations suggest that this often maligned technology may play a more prominent role in networks with a thriving SLA business model. Indeed, our results concerning performance improvements with RED warrant additional analysis. While our focus here is on qualitative analysis, statistical comparisons (e.g., tests for significance of characteristics observed in Section 4.3) also support RED as providing somewhat more robust/insensitive performance. Exploring the specific nature of these improvements, and the performance and economic tradeoffs between buffer size and management pol-
icy both empirically and analytically are subjects for future work. A curious feature that some of the plots shown in this paper have in common is worth mentioning. It concerns the somewhat unusual property (see for example Figure 2 or to a lesser extent 3) that the aggregate loss rates in the experiments with a buffer size of 1 packet are lower than the loss rates with larger buffer sizes. Note that in these experiments, data traffic is unidirectional and buffers in the data and ACK direction are symmetrically configured. We found that in the 1 packet configuration, there was a large amount of packet loss in the ACK direction. We conjecture that the ACK loss results in a more drastic reduction or even some kind of pacing of the data traffic resulting in lower overall loss. We plan to investigate this phenomenon in more detail in future work. An issue that has received attention in buffer sizing studies is synchronization among sources. For example, the lack of synchronization is critical to the central limit theorem arguments of Appenzeller et al. [6]. We examined whether there was evidence of synchronization in our experiments by using the methodology of Floyd et al. [15], i.e., by analyzing the coefficient of variation (CoV; standard deviation divided by mean) of source sending rates over a wide range of time scales. Lack of synchronization should yield low values of CoV, especially as the time scale gets large. Regardless of buffer size, we found some indication of synchronization for low numbers of sources for the long-lived TCP scenarios (e.g., 30 and 60 sources) but little evidence for other scenarios. Also, there was little correlation between buffer size and CoV for a given traffic scenario. Furthermore, CoV values were consistently lower for scenarios using RED queues versus drop-tail queues, confirming the analysis in [16]. These results suggest that focussing on the issue of synchronization with respect to buffer sizing may be of less
importance, although further analysis is needed. While our study is designed to address many aspects of router buffer sizing, several caveats remain. First is the issue of representativeness of our experimental results. We argue that the use of commercial routers and the broad consideration of traffic and performance in our study provides an improved perspective on buffer sizing. However, this does not obviate the need to refine our experimental environment to consider, e.g., more complex topologies, or for future analytical, simulation and live deployment tests which can also provide useful perspectives. Indeed, we believe that our empirical results will be useful for calibration of simulation environments and analytical models. Furthermore, many aspects of our study could be adopted by router vendors and service providers who already conduct extensive tests on live systems. An appealing aspect of [6] was a closed-form expression for specifying buffer sizes. Our results demonstrate the need for expressions that include a broader range of considerations, which is a focus for future work. Another critical issue is that traffic characteristics are known to be quite different in the core versus the edge of the Internet. Traffic in the core tends to be relatively smooth, while traffic in the edge tends to be more bursty. It is clear that the target of the Stanford study [6] is core routers that are therefore less susceptible to traffic bursts. However, a continuum exists between core and edge, so it is important to understand the conditions under which small buffers pose a risk. All of our tests were conducted with a two versions of TCP (from the FreeBSD and Linux kernels). While there are a wide variety of TCP variants in the Internet today, it is not clear that the details of differences between the dominant versions of TCP would meaningfully alter our results. However, we plan to examine this issue in future work. Perhaps more interesting is the question of how specific versions of TCP behave with small buffers. A first step in this direction was taken in [18] by running simulations that included both NewReno and Vegas. However, more tests are needed, e.g., with high-speed TCP variants. Fairness is another consideration in addressing the issue of buffer sizing. Wischik examines the issue of fairness and encourages consideration of other mechanisms (such as AQM) to address loss (and by extension fairness) in order to preserve the benefits of smaller buffers [32]. We do not address the issue of fairness directly in our study, but the ability of RED to improve performance in our experiments would lend support to that argument. There are also the arguments by Dukkipati and McKeown [12] in favor of flow completion time as the “right” metric for congestion control. This raises the following important question: Should SLAs be designed to relate to FCT, and if so, how? In conclusion, we believe that the problem of router buffer sizing in a competitive Internet remains largely unsolved. Our results serve to illuminate a wide range of known and new issues, and to highlight interesting challenges that remain.
[3] [4] [5] [6] [7]
[8] [9]
[10] [11] [12]
[13]
[14] [15] [16] [17]
[18]
[19] [20]
[21]
[22]
[23] [24]
[25] [26]
Acknowledgments
[27]
We thank Cisco Systems for their support and feedback. We also thank Juniper Networks for use of the M320 system. This work is supported in part by NSF grant numbers CNS-0347252, ANI0335234, and CCR-0325653 and by Cisco Systems. Any opinions, findings, conclusions or recommendations expressed in this material are those of the authors and do not necessarily reflect the views of the NSF, Cisco Systems or Juniper Networks.
[28]
7.
REFERENCES
[1] AT&T Managed Internet Service (MIS). http://new.serviceguide.att.com/mis.htm, 2007. [2] Cisco Systems. Cisco 12000 Series Internet Router Architecture: Packet Switching.
[29] [30] [31]
[32] [33]
http://www.cisco.com/warp/public/63/arch12000-packetsw.html, 2007. NTT Communications Global IP Network Service Level Agreement (SLA). http://www.us.ntt.net/support/sla/network/, 2007. Sprint NEXTEL service level agreements. http://www.sprint.com/ business/support/serviceLevelAgreements.jsp, 2007. S. Agarwal, J. Sommers, and P. Barford. Scalable network path emulation. In Proceedings of IEEE MASCOTS ’05, September 2005. G. Appenzeller, I. Keslassy, and N. McKeown. Sizing router buffers. In Proceedings of ACM SIGCOMM ’04, Portland, OR, August 2004. K. Avrachenkov, U. Ayesta, E. Altman, P. Nain, and C. Barakat. The Effect of Router Buffer Size on TCP Performance. In Proceedings of the LONIIS Workshop on Telecommunication Networks and Teletraffic Theory, St. Petersburg, Russia, January 2002. M. Christiansen, K. Jeffay, D. Ott, and F. Smith. Tuning RED for Web Traffic. In Proceedings of ACM SIGCOMM ’00, Stockholm, Sweeden, August 2000. D. Clark, J. Wroclawski, K. Sollins, and R. Braden. Tussle in cyberspace: defining tomorrow’s Internet. IEEE/ACM Transactions on Networking, 13(3):462–475, 2005. A. Dhamdhere, , H. Jiang, and C. Dovrolis. Buffer Sizing for Congested Internet Links. Proceedings of IEEE INFOCOM ’05, 2005. A. Dhamdhere and C. Dovrolis. Open issues in router buffer sizing. ACM SIGCOMM Computer Communications Review, 36(1):87 – 92, January 2006. N. Dukkipati and N. McKeown. Why flow-completion time is the right metric for congestion control. ACM SIGCOMM Computer Communications Review, 36(1):59 – 62, January 2006. M. Enachescu, A. Goel, N. McKeown, and T. Roughgarden. Part III: Routers with Very Small Buffers. ACM SIGCOMM Computer Communications Review, 35(3), July 2005. S. Floyd. http://www.icir.org/floyd/red.html, 2007. S. Floyd, M. Handley, J. Padhye, and J. Widmer. Equation-based congestion control for unicast applications. In Proceedings of ACM SIGCOMM ’00, 2000. S. Floyd and V. Jacobson. Random Early Detection Gateways for Congestion Avoidance. IEEE/ACM Transactions on Networking, 1(4), August 1993. M. Garetto and D. Towsley. Modeling, Simulation and Measurements of Queuing Delay under Long-tail Internet Traffic. In Proceedings of ACM SIGMETRICS ’03, San Diego, CA, June 2003. S. Gorinsky, A. Kantawala, and J. Turner. Link Buffer Sizing: A New Look at the Old Problem. In Proceedings of the IEEE Symposium on Computers and and Communications, Cartagena, Spain, June 2005. V. Jacobson. Modified TCP congestion control algorithm. End-to-end interest mailing list, April 1990. Y. Joo, V. Ribeiro, A. Feldmann, A. Gilbert, and W. Willinger. TCP/IP traffic dynamics and network performance: a lesson in workload modeling, flow control, and trace-driven simulations. ACM SIGCOMM Computer Communications Review, 31(2), April 2001. L. Le, J. Aikat, K. Jeffay, and F. Smith. The Effects of Active Queue Management on Web Traffic. In In Proceedings of ACM SIGCOMM ’03, Karlsruhe, Germany, August 2003. W. Leland, M. Taqqu, W. Willinger, and D. Wilson. On the self-similar nature of Ethernet traffic (extended version). IEEE/ACM Transactions on Networking, pages 2:1–15, 1994. J. Martin and A. Nilsson. On service level agreements for IP networks. In IEEE INFOCOM 2002, volume 2, 2002. M. May, T. Bonald, C. Diot, and J. Bolot. Reasons not to Deploy RED. In Proceedings of the Seventh IEEE International Workshop on Quality of Service, London, England, June 1999. R. Morris. TCP Behavior with Many Flows. In Proceedings of IEEE International Conference on Network Protocols, Atlanta, GA, October 1997. K. Park, G. Kim, and M. Crovella. On the Effect of Traffic Self-Similarity on Network Performance. In Proceedings of SPIE International Conference on Performance and Control of Network Systems, November 1997. G. Raina, D. Towsley, and D. Wischik. Part II: Control Theory for Buffer Sizing. ACM SIGCOMM Computer Communications Review, 35(3), July 2005. A. Shaikh and A. Greenberg. Operations and Management of IP Networks: What Researchers Should Know. Tutorial Session, ACM SIGCOMM ’05. http://www.research.att.com/~albert/ sigcomm05-greenberg-shaikh-tute.pdf, August, 2005. J. Sommers and P. Barford. Self-configuring network traffic generation. In Proceedings of ACM SIGCOMM Internet Measurement Conference ’04, 2004. C. Villamizar and C. Song. High Performance TCP in ANSNET. ACM SIGCOMM Computer Communications Review, 24(5), October 1994. G. Vu-Brugier, R. S. Stanojevic, D. J. Leith, and R. N. Shorten. A critique of recently proposed buffer-sizing strategies. ACM SIGCOMM Computer Communications Review, 37(1):43–48, 2007. D. Wischik. Fairness, QoS and Buffer Sizing. ACM SIGCOMM Computer Communications Review, 36(1), January 2006. D. Wischik and N. McKeown. Part I: Buffer Sizes for Core Routers. ACM SIGCOMM Computer Communications Review, 35(3), July 2005.