AUSTRIAN J OURNAL OF S TATISTICS Volume 34 (2005), Number 2, 163–174
“Plug-in” Statistical Forecasting of Vector Autoregressive Time Series with Missing Values Yuriy Kharin and Aliaksandr Huryn1 Belarusian State University, Minsk Abstract: The problems of statistical forecasting of vector autoregressive time series with missing values are considered. The maximum likelihood forecast is constructed and its mean square risk is evaluated for the case of known parameters. The “plug-in” forecast and statistical estimators are constructed for unknown parameters. Asymptotic properties of constructed estimators are analyzed. Results of numerical experiments are presented. Keywords: Forecasting, Vector Autoregression, Missing Values, Estimators of Parameters.
1 Introduction Missing values are a typical distortion of model assumptions in data analysis (Little and Rubin, 1987; Stockinger and Dutter, 1987). It is fairly common for a time series to have gaps for a variety of reasons (Greene, 2000; Shafer, 1997): 1) the data do not exist at the frequency we wish to observe them; 2) registration errors; 3) deletion of “outliers”. Vector autoregression (VAR) is often used in practice for statistical analysis (statistical estimation of parameters, statistical testing of hypotheses, statistical forecasting) of time series in econometrics (Pantula and Shin, 1993), biometrics (Beran et al., 1998), technometrics (Jones, 1980) and in many other applications. If the parameters of the VAR-model are a priori known, then the ML-forecast (Kharin2 and Huryn, 2003) can be used. In practice, the parameters are usually unknown, and there are three approaches to forecasting in this prior uncertainty: 1) joint maximum likelihood estimation of the future value of the considered time series and the parameters; 2) application of the EM-algorithm (Little and Rubin, 1987); 3) “plug-in” approach, consisting of two stages: a) estimation of the parameters by some admissible approach; b) calculation of the forecast putting the estimates of the parameters into the ML-forecast. The first approach is characterized by significant computational complexity; the second approach, and the first approach also, suffice from the multimodality of the objective function (because of the difficult problem of detection of the main maximum for the situation with many local ones). To avoid these difficulties we develop here the third approach. In Section 2 we define the underlying model of time series and formulate main assumptions on probabilistic characteristics of the model and on the “missing patterns”. Section 3 is devoted to the ML-forecasting under missing values for two levels of prior uncertainty: 1) parameters of the VAR model are known; 2) the parameters are unknown. In Section 4 we construct statistical estimators of the parameters B, G, “plug-in” forecasting procedure, and also analyze asymptotic properties of the constructed estimators. Section 5 contains some numerical results using real statistical data. 1
This research was partially supported by the grant INTAS 03-51-3714.
164
Austrian Journal of Statistics, Vol. 34 (2005), No. 2, 163-174
2 Mathematical Model Let the observed d-vector time series Yt be described by the VAR(1) model: Yt = BYt−1 + Ut , t ∈ Z,
(1)
where Z is the set of integers, Yt = (Yt1 , . . . , Ytd )0 ∈ Rd , B = (Bkl ) ∈ Rd×d is a matrix of unknown coefficients (all eigenvalues of the matrix B are assumed to be inside the unit circle), Ut = (Ut1 , . . . , Utd )0 ∈ Rd , {Ut } are i.i.d. random vectors, E{Ut } = 0d is the zero d-vector, E{Ut Ut0 } = Σ = Constt¯, |Σ| 6= 0, where by Consti¯1 ,...,i¯n we will denote a mathematical object (variable, vector, matrix, etc.) that is independent of the variables i1 , . . . , in , n ∈ N. There are missing values in observations {Yt }. For each vector Yt the binary vector (called “missing pattern”) Ot = (Ot1 , . . . , Otd )0 ∈ {0, 1}d is given, where Oti = {1, if Yti is observed; 0, if Yti is a missing value}. Define the discrete set M = {(t, i), t ∈ Z, i ∈ {1, . . . , d} : Oti = 1}; its elements are assumed to be lexicographically ordered in P ascending order; K = |M | is the total number of observed components; t− = min{t : di=1 Oti > 0} is the minimal time moment with observed P components, t+ = max{t : di=1 Oti > 0} is the maximal time moment with observed components. Without loss of generality assume t− = 1, t+ = T . Note, that AR(p)-model and VAR(p)-model can be transformed to VAR(1)-model increasing the number of components (Anderson, 1971). Let us introduce some assumptions on the innovation process Ut and “missing patterns” {Ot }. A1. The moments of the orders three and four for the innovation process are bounded: |E {Uti1 · · · Uti3 }| ≤ Constt¯,i¯1 ,...,i¯3 , |E {Uti1 · · · Uti4 }| ≤ Constt¯,i¯1 ,...,i¯4 , t ∈ Z, i1 , . . . , i4 ∈ {1, . . . , d}. A2. The moment of the fourth order for the innovation process is independent of the time moment and the moments of the orders from 5 to 8 for the innovation process are bounded: (4) E {Uti1 · · · Uti4 } = Σi1 ,...,i4 = Constt¯, |E {Uti1 · · · Uti5 }| ≤ Constt¯,i¯1 ,...,i¯5 , |E {Uti1 · · · Uti6 }| ≤ Constt¯,i¯1 ,...,i¯6 , |E {Uti1 · · · Uti7 }| ≤ Constt¯,i¯1 ,...,i¯7 , |E {Uti1 · · · Uti8 }| ≤ Constt¯,i¯1 ,...,i¯8 , t ∈ Z, i1 , . . . , i8 ∈ {1, . . . , d}. A3. Ut is a Gaussian random vector: L {Ut } = Nd (0d , Σ). A4. The “missing patterns” {Ot } satisfy the asymptotics at T → ∞ (i, j ∈ {1, . . . , d}): T
−1
T X
Oti Otj →
(0) νij
−1
∈ (0, 1], (T − 1)
t=1
T −1 X
(1)
Ot+1,i Otj → νij ∈ (0, 1],
(2)
t=1
(0)
νij is the limit frequency for the pair of components (i, j) observed at the same time (1) moment, νij is the limit frequency for the pair of components (i, j) observed at the neighbor time moments. A5. The “missing patterns” {Ot } satisfy the asymptotics at T → ∞: −1
(T − |τ | − 1)
T −1 X t,t0 =1
(2)
Oti Otj Ot0 i0 Ot0 j 0 δt−t0 ,τ → νi,j,i0 ,j 0 (τ ) ∈ [0, 1],
165
Yu. Kharin and A. Huryn
(2)
νi,j,i0 ,j 0 (τ ) is the limit frequency for the pair of components (i, j) observed together with (2)
(0)
the pair (i0 , j 0 ) at the delay τ , νi,j,i,j (0) ≡ νij , δi,j is the Kronecker symbol; (T − |τ | − 1)−1
T −1 X
(3)
Oti Otj Ot0 +1,i0 Ot0 j 0 δt−t0 ,τ → νi,j,i0 ,j 0 (τ ) ∈ [0, 1],
t,t0 =1 (3)
νi,j,i0 ,j 0 (τ ) is the limit frequency for the pair of components (i, j) observed together with the components (i0 , j 0 ) observed at the delay τ − 1 and τ ; −1
(T − |τ | − 1)
T −1 X
(4)
Ot+1,i Otj Ot0 +1,i0 Ot0 j 0 δt−t0 ,τ → νi,j,i0 ,j 0 (τ ) ∈ [0, 1],
t,t0 =1 (4)
νi,j,i0 ,j 0 (τ ) is the limit frequency for the pair of components (i, j) observed at the neighbor time moments and the pair (i0 , j 0 ) observed at the neighbor time moments at the delay τ , (4) (1) νi,j,i,j (0) ≡ νij , where τ ∈ Z, i, j, i0 , j 0 ∈ {1, . . . , d}. Let YT +τ ∈ Rd be a “future vector” to be forecasted for τ ≥ 1, YˆT +τ = YˆT +τ (X) : RK → Rd be a forecasting statistic (procedure). Introduce the matrix risk R ∈ Rd×d and the (scalar) risk r of forecasting: ½³ ´³ ´0 ¾ ˆ ˆ YT +τ − YT +τ YT +τ − YT +τ R=E , r = tr(R) ≥ 0. It is known (Greene, 2000), that for the case of complete ¡P ¢ observations and known paramτ −1 ∗ i 0 i eters B, Σ the minimal risk r0 = tr > 0 is attained for the forecast i=0 B Σ(B ) (Greene, 2000): Y¯T +τ = B τ YT .
3
ML-Forecasting Under Missing Values
Define a bijection M ↔ {1, . . . , K} : k = χ(t, i) and the inverse function (t, i) = χ(k). ¯ Compose the K-vector of all observed components: X = (X1 , . . . , XK )0 ∈ RK , Xk = Yχ(k) ¯ , k ∈ {1, . . . , K}. Note, that if Oti = 1, t ∈ {1, . . . , T }, i ∈ {1, . . . , d}, then the process Yt is observed on [1, T ] without any missing value, K = T d, X = (Y10 , . . . , YT0 )0 , χ(t, i) = i + (t − 1)d; χ(k) ¯ = ([(k − 1)/d] + 1, (k − 1) mod d + 1), k ∈ {1, . . . , K}. Denote the matrices: F = (Fij ) = cov{X, X} ∈ RK×K , H = (Hij ) = cov{X, YT +τ } ∈ RK×d , G = (Gij ) = cov{YT +τ , YT +τ } ∈ Rd×d , G1 = cov{YT +τ +1 , YT +τ } ∈ Rd×d , A = H 0 F −1 ∈ Rd×K . Note, that according to Anderson (1971) G = P0∞= Ai 0 (B,0 Σ) i i=0 B Σ(B ) , G1 = BG. Lemma 1 Let the model (1) take place. The following expressions for F , H hold: ¡ ¢ Fij = Fji = B χ¯1 (i)−χ¯1 (j) G χ¯2 (i),χ¯2 (j) , i, j ∈ {1, . . . , K}, i ≥ j; ¡ ¢ Hij = B (T +τ )−χ¯1 (i) G j,χ¯2 (i) , i ∈ {1, . . . , K}, j ∈ {1, . . . , d}.
(3)
166
Austrian Journal of Statistics, Vol. 34 (2005), No. 2, 163-174
Proof. Using the expression for the covariance matrix for the VAR(1) model (Anderson, 1971): Yj } =¡ B i−j G, i ≥ j, we © cov{Yi , ª ¢ find covariances: ¡ χ¯ (i)−Fχ¯ij(j)= ¢cov {Xi , Xj } = 1 cov Yχ(i) , Y = cov{Y , Y } = B 1 G χ¯2 (i),χ¯2 (j) . In the ¯ χ(j) ¯ χ ¯1 (i) χ ¯1 (j) χ ¯2 (i),χ ¯2 (j) same way we find H. ¤ Theorem 1 Let the model (1) and the assumption A3 take place. If the true values B, Σ are known, and |F | 6= 0, then the ML-forecasting statistic and its risk functionals are YˆT +τ,ML = E{YT +τ |X} = A0 X,
(4)
RML = G − H 0 F −1 H º 0, rML = tr(G) − tr(F −1 HH 0 ).
(5)
Proof. Denote Y+ = (X 0 , YT0 +τ )0 ∈ RK+d . By Theorem 1 assumptions, the vector Y+ has the Gaussian distribution. By the Anderson theorem (Anderson, 1971), the likelihood function(w.r.t YT +τ ) is ¡ ¢ l (YT +τ ; B, Σ) = nK (X|0K , F ) nd YT +τ |H 0 F −1 X, G − H 0 F −1 H , (6) where nK (X|µ, Σ) means the K-dimensional Gaussian p.d.f. with the parameters µ, Σ. The ML-forecast is the solution of the extremum problem: l (YT +τ ; B, Σ) → maxYT +τ . Since the first multiplier in (6) does not depend on YT +τ , we come to the unique solution (4): YˆT +τ,ML = H 0 F −1 X = A0 X. n³ Using the total mathematical expectationoformula and ´ ˆ ˆ (4), we find the risk (5): RML = E YT +τ,ML − YT +τ (YT +τ,ML − YT +τ )0 = © © ªª E E (E{YT +τ |X} − YT +τ ) (E{YT +τ |X} − YT +τ )0 |X = E {cov {YT +τ , YT +τ |X}} = E {G − H 0 F −1 H} = G − H 0 F −1 H. ¤ Theorem 2 Let the model (1) and the assumption A3 take place. If B, Σ are unknown, |F | 6= 0, then the ML-forecast of YT +τ has the “plug-in” form: ˜ Σ)X, ˜ Y˜T +τ,ML = A0 (B,
(7)
˜ Σ ˜ of the model parameters are the solution of the minimizawhere the ML-estimators B, 0 −1 tion problem: l1 (B, Σ) = X F X + ln |F | + ln |G − H 0 F −1 H| → minB,Σ . Proof. According to the equation (6), the joint ML-estimators of YT +τ , B, Σ are the solution of the extremum problem: l (YT +τ ; B, Σ) → maxYT +τ ,B,Σ . From Theorem 1 we ˜ Σ ˜ of the model parameters are the solution of the get (7), where the ML-estimators B, problem: nK (X|0K , F ) nd (H 0 F −1 X|H 0 F −1 X, G − H 0 F −1 H) → maxB,Σ . Taking the logarithm, we come to the statement. ¤
4 “Plug-in” Forecasting in the Case of Unknown B, Σ Because of computational complexity of the minimization problem in (7), we propose to ˆ Σ) ˆ in (7). construct more suitable estimator for A0 instead of A0 (B,
167
Yu. Kharin and A. Huryn
Let us definenthe minimal admissible observation time the observed time o series PT Pfor T −1 {Yt }: T0 = min T ∈ N : mini,j t=1 Oti Otj > 0, mini,j t=1 Ot+1,i Otj > 0 , and maˆ Gˆ1 ∈ Rd×d for T ≥ T0 : trices G, ˆ ij = G
PT
t=1 Yti Ytj Oti Otj , PT t=1 Oti Otj
³
ˆ1 G
PT −1
´ ij
=
Yt+1,i Ytj Ot+1,i Otj , i, j ∈ {1, . . . , d}. PT −1 t=1 Ot+1,i Otj
t=1
(8)
It follows from the underlying model (1), that |G| 6= 0 and the matrices B, G, G1 satisfy the matrix equation G1 = BG, consequently B = G1 G−1 . Following the “plug-in” ˆ 6= 0): principle and using the previous equation let us construct a matrix statistic (if |G| ˆ=G ˆ 1 (G) ˆ −1 , B
(9)
ˆ G ˆ (instead of B, G) into (3) we get the matrices Fˆ , H, ˆ the Putting then the statistics B, ˆ statistic (if |F | 6= 0) ˆ 0 Fˆ −1 , Aˆ0 = H and the “plug-in” forecasting procedure: YˆT +τ,plug−in = Aˆ0 X. According to Lemma 1, theorems 1 and 2, the performance of the “plug-in” forecastˆ G, ˆ Gˆ1 . ing procedure is determined by the performance of the underlying estimators B, Let us analyze asymptotic properties (T → ∞) of the proposed estimators (8), (9). Denote functions (t, t0 , τ ∈ Z, T ∈ N, i, j, i0 , j 0 ∈ {1, . . . , d}) generated by the “missing patterns”: Ã T !−1 T −1 T X X X (1) cτ,i,j,i0 ,j 0 (T ) = T Oti Otj Ot0 i0 Ot0 j 0 δt−t0 ,τ Oti Otj Oti0 Otj 0 , t,t0 =1
(2)
cτ,i,j,i0 ,j 0 (T ) = T (3)
cτ,i,j,i0 ,j 0 (T ) = T
T −1 X
Oti Otj Ot0 +1,i0 Ot0 j 0 δt−t0 ,τ
(4)
t=1
à T X
T −1 X
t,t0 =1
t=1
T −1 X
ÃT −1 X
Ot+1,i Otj Ot0 i0 Ot0 j 0 δt−t0 ,τ
t,t0 =1
cτ,i,j,i0 ,j 0 (T ) = T
t=1
T −1 X t,t0 =1
Ot+1,i Otj Ot0 +1,i0 Ot0 j 0 δt−t0 ,τ
Oti Otj
!−1 Ot+1,i0 Otj 0
t=1
Ot+1,i Otj
T X
t=1
t=1
ÃT −1 X
T −1 X
t=1
,
Ot+1,i Otj
!−1 Oti0 Otj 0
, !−1
Ot+1,i0 Otj 0
t=1
³ ´−1 ³ ´−1 (1) (2) (0) (0) (2) (3) (0) (1) Cτ,i,j,i0 ,j 0 = νi,j,i0 ,j 0 (τ ) νij νi0 j 0 , Cτ,i,j,i0 ,j 0 = νi,j,i0 ,j 0 (τ ) νij νi0 j 0 , ´−1 ³ ´−1 ³ (4) (4) (1) (1) (3) (3) (0) (1) , Cτ,i,j,i0 ,j 0 = νi,j,i0 ,j 0 (τ ) νij νi0 j 0 , Cτ,i,j,i0 ,j 0 = νi0 ,j 0 ,i,j (−τ ) νi0 j 0 νij and covariances: (1)
gt−t0 ,i,j,i0 ,j 0 = E {(Yti Ytj − E {Yti Ytj }) (Yt0 i0 Yt0 j 0 − E {Yt0 i0 Yt0 j 0 })} ,
,
168
Austrian Journal of Statistics, Vol. 34 (2005), No. 2, 163-174
(2)
gt−t0 ,i,j,i0 ,j 0 = E {(Yti Ytj − E {Yti Ytj }) (Yt0 +1,i0 Yt0 j 0 − E {Yt0 +1,i0 Yt0 j 0 })} , (3)
gt−t0 ,i,j,i0 ,j 0 = E {(Yt+1,i Ytj − E {Yt+1,i Ytj }) (Yt0 i0 Yt0 j 0 − E {Yt0 i0 Yt0 j 0 })} , (4)
gt−t0 ,i,j,i0 ,j 0 = E {(Yt+1,i Ytj − E {Yt+1,i Ytj }) (Yt0 +1,i0 Yt0 j 0 − E {Yt0 +1,i0 Yt0 j 0 })} . The following lemma is straightforward and the proof is omitted. Lemma 2 Let the model (1) and the assumptions A4, A5 take place. Then at T → ∞ the following asymptotic behavior of the “missing patterns” {Ot } takes place: T −1 X 1 (3) Ot+1,i Otj Ot0 i0 Ot0 j 0 δt−t0 ,τ → νi0 ,j 0 ,i,j (−τ ) ∈ [0, 1]; T − |τ | − 1 t,t0 =1 (k)
(k)
cτ,i,j,i0 ,j 0 (T ) −→ Cτ,i,j,i0 ,j 0 , k ∈ {1, 2, 3, 4}; (k)
(k)
(3)
(2)
Cτ,i0 ,j 0 ,i,j = C−τ,i,j,i0 ,j 0 , k ∈ {1, 4}, Cτ,i0 ,j 0 ,i,j = C−τ,i,j,i0 ,j 0 , τ ∈ Z, i, j, i0 , j 0 ∈ {1, . . . , d}. Lemma 3 Let the model (1) and the assumption A2 take place. Then the covariance E {(Yt+u,i Ytj − E {Yt+u,i Ytj }) (Yt0 +u0 ,i0 Yt0 j 0 − E {Yt0 +u0 ,i0 Yt0 j 0 })} depends functionally on the time moments t, t0 through their difference t − t0 only, 0
|E {(Yt+u,i Ytj − E {Yt+u,i Ytj }) (Yt0 +u0 ,i0 Yt0 j 0 − E {Yt0 +u0 ,i0 Yt0 j 0 })}| ≤ λ|t−t | Constt¯,t¯0 , where t, t0 , u, u0 ∈ Z, λ ∈ [0, 1), and the relations for covariances take place: (k)
(k)
(3)
(2)
gτ,i0 ,j 0 ,i,j = g−τ,i,j,i0 ,j 0 , k ∈ {1, 4}, gτ,i0 ,j 0 ,i,j = g−τ,i,j,i0 ,j 0 , τ ∈ Z, i, j, i0 , j 0 ∈ {1, . . . , d}. Proof. The first statement of this lemma follows from the invariance property (w.r.t. time t) of the moments Σ, Σ(4) . The second statement – from the inequality for powers of ¯ ¯ ¯ τ ¯ τ the matrix B (Anderson, 1971): ¯(B )ij ¯ ≤ λ Constτ¯,¯i,¯j , where λ ∈ [0, 1), τ ∈ N, i, j ∈ {1, . . . , d}. By replacement of indices one can easy come to the third statement of lemma. ¤ Theorem 3 Let the model (1) and the assumptions A1, A4 take place. Then the estimators (8), (9) are consistent at T → ∞: ˆ −→P B, G ˆ −→P G, Gˆ1 −→P G1 . B Proof. The statement follows from the expression (9) for matrix B and the properties of estimators for covariances (8). ¤ ˆ are based on the following central limit Next results on asymptotic normality of B theorem for mT -dependent random vectors (Shergin, 1976; Maejima, 1978).
169
Yu. Kharin and A. Huryn
n o (T ) Theorem 4 Let Zt , t = 1, 2, . . . , kT be a sequence of mT -dependent random varin o PkT (T ) (T ) ables with E Zt = 0 for all t and T , kT → ∞ at T → ∞, ST = t=1 Zt , ½³ ¾ ´ 2 (T ) ¯ 2 = PkT E DT2 = E {ST2 }, D Zt , FT (x) = P (ST ≤ DT x) be the distribuT t=1 tion function of ST , 4T (x) = |FT (x) − Φ(x)|, Φ(x) is the standard normal distribution, 3δ+2
−2 δ γδ = 2(δδ(δ+2) . Suppose that 2 +4δ+2) , Const is a constant, 0 < δ ≤ 1, εT = DT mT ¾ ½¯ ¯2+δ ¯ (T ) ¯ < ∞ and the following assumptions are satisfied: 1) DT2 −→ ∞, 2) E ¯Zt ¯ ½¯ ¯ ¾ PkT ¯ (T ) ¯2+δ 7 2 2 ¯ = O (DT2 ), 4) kT = O (DT2 ), 5) DT8 m−6 DT = O (DT ), 3) t=1 E ¯Zt ¯ T ≤ kT
for large T, 6) εT −→ 0. Then 4T (x) ≤
Const εγδ (1+|x|)2+δ T
for all x.
Let a sequence of random vectors ξT = (ξT i ) ∈ Rd converges in distribution to random vector ξ = (ξi ) ∈ Rd at T → ∞. If the covariances cov {ξi , ξj } < ∞ exist ∀i, j ∈ {1, . . . , d}, then let us call these covariances as the asymptotic covariances of the sequence ξT , and let us denote them in the following form: n o acov (ξT )i , (ξT )j = cov {ξi , ξj } , i, j ∈ {1, . . . , d}. In the same manner define the asymptotic variance and asymptotic mathematical expectation of the sequence ξT : aE {ξT } = E {ξ}, aD {ξT i } = D {ξi }, i ∈ {1, . . . , d}. Lemma 4 Let the model (1) and the assumptions A2,³ A4, A5´take place. Then at ´ T →∞ √ √ ³ ˆ ˆ the vector, composed of elements of matrices T G − G , T G1 − G1 , has the asymptotically normal distribution with zero mean and asymptotic covariances: ½ ´ √ ³ ´ √ ³ ˆ−G , T G ˆ−G acov T G ij
¾
i0 j 0
½ ´ √ ³ ´ √ ³ ˆ 1 − G1 , T G ˆ 1 − G1 T G acov ij
½ ´ √ ³ ´ √ ³ ˆ−G , T G ˆ 1 − G1 acov T G ij
0
∞ X
=
(1)
(1)
gτ,i,j,i0 ,j 0 Cτ,i,j,i0 ,j 0 ,
(10)
τ =−∞
¾ i0 j 0
=
(4)
(4)
gτ,i,j,i0 ,j 0 Cτ,i,j,i0 ,j 0 ,
τ =−∞
¾
i0 j 0
∞ X
=
∞ X
(2)
(2)
gτ,i,j,i0 ,j 0 Cτ,i,j,i0 ,j 0 ,
τ =−∞
0
where i, j, i , j ∈ {1, . . . , d}. Proof. According to the theorem of Shiryaev (1995), a vector has an asymptotically normal distribution if and only if any linear combination of its elements has an asymptotically normal distribution. Define the linear combination with arbitrary coefficients αij , βij ∈ R: d µ ³ ´ ³ ´ ¶ √ X ˆ ˆ T αij G − G + βij G1 − G1 = η1 (T ) + η2 (T ) + η3 (T ), i,j=1
ij
ij
170
Austrian Journal of Statistics, Vol. 34 (2005), No. 2, 163-174
where η1 (T ) =
√
T −1 X
T
d X
³ αij
−E PT t1 =1
t=1 i,j=1
³ βij
n
(m ) (m ) Yti T Ytj T
(m ) (m ) Yti T Ytj T
o´ Oti Otj
Ot1 i Ot1 j
+
n o´ (mT ) (mT ) − E Yt+1,i Ytj Ot+1,i Otj , PT −1 O O t1 =1 t1 +1,i t1 j
(m ) (m ) Yt+1,iT Ytj T
n o´ ³ (m ) (m ) (m ) (m ) T −1 X d Oti Otj αij Yti T Utj T − E Yti T Utj T √ X η2 (T ) = T + PT O O t i t j 1 1 t =1 t=1 i,j=1 1 n o´ ³ (m ) (m ) (m ) (m ) αij Uti T Ytj T − E Uti T Ytj T Oti Otj + PT t1 =1 Ot1 i Ot1 j ³ n o´ (m ) (m ) (m ) (m ) αij Uti T Utj T − E Uti T Utj T Oti Otj + PT t1 =1 Ot1 i Ot1 j ³ n o´ (m ) (m ) (m ) (m ) βij Yt+1,iT Utj T − E Yt+1,iT Utj T Ot+1,i Otj + PT −1 O O t +1,i t j 1 1 t1 =1 ³ n o´ (mT ) (mT ) (mT ) (mT ) βij Ut+1,i Ytj − E Ut+1,i Ytj Ot+1,i Otj + PT −1 t1 =1 Ot1 +1,i Ot1 j ³ n o´ (mT ) (mT ) (mT ) (mT ) βij Ut+1,i Utj − E Ut+1,i Utj Ot+1,i Otj , PT −1 O O t +1,i t j 1 1 t1 =1 d √ X αij (YT i YT j − E {YT i YT j }) OT i OT j , η3 (T ) = T PT t=1 Oti Otj i,j=1
P P T s (mT ) (m ) (m ) (m ) s = ∞ Yt = Yt T + U t T , Yt T = m s=mT +1 B Ut−s , mT ∈ N is a s=0 B Ut−s , Ut parameter of decomposition. h 7i By choosing δ = 1, kT = T − 1, mT = T 36 , where [·] means integer part,
ST =
T −1 X t=1
T
d X i,j=1
³ αij
n
(m ) (m ) Yti T Ytj T
−E PT t1 =1
(m ) (m ) Yti T Ytj T
o´ Oti Otj
Ot1 i Ot1 j
o´ ³ n (m ) (m ) (m ) (m ) Ot+1,i Otj βij Yt+1,iT Ytj T − E Yt+1,iT Ytj T , PT −1 O O t +1,i t j 1 1 t1 =1
+
171
Yu. Kharin and A. Huryn
and using lemmas 2, 3, one can easy verify the assumptions of Theorem 4 and thereby prove that η1 (T ) has the asymptotically normal distribution with zero mean and asymptotic variance: ∞ X
d ³ X
(1)
(1)
(2)
(2)
αij αi0 j 0 gτ,i,j,i0 ,j 0 Cτ,i,j,i0 ,j 0 + αij βi0 j 0 gτ,i,j,i0 ,j 0 Cτ,i,j,i0 ,j 0 +
τ =−∞ i,i0 ,j,j 0 =1
´ (4) (4) (3) (3) βij αi0 j 0 gτ,i,j,i0 ,j 0 Cτ,i,j,i0 ,j 0 + βij βi0 j 0 gτ,i,j,i0 ,j 0 Cτ,i,j,i0 ,j 0 . The convergence in probability of the second and the third terms to zero takes place: η2 (T ) −→P 0, η3 (T ) −→P 0 at T → ∞. Then according to the theorem of Shiryaev which is composed ´ √(1995) ³ the vector, ´ √ ³ ˆ ˆ of the elements of the matrices T G − G , T G1 − G1 , has the asymptotically normal distribution with zero mean and asymptotic covariances (10). ¤ Theorem 5 Let the model (1) and the assumptions A2, A4, ³A5 take´place. Then at √ ˆ − B , has the asympT → ∞ the vector, composed of the elements of the matrix T B totically normal distribution with zero mean and asymptotic covariances: ½ ´ √ ³ ´ √ ³ ˆ −B , T B ˆ −B acov T B ij
Ã
d X
(1) (1) Bik Bi0 k0 gτ,k,l,k0 ,l0 Cτ,k,l,k0 ,l0
+
¾ =
i0 j 0
∞ d X X ¡ l,l0 =1
(4) (4) gτ,i,l,i0 ,l0 Cτ,i,l,i0 ,l0
G−1
¢ ¡ lj
G−1
¢
×
l0 j 0
(11)
τ =−∞
−2
k,k0 =1
d X
! (2) (2) Bik gτ,k,l,i0 ,l0 Cτ,k,l,i0 ,l0
,
k=1
where i, j, i0 , j 0 ∈ {1, . . . , k}. Proof. Transform the normed deviation using the formula (9): ´ √ ³ ³ ´ ³ ´ ´ √ ³ ˆ − B = T −G ˆ 1G ˆ −1 G ˆ − G G−1 + G ˆ 1 − G1 G−1 . T B Define the linear combination with arbitrary coefficients αij ∈ R: d X
d ´ √ ³ √ X ˆ −B αij T B αij × = T ij
i,j=1
Ã
d X
³
ˆ 1G ˆ −1 (−1) G
k,l=1
´ ³ ik
i,j=1
d ³ ´ ¡ ´ ¡ X ¢ ¢ −1 ˆ ˆ G lj + G−1 lj G−G G1 − G1 kl
il
l=1
! .
Using Theorem 3, Lemma 4 and the well known theorem on continuous functional transformations of random vectors (Barndorff-Nielsen and Cox, 1989), we come to the asymptotic normality of the linear combination with zero mean and asymptotic variance: Ã d ( d ´ ¡ X √ X ¢ ¢ ³ ¡ ˆ−G G−1 + G αij (−1) G1 G−1 T aD ik
i,j=1
k,l=1
kl
lj
172
Austrian Journal of Statistics, Vol. 34 (2005), No. 2, 163-174
d ³ X
Ã
ˆ 1 − G1 G
´ ¡ il
l=1 d X
¢ G−1 lj
!)
d X
=
αij αi0 j 0
i,j,i0 ,j 0 =1
(1) (1) Bik Bi0 k0 gτ,k,l,k0 ,l0 Cτ,k,l,k0 ,l0
+
d ∞ X X ¡ −1 ¢ ¡ −1 ¢ G lj G l0 j 0 × l,l0 =1 τ =−∞
(4) (4) gτ,i,l,i0 ,l0 Cτ,i,l,i0 ,l0
−2
k,k0 =1
d X
(2) (2) Bik gτ,k,l,i0 ,l0 Cτ,k,l,i0 ,l0
! .
k=1
´ √ ³ ˆ − B , has the asympThus the vector, composed of the elements of the matrix T B totically normal distribution with zero mean and asymptotic covariances (11). ¤
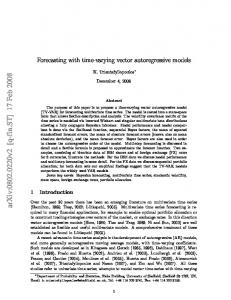
5 Numerical Results To evaluate the performance of the estimators (9), the experiment on the celebrated “Beveridge price index for wheat 1500 – 1869” (Anderson, 1971) was made. The AR(3) model is yt+1 = 0.7489yt − 0.3397yt−1 + 0.0388yt−2 + ξt , where {ξt } are i.i.d. Gaussian random variables with zero mean and the variance σ 2 = 4, t− = 1, t+ = T = 100. This model was transformed to the 3-variate VAR(1)-modeln(1) withhYt = (Yt , iYt−1 , Yt−2 )0 ∈ R3 and T −d i, i ∈ {1, . . . , [(T − was considered for the “missing patterns” Ot = 0, t = [(T −d)γ]+1 d)γ]}; 1, else}, where γ is a given portion of missing values, d = 3. Dependence of P400 Pd 1 2 ˆ (i) the sample variance Vˆ = 400 i=1 k,l=1 (Bkl − Bkl ) (for 400 Monte-Carlo replications) for the estimator (9) on the length T of observed time series is presented in Figure 1 for different portions of missing values γ ∈ {0, 0.07, 0.1}. Also the ³ empirical ´risk of P400 (i) 1 2 forecasting rˆ = 400 i=1 (ˆ yT +1 − yT +1 ) for the forecast yˆT +1 = YˆT +1,plug−in was 1 evaluated, its dependence on the length T is presented in Figure 2. 0,7 0,6
Variance
0,5 Gamma=0 Gamma=0.07 Gamma=0.1
0,4 0,3 0,2 0,1 0 5
10
20
30
40
50
60
T
ˆ Figure 1: Sample variance of the estimator B
173
Risk
Yu. Kharin and A. Huryn
8 7,5 7 6,5 6 5,5 5 4,5 4 3,5 3
Gamma=0 Gamma=0.1
5
10
20
30
40
50
60
T
Figure 2: Empirical risk for the forecast YˆT +1,plug−in
References T.W. Anderson. The Statistical Analysis of Time Series. Wiley, New York, 1st edition, 1971. O.E. Barndorff-Nielsen and D.R. Cox. Asymptotic Techniques for Use in Statistics. Chapman and Hall, London, 1st edition, 1989. J. Beran, R.J. Bhansali, and D. Ocker. On unified model selection for stationary and nonstationary short- and long-memory autoregressive processes. Biometrica, 85(4): 921–934, 1998. W.H. Greene. Econometric Analysis. Macmillan, New York, 1st edition, 2000. R.H. Jones. Maximum likelihood fitting of arma models to time series with missing observations. Technometrics, 22(3):389–395, 1980. Yu.S. Kharin2 and A.S. Huryn. Statistical analysis and forecasting of autoregressive time series under missing values. Bulletin of the International Statistic Institute, (1):612– 613, 2003. R. Little and D. Rubin. Statistical Analysis with Missing Data. Wiley, New York, 1st edition, 1987. M. Maejima. A non-uniform estimate in the central limit theorem for m-dependent random variables. KEIO Engineering Reports, 31(2):15–20, 1978. S.G. Pantula and D. Shin. Testing for a unit root in autoregressive processes with systematic but incomplete sampling. Stat. & Prob. Letters, 18:183–190, 1993.
174
Austrian Journal of Statistics, Vol. 34 (2005), No. 2, 163-174
J.L. Shafer. Analysis of Incomplete Data. Chapman and Hall, London, 1st edition, 1997. V.V. Shergin. Estimate of the error term in the central limit theorem for m-dependent random variables. Lietuvos Matematikos Rinkinys, 16(4):245–250, 1976. A.N. Shiryaev. Probability. Springer-Verlag, New York, 1st edition, 1995. N. Stockinger and R. Dutter. Robust time series snalysis: A survey. Kybernetika, 23: 3–90, 1987.
Corresponding author’s address: Univ.-Prof. Dr. Yuriy Kharin Department of Mathematical Modelling and Data Analysis Belarusian State University Fr. Skoriny av. 4 220050 Minsk Belarus Tel. +375 17 2095530 E-mail:
[email protected]