The Journal of Neuroscience, December 20, 2006 • 26(51):13143–13155 • 13143
Behavioral/Systems/Cognitive
Apparent Encoding of Sequential Context in Rat Medial Prefrontal Cortex Is Accounted for by Behavioral Variability David R. Euston and Bruce L. McNaughton Arizona Research Laboratories Division of Neural Systems, Memory, and Aging, University of Arizona, Tucson, Arizona 85724-5115
Simple sequences can be represented via asymmetrically linked neural assemblies, provided that the elements of the sequence are unique. When elements repeat, however (e.g., A-B-C-B-A), the same element belongs to two separate “sequential contexts,” and a more complex encoding mechanism is required. To enable correct sequence performance, some neural structure must provide a disambiguating signal that differentiates the two sequential contexts (i.e., B as an element of “A-B” as opposed to “C-B”). The disambiguating signal may derive from a form of working memory, or, in some cases, a simple timing mechanism may suffice. To investigate the possible role of medial prefrontal cortex in complex sequence encoding, rats were trained on a spatial sequence containing two adjacent repeated segments (e.g., A-B-C-D-B-C-E). The double-repeat procedure minimized behavioral differences in the second leg (C) of the repeat subsequence that arise in the first leg (B) because of differences in the entry point (e.g., A-B vs D-B). Far more cells were context sensitive along the first leg than along the second (36 vs 9%), and most of the differences were accounted for by systematic variations in the rat’s trajectory, which were much larger along the first leg. There is thus little evidence for sequential context-discriminative activity in the medial prefrontal cortex that cannot plausibly be accounted for by context-dependent behavior. The finding that the rodent medial prefrontal cortex is highly sensitive to sensory– behavioral variables raises doubts about previous experiments that purport to show working memoryrelated activity in this region. Key words: delayed alternation; prefrontal; prelimbic cortex; rat; sequence disambiguation; working memory
Introduction Although a simple chain of neurons with unidirectional links can easily represent nonrepeating sequences (Hebb, 1949), repeated elements present a “disambiguation” problem (Lashley, 1951). Consider, for example, a rat trained to traverse a repeated series of connected paths, say, A-B-C-B-A. The ambiguity that arises after B requires that some part of the rat’s brain track whether this is the first or second traversal of B. In other words, repeated sequences require that the immediate history (i.e., sequential context) be internally represented (Minai et al., 1994). Representation of sequential context may be mediated by the prefrontal cortex (PFC). In humans, the dorsolateral PFC is involved in sequence performance and acquisition (Shimamura et al., 1990; Pascual-Leone et al., 1996; Honda et al., 1998; Gomez Beldarrain et al., 1999; Gomez Beldarrain et al., 2002). In rats, tasks requiring knowledge of temporal order of spatial locations
Received May 3, 2006; revised Nov. 3, 2006; accepted Nov. 4, 2006. This work was supported by National Institutes of Health Grants NS20331 and MH46823 and the Japan Science and Technology Corporation/Core Research for Evolutional Science and Technology. We thank Stephen Cowen, Dr. Mark Bower, Dr. Pawel Musial, and Dr. Jean-Marc Fellous for help with design and construction of the experimental apparatus, Ryan Roop, Gustaf Van Acker, Jennifer Dees, Shea Van Rhoads, and Jeri Meltzer for help with data collection and analysis, Dr. Peter Lipa for technical consulting on analyses, and Kevin Iamiceli and Casey Stengel for support of Neuralynx recording equipment and software. Ryan Roop’s participation in this research was partially supported by Howard Hughes Medical Institute Grant 52003749 to the University of Arizona. Correspondence should be addressed to Bruce L. McNaughton, Arizona Research Laboratory Division of Neural Systems, Memory, and Aging, Life Sciences North Building, Room 384, University of Arizona, Tucson, AZ 857245115. E-mail:
[email protected]. DOI:10.1523/JNEUROSCI.3803-06.2006 Copyright © 2006 Society for Neuroscience 0270-6474/06/2613143-13$15.00/0
(Kesner and Holbrook, 1987; Chiba et al., 1994, 1997) or actions (Mogensen and Holm, 1994) are impaired after medial frontal lesions. The rat PFC is also critical in trace conditioning, which can be viewed as a simple two-element sequence consisting of stimulus and response (Takehara et al., 2003). Indeed, Fuster (2001) has suggested that the PFC specifically mediates “crosstemporal contingencies,” a capability demanded by repeatedelement sequences. Ambiguities inherent in repeated-element sequences may be resolved by two mechanisms. In one, the recent sequential history is stored in working memory. In the other, choices between sequential segments are based on time elapsed since some consistently chosen point in the sequence. In either case, some brain area must carry a context-disambiguating signal. For example, in the previously cited sequence, A-B-C-B-A, cells in this area would have different firing rates for the first and second traversals of the repeated “B” segment. Timing deficits after medial prefrontal cortex (mPFC) lesions have been reported (Olton, 1989; Chaillan et al., 1997; Dietrich and Allen, 1998). Many more studies show that rats with mPFC lesions are impaired on tasks requiring a delay between stimulus and response (for review, see Kesner, 2000; Uylings et al., 2003). As in the primate dorsolateral PFC, cells in rat mPFC exhibit extended firing during delay periods on working memory tasks (Sakurai and Sugimoto, 1986; Batuev et al., 1990; Mulder et al., 2000; Chang et al., 2002; Baeg et al., 2003). The electrophysiological evidence for delay-related activity, however, is equivocal. Jung et al. (1998) found only 2 cells of 187 with plausibly working
Euston and McNaughton • Sequence Encoding in Prefrontal Cortex
13144 • J. Neurosci., December 20, 2006 • 26(51):13143–13155
memory-related activity. In fact, several studies have focused instead on mPFC responses to goals predictive of proximal reward (Chang et al., 1998; Pratt and Mizumori, 2001; Hok et al., 2005). If the rat mPFC subserves sequence encoding, via either working memory or timing, then mPFC cells might be expected to differentiate sequential context. The present experiment tested this hypothesis using spatial sequences with repeated elements. Importantly, demonstration of context-selective cellular responses requires control for context-specific behavior. Otherwise, a behaviorally responsive area might appear to be context selective when in fact it was merely mirroring changes in behavior.
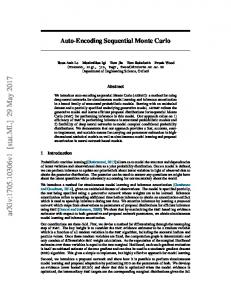
Figure 1. Behavioral task. A, The rat performed a spatial sequence task on a 1.3-m-diameter circular platform. Attached to the rat’s head was a unity gain head stage equipped with light-emitting diodes for tracking purposes and signal cable. Surrounding the maze were eight automated feeders. Each feeder consisted of a reservoir and a solenoid valve for regulating the timing of reward and amount of fluid delivered. Feeders were used for rat 2 only. Rats 1 and 3 ran for electrical brain stimulation. B, Examples of sequences used during the experiment. Rats ran the blue trajectories and then the red, alternating repeatedly. Red and blue sequences together comprised the entire sequence, consisting of eight segments. Note the repeated V-shaped subsequence.
Materials and Methods Subjects
Three male Brown Norway/Fisher 344 hybrid rats (7–9 months old at the time of surgery, 350 – 400 g) were housed in Plexiglas home cages and maintained on a reversed 24 h light/dark cycle. Training and recording sessions occurred during the dark portion of this cycle.
Apparatus All behavior took place on a 1.3-m-diameter circular arena (Fig. 1) (Bower et al., 2005). Light emitting diodes (LEDs) and feeders were located at eight equally spaced locations around the perimeter. The LEDs were located 2 cm above the table surface and flashed at 2 Hz when lit. Liquid feeders were gravity driven and constructed using a 60 ml syringe connected via Tygon tubing (Formula B-44-4X; Saint-Gobain Performance Plastics, Akron, OH) to a solenoid valve (Series 3, two-way solenoid valve; Parker Hannifin Corporation, Pneutronics Division, Hollis, NH) and finally to a feeding port (1⁄8 inch inner diameter polypropylene male luer tubing connector; Small Parts, Miami Lakes, FL) placed in a small plastic weigh boat glued to a 5 cm steel washer and placed on the table surface. Weigh boats were removed for rats trained using electrical brain stimulation. The experiment was controlled by a BX-35 microcontroller card (Netmedia, Tucson, AZ) and a standard personal computer. The computer also performed data acquisition. Custom software monitored the rat’s position and turned on lights, tones, feeders, and electrical brain stimulation as required. Solenoids were controlled via a bank of optical isolators (I/O module 70-ODC5; Grayhill, LaGrange, IL), whereas LEDs were driven directly from the transistor-transistor logic (TTL) output of the microcontroller. Electrical brain stimulation, delivered via a stimulus isolator (model A365; World Precision Instruments, Sarasota, FL), was also driven via microcontroller TTL output. Tones were delivered using the built-in audio controller of the personal computer. For every control event delivered by the BX-35, a signal was delivered concurrently to the TTL input port on the recording apparatus (described below) for time stamping using the same clock used for neural and video data.
Data acquisition Neural recordings were obtained via a chronically implanted “hyperdrive” consisting of 12 independently manipulable tetrodes. Each tetrode consisted of four, polyimide-coated, nichrome wires (14 m diameter; Kanthal Palm Coast, Palm Coast, FL) twisted together (Wilson and McNaughton, 1993). Hyperdrive construction was as described by Gothard et al. (1996) except that tetrodes were inserted into silica tubing (65 m inner diameter, 125 m outer diameter; part number TSP 065125; Polymicro Technologies, Phoenix, AZ) for added rigidity and secured with cyanoacrylate glue after insertion into the drive. During recording sessions, the hyperdrive was connected to a unitygain head stage (Neuralynx, Tucson, AZ) that enabled low-noise transmission of neural data to the recording system. The head stage also con-
tained an array of LEDs that could be detected by an overhead camera, enabling tracking of the position of the rat on the maze at 60 frames/s. All data were recorded using a Cheetah recording system (Neuralynx) running in combination with the computer. Single-unit data from each tetrode were amplified, filtered between 0.6 and 6 kHz (Assembly Hunter amplifiers; Neuralynx), and digitized at 32 kHz. Video spatial resolution was ⬃3 pixels/cm.
Surgery and electrode placement National Institutes of Health guidelines and Institutional Animal Care and Use Committee approved protocols were followed for all surgical procedures. Each rat was anesthetized with isoflurane (1–1.5% by volume in oxygen at a flow rate of 1.5 L/min; Holocarbon Laboratories, River Edge, NJ), placed in a stereotaxic holder, and injected with penicillin G (30,000 U per hindleg, i.m.; Phoenix Scientific, Fort Dodge, IA). The skull was cleared of skin and fascia, and craniotomies were opened for two stimulating electrodes targeting the medial forebrain bundle (MFB) [rats 1 and 2: ⫺3.25 mm anteroposterior (AP), 1.65 mm mediolateral (ML) bilaterally, 8.5 mm ventral from dura; rat 3: ⫺2.5 mm AP, 1.8 mm ML, 8.5 mm ventral and ⫺4.0 mm AP, 1.5 mm ML, 8.2 mm ventral] and a hyperdrive. Each stimulating electrode consisted of two, Teflon-coated, stainless steel wires (coated diameter of 0.0045 inches; 316SS3T; MedWire, Mt. Vernon, NY) twisted together with ⬃0.5 mm of insulation removed from one tip. The hyperdrive was centered over the left mPFC at 3.0 (rat 1), 3.2 (rat 2), or 2.9 (rat 3) mm AP, 1.3 mm ML and was angled at 9.5° toward the midline. It should be noted that the bundle of cannula holding the electrodes as they entered the brain, and therefore the electrodes themselves, extended ⬃1.4 –2 mm in the anteroposterior dimension so that cells were sampled from a relatively wide region of the medial frontal cortex. Mediolateral extent varied between 0.5 and 1.4 mm, depending on the geometry of the cannula bundle. Rats 2 and 3 had depth electroencephalogram (EEG) electrodes implanted in the hippocampus at ⫺3.8 AP, 2.5 ML, and a depth of 2 and 2.5 mm below the dura. Data from EEG electrodes are not reported here. Rats were returned to ad libitum feeding and allowed to recover for 3– 4 d after surgery. Single units were recorded with respect to a reference electrode positioned deep in the mPFC (5000 m from brain surface). The tetrodes were moved gradually from 2000 to 4000 m from the brain surface, keeping all electrodes at the same depth as nearly as possible. Typically, a full set of behavior (see below) was obtained at a given depth and then the electrodes were moved down 80 –120 m to ensure a fresh group of cells. After that, tetrodes were moved only as necessary to obtain good recordings until the next ensemble turning event. This procedure was repeated until electrodes reached a depth of 4000 m (rats 1 and 2) or 3200 m (rat 3). All tetrode positioning was done after a given recording session, to allow the tetrodes at least 18 h to stabilize. After all recordings were complete, the tips of the recording electrodes were marked by electrolytic lesions (5 A for 10 s, positive to electrode,
Euston and McNaughton • Sequence Encoding in Prefrontal Cortex
J. Neurosci., December 20, 2006 • 26(51):13143–13155 • 13145
coordinates but was not histologically confirmed.
Reward Rat 1 was pretrained using manually delivered 45 mg food pellets (Noyes precision pellets; Research Diets, New Brunswick, NJ). Rats 2 and 3 were pretrained using liquid food reward. After stimulation electrode placement, MFB stimulation was used as reinforcing reward for rats 1 and 3 (for review and training techniques, see Olds and Milner, 1954; Olds and Fobes, 1981; Liebman and Cooper, 1989). A range of stimulation parameters was explored using an operant conditioning chamber equipped to deliver MFB stimulation when the rat performed a nose poke. The final selected MFB stimulation consisted of a train of 400-s-wide, 70 –100 A, biphasic current pulses, delivered at 150 Hz for 300 –350 ms. Rat 2 was implanted for stimulation, but the electrodes were ineffective and so food reward was used instead. Each individual reward consisted of 0.030 – 0.045 ml of liquid Ensure nutritional supplement (vanilla flavor; Abbott Laboratories, Abbott Park, IL).
Behavioral procedures
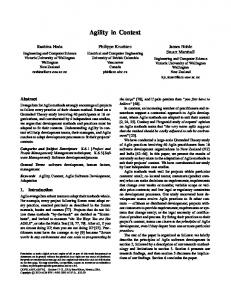
Figure 2. Location of recording electrodes. A, Coronal section through the frontal cortex of rats 1 and 2. In each photograph, damage to superficial cortex from the electrode bundle can be seen at the top, and the location of some electrode tips are noted with arrows. The more superficial electrode in rat 1 may have been one of three (of 12 total) electrodes that got stuck and is not representative of normal final electrode depth. Although it is not apparent in these pictures, the electrodes in rat 2 were found to be more anterior than those in rat 1; however, the electrodes in both rats overlapped in the central anteroposterior portion of the ACd and PL shown in these slices. B, Approximate path of the tetrodes. The hyperdrive was mounted at a 9.5° angle, as shown, to avoid the central sinus. (Figure altered from Paxinos and Watson, 1997.) M1, Primary motor cortex; FR2, frontal area 2; IL, infralimbic cortex. negative to head-stage ground). Histological sections confirmed that the electrodes in rats 1 and 2 were in the dorsal anterior cingulate (ACd) and prelimbic cortex (PL) regions, with most electrodes in the deep layers (Fig. 2). Electrode placement in rat 3 was inferred based on stereotaxic
For pretraining purposes, all rats were food deprived to 85% of their ad libitum weight. The rats were pretrained to find reward at one of the eight, equally spaced zones on the edge of the circular arena. A training session lasted 50 – 60 min and comprised a randomly selected series of segments. The process of running each segment will subsequently be referred to as a “trial.” Each trial began with two, simultaneously presented cues: a nondirectional 4 kHz tone that signaled the availability of reward somewhere in the arena, and the illumination of one blinking LED that marked the correct reward zone. Rats were trained to run to the vicinity of the correct reward zone (within 10 cm) whereupon the reward was delivered and the trial was completed. The next trail began after a fixed delay from the onset of reward delivery (500 ms for stimulationtrained rats and 1000 ms for the food-trained rat). This training continued until each rat made direct trajectories to reward locations. Sequence training occurred after surgery. Sequence tasks were presented to each rat by cueing reward zones in a predetermined order. The trial structure and delay period were the same as during pretraining. After a rat completed a sequence three times with guidance from LED cues (a “cued” block of sequences), a 5 s delay was inserted between the nonspatial, audio cue and the illumination of the cue light, providing time for the rat to move to the next reward location without the aid of the visual cue. After the rat completed the sequence three times with a delayed visual cue (a “noncued” block), audio and visual cues were presented simultaneously, again, starting another cued block. Blocks of three, complete traversals of the sequence alternated between cued and noncued throughout the duration of the recording session. At the start of the experiment, the rat was brought into the recording room and placed in a towel-lined bowl in the center of the recording arena. The head stage was attached to the hyperdrive. The signal gain and threshold of each electrode were manually set via visual inspection, data recording was initiated, and the rat was allowed to rest for 20 – 40 min in the towel-lined bowl. After this rest period, the rat was moved from the bowl to the arena. The behavioral phase began when the first cue (consisting of a light and tone) was given and lasted from 50 to 60 min. The rat was then returned to the towel-lined bowl and allowed to rest for another 20 – 40 min. Rats 1 and 3 then ran another behavioral phase and were given a final rest epoch. Rat 2 had only one behavioral epoch between two sleep epochs because it was generally sated after the single behavioral phase and hence not motivated to run again. Data acquired during the rest epochs were combined with data from the behavioral epoch to enable better identification of single cells during off-line cell isolation and to verify stability. Two different sequences were used, each containing two repeated segments in the shape of a “V,” followed by an alternating choice between two zones (Fig. 1). The two sequences are topologically equivalent and were treated as identical for analysis purposes. Two repeated segments were used, rather than one, to increase the demands on sequence disambiguation mechanisms (i.e., to extend the time during which external cues were identical and internal representations were relied on to guide behavior). It also had the benefit of providing more regular behavior along the second repeated segment.
Euston and McNaughton • Sequence Encoding in Prefrontal Cortex
13146 • J. Neurosci., December 20, 2006 • 26(51):13143–13155
For each sequence, rats were trained until they reached asymptotic performance. For rats 1 and 3, trained with MFB stimulation, asymptotic performance was usually reached within 3 d, using two training sessions per day. For rat 2, trained with food reward, asymptotic performance took as long as 2 weeks using one session per day. Electrodes were then pushed down to acquire new cells and a new sequence was initiated. The new sequence was created by flipping and rotating the original sequence so as to create a sequence novel to the rat. The flip ensured that the order of turns was reversed, whereas the rotation ensured that a different configuration of places was rewarded. Rats 1 and 3 were presented with a simple six-element nonrepeating sequence for 2 d before starting each new repeat-element sequence. With rat 2, electrodes were sometimes pushed down without changing the sequence so as to avoid the training delay associated with each sequence switch.
Data analysis Preprocessing. For rats 1 and 3, artifact arising from MFB stimulation was removed by deleting all spikes recorded during the stimulation and those occurring within 20 ms of stimulation termination (i.e., the blackout window was stimulus duration plus 20 ms). Putative single neurons were isolated using a specialized software package (MClust; David Redish, University of Minnesota, Minneapolis, MN) that allows sorting based on the relative action potential amplitudes on the different tetrode channels and other waveform parameters (McNaughton et al., 1983; Wilson and McNaughton, 1994). The end result is a collection of time stamps associated with each action potential from a given unit. Position during each video frame was extracted by fitting a circle to the ring of LEDs on the head stage in each video frame. Assessment of behavior. The rat’s behavior on any given session was judged using accuracy and path consistency. Accuracy was assessed at the point in the sequence just after the two repeated segments, when the rat had to choose between one of two subsequent reward sites. A trial was graded as a “hit” if the rat ran to the correct reward site within 5 s of the trial onset and did so without coming within 10 pixels of the alternate reward site. Accuracy was computed as total hits over total number of choice trials and was assessed for both cued and noncued trials separately. On the noncued trials, the 5 s criterion ensured that all measured behavior was performed without a directional cue. Sessions in which overall accuracy on noncued trials dropped below 70% were excluded from analysis. Path consistency was assessed along the second repeated segment using a t test on path deviations, comparing paths for the first and second traversals. Path deviation refers to the lateral displacement of each individual path relative to the median path. It was measured perpendicular to the direction of travel at five equally spaced locations. To compute the median path, a line was first drawn between the two goal zones (e.g., before and after the second repeated segment), and five equally spaced lines were extended perpendicular to it. The lateral position of a given path was found by taking the intersection of that path with the five perpendicular lines and measuring the straight-line distance of these points from the original line parallel to the direction of travel. This yielded five measurements of the path deviation for each segment. The median path was found by taking the median of these deviation values along each of the five perpendicular lines. Deviations were then recomputed relative to the median path, such that the median path had a deviation of zero. Path deviations, computed at each of the five locations, were segregated according to first and second traversals of the repeated segment. A t test ( p ⬍ 0.01) was used to test whether the paths differed significantly between these two conditions (i.e., whether paths differed as a function of sequential context). This information was used to limit analyses to only those sessions in which path differences along the second repeated segment were nonsignificant. On days on which a rat ran two behavioral sessions, the session with the smallest path differences along the second repeated segment was used for subsequent analyses. The only exceptions to these screening rules were the analyses shown in Figures 3C and 7. In these cases, the need for a larger number of trials or greater range of variability required that both first and second behavioral sessions were included from days in which two behavioral sessions were recorded.
Computations on binned mean firing rates. Typically, rats actively sought goals and ran quickly to them, but this activity was interrupted at times by pauses or grooming bouts lasting from several seconds to ⬎1 min. Further complicating analyses, the task was run in an open arena that allowed rats to move anywhere at any time, allowing rats to make more and different types of errors than are possible when movement is constrained to an elevated track or walled corridor. To ensure that data used for analyses came only from trials during which the rat was highly motivated to find the goal, two criteria were established to remove trials containing other behaviors. First, any trial in which the rat took longer than 5 s to reach the goal zone was excluded. (The time measured here extended from the beginning of the trial-onset tone and ended with arrival at the goal zone.) Second, the trials were screened for the amount of path deviation (computed as described in the preceding section). A trial was excluded if its deviation from the median path exceeded four times the upper or lower quartile deviation at any of the five locations at which path deviations were measured. Binned firing rates were computed along both the first and second repeated segments. To compute the binned firing rate along a given segment, the average path taken by the rat through the segment was divided into five spatial bins of equal length, using bin edges described in the preceding section. For each bin of each segment, the firing rate of each unit was computed by dividing the total number of spikes in the bin by the total bin occupancy time, yielding firing rate in Hertz. Trials were segregated according to sequential context (i.e., whether it was the first or second traversal of the repeated subsequence within that iteration of the sequence) and cue status (i.e., cued or noncued). The magnitude of the effect of a given variable on the firing rate of a cell was assessed using z-scores. Five difference scores were extracted from each cell examined: context-related differences along V1 and V2 (for the first and second segments, respectively, of the repeated V-shaped subsequence), cued/noncued differences, within-segment differences, and between-segment differences. All analyses were based on the bins described above, five for each segment. For context and cue variables, z-scores were computed in the middle bin (i.e., bin 2, 3, or 4, of 5) with highest firing rate. Context-related firing rate differences were computed within this bin, comparing context 1 with context 2. A separate context z-score was computed for V1 and V2. Context differences were assessed on noncued sequence traversals only. For the cue-condition comparison, the firing rate was computed for cued and noncued segment traversals separately within the maximum bin, and their difference was taken. In both context and cue comparisons, cells with firing rates ⬍1 Hz in every bin were excluded. For the within-segment comparison, all eight segments in the sequence were divided into five equally spaced bins and both cued and noncued laps were combined. The segment containing the bin with maximum firing was then chosen. If the maximum bin failed to exceed 1 Hz firing, the cell was excluded from the analysis. Within the maximumfiring-rate segment, the firing rate difference between the first and last bins (bins 1 and 5) was taken as the within-segment difference. This approach captured most of the within-segment selectivity, because most cells expressing within-segment differences had firing rates that either ramped down with distance from the preceding goal or ramped up with approach to the subsequent goal (see Fig. 4 A). Computation of the between-segment difference was similar to that of the within-segment difference except that the bin with maximum firing was compared with the same bin position on the immediately preceding segment (e.g., if the third bin of the segment 4 had the highest firing rate, this bin was compared against the third bin of segment 3). Note that both within- and between-segment comparisons were designed as binary comparisons so that they were directly comparable with cue and context measures, both of which have only two levels. In all comparisons, SDs were estimated by treating each repetition of the segment (i.e., each trail) as a separate observation.
Results Behavior Three rats were trained on the complex sequence depicted in Figure 1. Previous research has shown that the performance dec-
Euston and McNaughton • Sequence Encoding in Prefrontal Cortex
J. Neurosci., December 20, 2006 • 26(51):13143–13155 • 13147
rement after rotating such a sequence relative to the local and distal cues (which leaves the series of turns intact) is equivalent to that seen after a mirror inversion and rotation (which alters both the series of turns and the locations at which they occur) (Bower et al., 2005). It can thus be inferred that performance on these sequences requires more than memorization of a series of turns (i.e., it is not a simple motor sequence). Another argument against a simple motor mechanism is the fact that, even before the cue light was illuminated, rats sometimes made midcourse corrections when choosing between the two possible goals after the repeated segments (Fig. 3A, top left). Sequence training alternated between blocks of three cued sequences, during which a cue light marked the next correct reward zone, and blocks of three noncued sequences, during which illumination of the cue light was delayed by 5 s. The noncued condition afforded the rat the opportunity to recall the next reward location from memory. After training, rats were highly proficient on the sequence task. In each session, rats ran the complete eight-element sequence between 77 and 138 times (median of 115). Excluding the two segments after the repeated segment, the median percentage of noncued trials on which rats arrived at the target before cue light onset was 96% (range of 84 –100%). Behavioral accuracy was assessed on the choice after the two repeated segments, using noncued trials only. As illustrated in Figure 3, rats typically ran straight for the correct zone and, on the occasional incorrect trial, went to the alternate zone. Noncued accuracy for analyzed sessions ranged from 74 to 98% (Fig. 3) (mean ⫾ SD; rat 1, 90 ⫾ 7; rat 2, 84 ⫾ 4; rat 3, 93 ⫾ 4). A binomial test showed that, in all sessions, the level of accuracy was statistically ⬎50% ( p ⬍ 0.01). Cued accuracy was typically better than noncued accuracy, sometimes reaching 100%. As mentioned in Introduction, repeated sequence performance could be based on working memory or timing. Under the working memory hypothesis, the brain would store a representation of the previously traversed segments. Under the timing hypothesis, the rat would reset some internal timing mechanism each time a specific location in the sequence was passed. Path decisions after the repeated segments would then be based on duration of time elapsed since passing that specific location (e.g., long times might mean “turn left” and short times might mean “turn right”). It is difficult to discriminate between working memory and timing mechanisms; however, one prediction of the timing mechanism is that repetitions of the sequence that take significantly shorter or longer than the median time, to which the internal timer is presumably calibrated, should have elevated error rates. Contrary to this prediction, Figure 3C shows that error 4
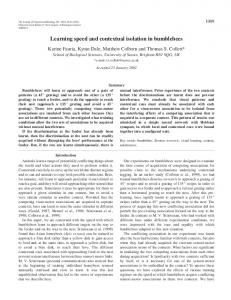
Figure 3. Behavioral performance. A, Example trajectories. Each row shows data from one rat. Both subpanels show trajectories along the first and second traversals of the repeated segments in light blue and light red, respectively. Arrows indicate direction of travel. Subsequent trajectories for the first traversal of the repeated segments are shown on the left in blue. Subsequent trajectories for the second traversal are shown on the right in red. The correct goal zone is indicated by a yellow star. It is apparent that rats rarely made mistakes. B, Histograms of
accuracy for every session analyzed, with cued and noncued conditions plotted separately. Accuracy was measured immediately after the two repeated segments, at the point when the rat had to choose between one of two possible subsequent goal zones. During cued trials, rats were guided to reward locations by lights. C, Error rate as a function of running time. Time was measured between departure from choice goal zone (i.e., yellow stars in A) and completion of the V subsequence. As with accuracy measure above, errors refers to the goal zone chosen after the V. Within each choice type and session, times were scaled so that the median time was one (light red vertical line). Error bars indicate 95% confidence intervals for error rate estimates. Bar at 0.5 has height of zero. Last bar on the right shows error rates for all choices at which travel time exceeded twice the median time. Confidence intervals increase away from the median attributable primarily to a reduction in the number of available samples. Longer running times were associated with more errors than the median time but, contrary to the hypothesis that repeated-element sequences are solved via a timing mechanism, shorter times were associated with fewer errors.
13148 • J. Neurosci., December 20, 2006 • 26(51):13143–13155
Euston and McNaughton • Sequence Encoding in Prefrontal Cortex
Figure 4. Representative examples of spike spatial distributions during the repeated subsequence. Each panel shows the spike distributions from one cell overlaid on trajectories taken by the rat. Spikes and trajectories for the first pass through the repeated segments are in blue, and those for the second pass are in red. Arrows in the top left show direction of travel, which is consistent across examples (for clarity, paths have been rotated from their original position in some cases). In each panel, the two graphs to the right show the occupancy-normalized firing rate for the first and second segments within each subsequence, labeled V1 and V2, respectively. Means and SEs are shown for each of five equally spaced bins covering each segment. Consistent with trajectories on the left, the first and second traversal of the repeated segments are indicated in blue and red, respectively. A, Representative examples of cells whose firing rate changed as a function of position within a segment. These cells showed no significant difference in firing as a function of context. B, Examples of cells with context-related firing-rate differences along V1. C, Examples of cells with context-related differences along V2. The cells in B are representative of cells showing significant context-related differences along V1. In contrast, the cells in C were chosen to illustrate the maximum observed context-related differences along V2 and are rare.
rates increase when the rat runs slower than the median but actually decrease when the rat runs faster. The plotted values indicate the time to run the three segments preceding the point in the sequence when the rat must choose between the two possible subsequent goals (i.e., the three segments before the choice point). Times are expressed relative to the median time (average median time to complete each subsequence for rats 1, 2, and 3
were, respectively, 9.0, 10.9, and 9.5 s). It is also worth noting that, even when the time to complete the subsequence is twice the median time, error rates are still below the chance level of 0.5. Although these two observations argue against a timing mechanism explanation, they are not conclusive. First, it is important to note that motivation is clearly a confound. Slower running rates generally indicate that the rat is less motivated, which might also
Euston and McNaughton • Sequence Encoding in Prefrontal Cortex
Table 1. Results of cue ⴛ context ANOVA for all cells. V1
J. Neurosci., December 20, 2006 • 26(51):13143–13155 • 13149
differences between sequential contexts on V2. For these cells, the maximum Z-score difference between sequential contexts Rat Total cells 1 Hz Context Cue Cue ⫻ context 1 Hz Context Cue Cue ⫻ context was in the top 5% of all cells. 1 1692 906 405(44.7%) 15(1.7%) 12(1.3%) 863 97(11.2%) 24(2.8%) 7(0.8%) For almost all cells, the firing rate dif2 1289 801 209(26.1%) 11(1.4%) 9(1.1%) 766 46(6.0%) 7(0.9%) 6(0.8%) ferences between first and second travers3 320 201 65(32.3%) 4(2.0%) 1(0.5%) 185 19(10.3%) 4(2.2%) 2(1.1%) als of the common segments, when Total 3301 1908 679(35.6%) 30(1.6%) 22(1.2%) 1814 162(8.9%) 35(1.9%) 15(0.8%) present, were quantitative rather than The number of cells showing a significant effect of context, cue, or a significant cue ⫻ context interaction for all rats is shown. Results are shown separately qualitative (Fig. 4, the first cell in row C). for the first and second repeated segment (V1 and V2). Before conducting the ANOVA, cells were required to have at least a 1 Hz firing rate on the segment in question. Percentages shown are based on the number of cells passing the 1 Hz screening criterion. In other words, although a subpopulation of cells showed statistically different firing rates between the two contexts, there were lead to less accurate behavior. Second, this test is only valid for a timing model with a fixed interval. If the time interval on which no cells that were clearly “on” in one context and completely “off” the rat bases his decision were to scale with speed (or number of in the other. steps), then time to complete the sequence would not be expected To quantify the effect of context on cell firing, a two-way to influence accuracy and the present results could be completely ANOVA was run for each cell, with factors of cue and context. attributed to motivation effects. Firing rates were binned into five equally spaced bins. To minimize the effects of path differences near the endpoints of each Context-related activity on repeated segments trajectory, the analysis was conducted among the middle three A total of 3301 cells in the mPFC region were recorded from three bins only. The bin with the maximum firing was chosen for the rats during 34 recording sessions. Recording sessions were seANOVA. Trials were separated according to context (first or seclected from much larger set of daily recording sessions. Sessions ond traversal of the repeated segment) and cue condition (cued selected for analysis were those with the best behavioral accuracy or noncued). Parallel but separate ANOVAs were run on V1 and and most consistent paths at a given electrode depth. The total V2. In all tests, a difference was called significant if the probability number of cells recorded in any given session ranged from 35 to of that difference was ⬍0.01 ( p ⬍ 0.01). As shown in Table 1, a 145 and averaged 97. Examples of cellular responses along the total of 1908 cells showed firing above 1 Hz in one bin of V1. Of repeated segments of the sequence are shown in Figure 4. Binned these, 679 showed a significant effect of context. Only 30 showed firing rates are shown for the first and second segments within the a significant effect of cue, whereas 22 showed a significant cue ⫻ repeated subsequence, labeled V1 and V2, respectively, after the context interaction. Along V2, 1814 cells showed firing above 1 V-shape of the repeated subsequence. Typical cellular responses Hz, and 162 of these showed a significant context effect. Thirtyare shown in rows A and B. Many cells showed significant modfive showed a cue effect, and 15 showed a cue ⫻ context interaculation as a function of location within the segment, either detion. Parallel analyses using nonparametric statistics yielded simcreasing or increasing firing on approach to or departure from ilar results (see supplemental material, available at www. goal zones. Context-related firing rate differences were common jneurosci.org). In light of the fact that the probability of finding along V1, as shown in row B, but more rare along V2. The three differences by chance is 1%, it is apparent in Table 1 that cue cells in row C were chosen to illustrate the most extreme observed V2
Figure 5. Percentage of context-differentiating cells for each of the sessions analyzed. Each bar represents the percentage of cells, relative to the total number of cells having a firing rate of at least 1 Hz on the repeated segment, showing a significant firing rate difference between the first and second traversals of the repeated segment. Data are broken down by first and second repeated segments (V1 and V2, respectively) and plotted separately for each rat. The percentage of differentiating cells was consistently much smaller on the second repeated segment.
13150 • J. Neurosci., December 20, 2006 • 26(51):13143–13155
condition, either as a main effect or via an interaction with context, had little effect on cellular firing rates. The percentage of cells showing a firing rate difference as a function of context on the aforementioned cue ⫻ context ANOVA is broken down by session in Figure 5. The percentage of cells with contextrelated differences along V1 ranges from 70 to 5%. Along V2, the number of context-related differences is much lower, with a maximum of 22% and several sessions showing no differentiating cells (rat 2, sessions 175, 195, and 197). The overall percentage of differentiating cells was apparently lower in rat 2 than in rats 1 and 3, especially in the later sessions, which were recorded in a more ventral region of mPFC. This discrepancy may be attributable to slightly different anatomical locations of the recording electrodes between rats. It may also reflect the fact that rat 2 ran for food reward, whereas the other two rats ran for electrical brain stimulation. Brain stimulation produces higher levels of motivation, and this may have influenced the rat’s behavior and, consequently, neural firing rates.
Euston and McNaughton • Sequence Encoding in Prefrontal Cortex
Figure 6. Effect of behavioral path divergence on differential cellular activity. A, Examples of path divergence along the repeated V subsequence. Each column shows data from one session. Within a column, the top graph shows all raw trajectories, with arrows indicating the direction of travel. Trajectories for the first traversal of the repeated segment within the sequence are shown in blue, and those for the second are shown in red. The bottom graph shows the median trajectory extracted from the trajectories shown above. Circles show corresponding points along the paths. Numbers are in video camera pixels, in which each pixel covers ⬃0.33 cm. Although paths are generally similar for the two contexts, the paths diverge more along the first segment (V1) than the second (V2). B, Relationship between path divergence and the percentage of cells showing firing rates that differentiate the two sequential contexts (for specific criteria used, see Results). Maximum divergence is the maximum difference in the median paths followed during first and second traversals of the repeated segment, measured in pixels. Each dot represents data from one session. Color indicates whether data are from first or second repeated segment (i.e., V1 or V2). Sessions with larger divergence had a greater proportion of context-selective cells.
Effect of path variability on context-related differences The preceding analysis showed that the neural activity along the first repeated segment varies more as a function of sequential context than that along the second repeated segment. This presents a puzzle because the cognitive demands (to remember the preceding turn or to plan for the upcoming path decision) should be either similar along the entire length of the repeated subsequence or possibly even greater near the choice point at the end of the second segment. The solution to this puzzle lies, at least partially, in the fact Figure 7. Prediction accuracy based on population activity. A, For each cell in a session, firing rates were first determined for that the paths the rat took during the five equally spaced bins along each repeated segment. The binned firing rates were then assembled into an average firing rate first and second traversals tended to di- vector, one for each sequential context (i.e., those followed by left turns and those followed by right turns). Within each bin, the verge much more along segment V1 than rats’ behavior was then predicted for each choice after the repeated V subsequence based on vector similarity, using a leave-onealong segment V2, as can be seen from out training protocol (detailed in Results). Each session yielded one accuracy measurement for each bin. A, Average prediction the median paths shown in Figure 6 A. accuracy for all sessions (and all rats) is shown in black. As a control, gray lines show accuracy when training vectors are randomly shuffled into two groups, ignoring their true sequential context. Error bars show the SEM. Prediction accuracy was much higher Thus, the context-related firing rate difalong V1 than on V2. B, Average path divergence measured at the center of each of the bins used to create population vectors. ferences observed along segment V1 may Divergence is defined as the average distance between paths taken by the rat during the first and second traversals of the repeated be attributable, at least in part, to the fact segment. Path divergence was much greater, and more variable, in V1 than V2. that the physical locations traversed by the rat were different on the first and 0.01). Within each session, the results for each segment were second traversals. expressed as a percentage of the total number of cells active on To examine the effect of path variability on context-related that segment (i.e., firing rate ⬎1 Hz in one of the five bins). differences in more detail, the degree of path difference and Path differences were computed by comparing the median percentage of context-differentiating cells was computed for path within each sequential context (i.e., by comparing meeach repeated segment of each recording session. For each cell, dian paths taken during the first and second traversals of the firing rates were first computed in five equally spaced bins. repeated segments). The median path was computed at the Firing rates for both contexts were then computed in the bin center of each of the five aforementioned bins, and the pixel among the middle three with the greatest firing rate. Contextdistance between them was used as a measure of the path related firing rate differences were determined via a t test ( p ⬍
Euston and McNaughton • Sequence Encoding in Prefrontal Cortex
J. Neurosci., December 20, 2006 • 26(51):13143–13155 • 13151
significant proportion of the contextrelated firing rate differences observed. The fact that path deviations are larger on V1 than V2 is thus a plausible explanation as to why so many more cells show context-related firing rate differences along V1. Context discrimination using population activity To assess the ability of the ensemble of mPFC cells to differentiate sequential context, the population activity of all cells within each session was used to predict turn direction after the repeated segments. For this analysis, average population vectors were created for the two Figure 8. Distribution of z-scores for different firing rate comparisons. A, Histograms of firing rate differences for all cells, sequential contexts. The two repeated expressed as z-scores. The dark blue line shows distribution of z-score differences between the first and second traversals of the segments were divided into five bins first repeated segment (V1). Similarly, the red shows context-related differences for the second repeated segment (V2). The cyan each. An average firing rate population line shows the distribution of differences between cued and noncued trials. The green and magenta lines show the distribution of vector was constructed for each bin, exdifferences between and within segments, respectively. In the between-segment comparison, the location of maximum firing cluding cued repetitions and any repeti(i.e., one of five spatial bins spanning the segment) was compared with the bin in the same relative position along the immeditions in which the rat made mistakes. ately preceding segment. The within-segment comparison measures the difference between first and last bins within the segment with greatest firing. In each case, the differences in firing rate were expressed as a z-score. B, Proportion of all comparisons Each element in this vector was the averthat exceeded a z-score difference of 1.0 for all five aforementioned groups. Within- and between-segment comparisons yielded age firing rate of a single cell, excluding the largest firing rate difference, followed by context-related differences along V1. In comparison, differences attributable to cells with zero firing in ⬎90% of trials. Separate vectors were created for the context along V2 and to cue condition were very small. first and second traversals of the repeated segments. To predict turn direction, the firing rate vector for a single traversal of a given bin was compared against the two average firing rate vectors using Pearson’s correlation coefficient. The context that gave the better match was taken as the predicted sequential context (and therefore, predicted upcoming turn direction). Predicted results for each repetition were then compared against actual perforFigure 9. Medial prefrontal cortex response properties as a function of recording depth for both rats. Data shown are the firing rate mance to compute a prediction accuracy differences attributable to several behavioral variables, expressed as a z-score, and plotted against the median electrode depth. Variables rate within each bin. To avoid biasing correspondwiththosedescribedinFigure8.Toreiterate,“within”isthefiringratedifferencebetweenthefirstandlastbinswithinasingle segment, and “between” is the difference between maximum bin on one segment with the same bin on the immediately preceding the results, average firing rate vectors segment.V1andV2arefiringratedifferencesattributabletosequentialcontext,measuredalongthefirstandsecondrepeatingsegments, were recomputed for each repetition, respectively.Depthsaremeasuredrelativetothebrainsurface,asshowninFigure3B.Dataforallratsareplottedseparately.Thesegraphs excluding the sample vector whose pattern was being used for prediction. As a show that cells are less selective to all variables with increasing depth in the mPFC. control, average vectors were also created from randomly selected vectors divergence. The maximum path divergence across all five bins within a given bin, regardless of true sequential context. The was used as the representative divergence for that segment. sample vector was then classified into one of the two arbitrary Data from all analyzed recording sessions were included. Figgroups using vector similarity, as described above. Accuracy ure 6 B shows the percentage of differentiating cells as a funcwas judged based on the ability to predict the original group tion of the path divergence. A clear linear relationship is apmembership of the vector. parent, and the regression slope is significantly different from Figure 7 shows the prediction accuracy within each bin, averaged zero (slope of 0.69; intercept of 5.8; df ⫽ 104; p ⬍ 0.001; R 2 ⫽ across all analyzed sessions and all rats. Accuracy was greatest for the 0.48). The regression slopes within a given segment (i.e., V1 or first bin of V1 and gradually declined across subsequent bins. The V2 alone) are not significantly different from zero; however, if pattern continued within V2, with the first bin yielding the highest the power is increased by including data from each bin sepaprediction accuracy and the three subsequent bins yielding gradually rately, i.e., if the percentage of differentiating cells in each bin less accuracy. As expected, random shuffle accuracy was close to 50% is plotted against the deviation on that bin across all sessions, for all bins. Consistent with the greater number of differentiating then the regression slopes are significant within V1 and V2 cells along V1 than V2, prediction accuracy was much greater along separately (V1: slope of 0.26, intercept of 18.7, df ⫽ 263, p ⬍ V1 than V2, ranging from 94 to 76% on V1 and from 73 to 57% on 0.001, R 2 ⫽ 0.06; V2: slope of 0.77, intercept of 3.7, df ⫽ 263, p ⬍ 0.001, R 2 ⫽ 0.09). Path deviation can thus account for a V2. Accuracy in the least accurate bin was statistically greater than
Euston and McNaughton • Sequence Encoding in Prefrontal Cortex
13152 • J. Neurosci., December 20, 2006 • 26(51):13143–13155
chance but much less than the observed behavioral accuracy. Neurally based prediction accuracy along V1, in contrast, was close to that of behavioral accuracy. To account for the discrepancy in prediction accuracy between segments V1 and V2, path divergence, as defined in the preceding section, was examined within each bin. As can be seen in Figure 7, path divergence was much greater along V1 than V2. The greater path divergence may have lead to larger differences in firing rates, which, in turn, lead to greater prediction accuracy. Within each segment, however, the path divergence results do not account for the differences in prediction accuracy. For example, path divergences are small but consistent in all bins of V2, whereas accuracy is much greater in the first bin than in subsequent bins. It is possible that other, unaccounted-for behavioral variables may explain this discrepancy. In the first bin of V2, for example, the necessity of reaching the goal zone would have caused the rat’s paths to converge near the reward zone. Although path divergence would have been low, it is possible that heading or other variables were different as a function of sequential context. Comparison of context versus location as a determinant of activity The data show significant differences in firing rate between the sequential contexts along both V1 and V2. To place these differences in context, their magnitude was compared with that of firing rate differences induced by cue condition and location along the sequence. In toto, five difference scores were extracted from each cell examined, two for context related differences along V1 and V2, one for cued/noncued differences, one for between-segment differences, and a final one for within-segment differences. All comparisons were made on binned firing rates, in which five bins were used along every segment of the sequence. Although the details of z-score calculation are described in Materials and Methods, between- and withinsegment are explained briefly here. Between-segment z-scores represent the firing rate difference between the maximum bin and the same bin in the preceding segment. For example, suppose that a cell fired maximally in bin 3 of segment 3. This bin was then compared with bin 3 of segment 2. Within-segment z-scores, conversely, represent the difference in firing between the first and last bins within the segment with maximum firing. The withinsegment difference was meant to capture the observations that the firing rate of many cells increased on approach to goal zones, whereas others showed monotonically decreasing firing on departure from goal zones. Both effects lead to large within-segment firing rate differences. The distribution of the difference z-scores for each comparison is shown in Figure 8 A. It is apparent from these distributions that within-segment differences were the largest, followed closely by between-segment differences. The magnitude of contextrelated differences along V1 were much less than those for between- or within-segment comparisons. The context-related differences along V2 were, compared with those attributable to other effects, very small. Differences attributable to cue condition were virtually nonexistent. To enable easier comparison, the proportion of cells exceeding a z-score of 1 is plotted in Figure 8 B. From these data, it can be concluded that location within a segment or location within the sequence as a whole is a much stronger determinant of cell firing in the mPFC than sequential context.
Effect of recording depth on cellular responses Electrodes passed through at least two cytoarchitectonically distinct cortical areas, ACd and PL. Hence, it is important to consider whether there were any response differences between the two areas. No precise delineation of the two areas is possible, however, because there are no known physiological markers that would indicate traversal of the ACd/PL boundary, and postexperiment histology was not precise enough to allow localization of the electrodes to one area or the other. In lieu of this, the median difference z-score for context, between-segment, and within-segment comparisons was plotted as a function of recording depth (Fig. 9). Deep recording sites are more likely to be in the PL, whereas shallow sites are likely to be in the ACd or perhaps even frontal area 2 (Fig. 2). As can be seen, z-scores for betweenand within-segment differences dropped off dramatically with recording depth and, for rats 1 and 2, had slopes significantly different from zero (“within” regression, rat 1: slope of ⫺0.00025, df ⫽ 15, p ⬍ 0.01; “within” rat 2: slope of ⫺0.00039, df ⫽ 12, p ⬍ 0.001; “between” rat 1: slope of ⫺0.00015, df ⫽ 15, p ⬍ 0.01; “between” rat 2: slope of ⫺0.00029, df ⫽ 12, p ⬍ 0.001). Contextrelated differences along V1 also dropped off with depth, at approximately the same relative rate (i.e., compared with the corresponding mean) as for between- and within-segment differences (rat 1: slope of ⫺0.00013, df ⫽ 15, p ⬍ 0.001; rat 2: slope of ⫺0.00011, df ⫽ 12, p ⬍ 0.001; rat 3: not significant). Along V2, in contrast, there was no difference in the median z-score for context-related difference as a function of depth. The lack of a significant slope on V2 is probably attributable to the very low context-related firing rate differences observed along this segment. The lack of significant slopes for rat 3 is not surprising given that there are only three sessions from that rat; however, the trends for rat 3 are in the same direction as for rats 1 and 2. The V2 and rat 3 results aside, cells became generally less selective to location and context as recording depth increased.
Discussion Rats learned complex repeated-element sequences and performed the choice after the repeated subsequence with ⬎70% accuracy. Of primary interest was whether cellular activity in the mPFC during the repeated subsequence would be discriminative for sequential context. Approximately 36% of cells showed a statistically significant firing rate difference between the two contexts along the first repeated segment V1, and 9% showed differences along the second repeated segment V2; however, firing rate differences, when observed, were more quantitative than qualitative. If such differential activity was critical for resolving sequence ambiguities, the strength of the differential signal might be expected to increase during noncued trials, because rats were forced to perform the sequence from memory. Instead, firing rates were nearly identical during cued and noncued trials (Table 1). If the rat mPFC does play a role in repeated-element sequences, the context disambiguating signal is carried by a small proportion of the cells and is weakly spread over the population, because very few cells show strong context-related activity. The weakness of the context-discriminative signal is even more apparent when contrasted with mPFC selectivity for other behavioral variables. A comparison of firing rate differences, expressed as z-scores, showed that the rat’s position within a segment, and position within the sequence as a whole, were strong determinants of the firing rates of many cells (Fig. 8). In contrast, the proportion of cells showing
Euston and McNaughton • Sequence Encoding in Prefrontal Cortex
strong context-related firing rate differences was small, suggesting that mPFC population is, at best, marginally responsive to sequential context. Both single-cell (Fig. 5) and population vector measures (Fig. 7) indicated greater context-discriminative activity along V1 than V2. One could argue that traversal of the V1 segment and receipt of reward between V1 and V2 lead to interference (or decay), which weakened the context-disambiguation signal along V2. An alternative explanation is that the neural context-disambiguation signal reflects context-specific path differences, which were much greater along V1 than V2. Indeed, additional analysis showed that sessions with higher context-related path differences had higher proportions of context-discriminative cells (Fig. 6). These results show that the mPFC is exquisitely sensitive to subtle variations in behavior, attributable to either sensory afferents or motor efferents. They also raise the possibility that other context-specific behaviors too subtle to detect might account for the remainder of the context-related firing seen in the mPFC. In other words, context-related firing rate differences, rather than indicating mechanisms of sequential context encoding, may be nothing more than a reflection of context-related trajectory differences. The sensitivity of mPFC cells to slight behavioral changes has implications for the interpretation of previous experiments that purport to have found working memory-related activity in the rat mPFC. Working memory cells in the primate dorsolateral PFC are stimulus specific during delay periods (for review, see Fuster, 1997). Hence, they respond when one object is the subject of current working memory but not when a different item is selected. In rats, many mPFC neurons are responsive to phases of a task, with some cells selectively active during delay periods in working memory tasks (Sakurai and Sugimoto, 1986; Batuev et al., 1990; Chang et al., 2002; Baeg et al., 2003); however, the reported stimulus specificity of these cells can be reasonably questioned because, in most cases, the behavior during the delay period may have differed for the two available responses. For example, in the study by Batuev et al. (1990), a rat was positioned behind a Plexiglas panel, where it observed one of two cue lights (left/right) being illuminated. After the barrier was removed, the rat had to approach the cued location for reward. Some cells were selective to spatial location of the cue during the delay between cue illumination and barrier removal; however, it is quite possible (in fact likely) that rats oriented toward the cued location, thus creating a stimulus-linked behavior that could account for the observed responses. A similar explanation might account for the contextdependent mPFC activity reported by Baeg et al. (2003), who studied delayed spatial alternation on a figure-8 track. Approximately one-third of their cells showed context-discriminative activity along the repeated segment, which the authors take as support for the role of the mPFC in working memory. This corresponds closely with the 36% of differentiating cells observed in the present experiment along the first repeated segment; however, the present experiment added a second repeated segment, during which behavior was demonstrably more consistent and differentiating cells dropped to 9%. Although in both the present study and the study by Baeg et al. attempts were made to exclude trials with overt behavioral differences, covert differences may have persisted. If behavioral differences were completely controlled, the percentage of differentiating cells would presumably have dropped even further, perhaps approaching zero. The present task was originally designed to elicit delay-
J. Neurosci., December 20, 2006 • 26(51):13143–13155 • 13153
dependent activity in mPFC neurons, as expected based on previous studies implicating the mPFC in working memory (for review, see Kesner, 2000; Uylings et al., 2003). The lack of a strong context-discriminative signal in mPFC argues against its role in maintaining stimulus-specific information during delays. However, there are several differences between the present task and classic delay tasks (e.g., delayed non-match to sample or delayed spatial alternation). The continuous nature of the task, in particular, makes it possible that a timing mechanism may have accounted for performance, without the need for explicit storage of trajectory information. Thus, the present results do not definitively exclude a working memory role for mPFC. Conversely, the results are consistent with a growing body of evidence that casts doubt on the role of the mPFC in working memory. Preuss (1995) noted that many of the deficits on delay tasks after damage to the rat mPFC are transient. Furthermore, self-directed free foraging on an eight-arm maze is not impaired after focal PL lesions, despite the apparent need to maintain information over time (Seamans et al., 1995; Delatour and Gisquet-Verrier, 1996). Gisquet-Verrier and Delatour (2006) recently concluded that previous experiments demonstrating delay-dependent deficits in mPFC-lesioned rats were better explained by an inability to adjust to novel training protocols. Indeed, recent studies focus on the role of mPFC in switching tasks or the sensory modality on which a decision is based (Ragozzino et al., 1999, 2003; Birrell and Brown, 2000). Additional experiments using delay tasks that tightly control behavior will be needed to definitely test the working memory role of the mPFC. The functional distinction between ACd and PL regions of the mPFC is speculative despite clear cytoarchitectonic and connectional differences (for review, see Heidbreder and Groenewegen, 2003). Lesion studies suggest that ventral regions are more involved in working memory than dorsal regions. Lesions of PL lead to deficits in delayed alternation or delayed non-match to position (Aggleton et al., 1995; Delatour and Gisquet-Verrier, 1996; Chudasama and Muir, 1997; Dias and Aggleton, 2000). Parallel studies, performed after ACd lesions, fail to find deficits (Joel et al., 1997; Sanchez-Santed et al., 1997; Delatour and Gisquet-Verrier, 2001). Ragozzino et al. (1998) found that lesions of the PL/infralimbic cortex produced deficits in spatial working memory on a 12-arm maze, whereas lesions of the ACd did not. One might thus expect that ventral recordings (from the PL region) would show greater evidence of context differentiation than dorsal recordings. The present results fail to show this effect. The number of context-sensitive cells on the first repeated segment (V1) actually decreased with increasing recording depth (on V2, context-sensitive cells were too infrequent to observe a difference) (Fig. 9). Importantly, however, overall experience on the task covaried with depth. On some of the deeper sessions, the rat had ⬎100 d of practice on variants of the sequence task. Although anatomy seems the more likely explanation for response differences, experience remains an alternative. Although the pattern of responses from all rats was similar, there were notable differences. For example, the proportion of differentiating cells was markedly lower in rat 2 than rats 1 or 3 (Table 1). Electrode positions may account for some of these differences. Although electrodes overlapped in the central portion of the mPFC, electrodes in rat 2 covered more rostral parts of the mPFC than those in rats 1 or 3. Anatomical data show differences within the mPFC along the rostrocaudal axis (Gabbott et al., 2005). An alternative possibility is that between-rat differences are related to reward modality. Rat 2 was rewarded using
13154 • J. Neurosci., December 20, 2006 • 26(51):13143–13155
food, whereas rats 1 and 3 were run for stimulation. Differences in motivation levels attributable to differing rewards might have affected neural responses. The fact that repeated segments with higher path variability have a higher proportion of context-sensitive cells leaves little doubt that behavior is an important determinant of mPFC activity in rodents. The question, of course, is whether behavioral variability can account for all of the context-related activity in the present experiment. The finding that mPFC cells are, at best, weakly selective for context, while being highly selective to position, leads us to believe that context-related firing is simply a reflection of context-related behavioral differences and not a true context-discriminative signal.
References Aggleton JP, Neave N, Nagle S, Sahgal A (1995) A comparison of the effects of medial prefrontal, cingulate cortex, and cingulum bundle lesions on tests of spatial memory: evidence of a double dissociation between frontal and cingulum bundle contributions. J Neurosci 15:7270 –7281. Baeg EH, Kim YB, Huh K, Mook-Jung I, Kim HT, Jung MW (2003) Dynamics of population code for working memory in the prefrontal cortex. Neuron 40:177–188. Batuev AS, Kursina NP, Shutov AP (1990) Unit activity of the medial wall of the frontal cortex during delayed performance in rats. Behav Brain Res 41:95–102. Birrell JM, Brown VJ (2000) Medial frontal cortex mediates perceptual attentional set shifting in the rat. J Neurosci 20:4320 – 4324. Bower MR, Euston DR, McNaughton BL (2005) Sequential-contextdependent hippocampal activity is not necessary to learn sequences with repeated elements. J Neurosci 25:1313–1323. Chaillan FA, Marchetti E, Delfosse F, Roman FS, Soumireu-Mourat B (1997) Opposite effects depending on learning and memory demands in dorsomedial prefrontal cortex lesioned rats performing an olfactory task. Behav Brain Res 82:203–212. Chang JY, Janak PH, Woodward DJ (1998) Comparison of mesocorticolimbic neuronal responses during cocaine and heroin self-administration in freely moving rats. J Neurosci 18:3098 –3115. Chang JY, Chen L, Luo F, Shi LH, Woodward DJ (2002) Neuronal responses in the frontal cortico-basal ganglia system during delayed matching-tosample task: ensemble recording in freely moving rats. Exp Brain Res 142:67– 80. Chiba AA, Kesner RP, Reynolds AM (1994) Memory for spatial location as a function of temporal lag in rats: role of hippocampus and medial prefrontal cortex. Behav Neural Biol 61:123–131. Chiba AA, Kesner RP, Gibson CJ (1997) Memory for temporal order of new and familiar spatial location sequences: role of the medial prefrontal cortex. Learn Mem 4:311–317. Chudasama Y, Muir JL (1997) A behavioural analysis of the delayed nonmatching to position task: the effects of scopolamine, lesions of the fornix and of the prelimbic region on mediating behaviours by rats. Psychopharmacology (Berl) 134:73– 82. Delatour B, Gisquet-Verrier P (1996) Prelimbic cortex specific lesions disrupt delayed-variable response tasks in the rat. Behav Neurosci 110:1282–1298. Delatour B, Gisquet-Verrier P (2001) Involvement of the dorsal anterior cingulate cortex in temporal behavioral sequencing: subregional analysis of the medial prefrontal cortex in rat. Behav Brain Res 126:105–114. Dias R, Aggleton JP (2000) Effects of selective excitotoxic prefrontal lesions on acquisition of nonmatching- and matching-to-place in the T-maze in the rat: differential involvement of the prelimbic-infralimbic and anterior cingulate cortices in providing behavioural flexibility. Eur J Neurosci 12:4457– 4466. Dietrich A, Allen JD (1998) Functional dissociation of the prefrontal cortex and the hippocampus in timing behavior. Behav Neurosci 112:1043–1047. Fuster JM (1997) The prefrontal cortex: anatomy, physiology, and neuropsychology of the frontal lobe, Ed 3. Philadelphia: Lippincott-Raven. Fuster JM (2001) The prefrontal cortex—an update: time is of the essence. Neuron 30:319 –333. Gabbott PL, Warner TA, Jays PR, Salway P, Busby SJ (2005) Prefrontal cor-
Euston and McNaughton • Sequence Encoding in Prefrontal Cortex tex in the rat: projections to subcortical autonomic, motor, and limbic centers. J Comp Neurol 492:145–177. Gisquet-Verrier P, Delatour B (2006) The role of the rat prelimbic/infralimbic cortex in working memory: not involved in the short-term maintenance but in monitoring and processing functions. Neuroscience 141:585–596. Gomez Beldarrain M, Grafman J, Pascual-Leone A, Garcia-Monco JC (1999) Procedural learning is impaired in patients with prefrontal lesions. Neurology 52:1853–1860. Gomez Beldarrain M, Grafman J, Ruiz de Velasco I, Pascual-Leone A, GarciaMonco C (2002) Prefrontal lesions impair the implicit and explicit learning of sequences on visuomotor tasks. Exp Brain Res 142:529 –538. Gothard KM, Skaggs WE, Moore KM, McNaughton BL (1996) Binding of hippocampal CA1 neural activity to multiple reference frames in a landmark-based navigation task. J Neurosci 16:823– 835. Hebb DO (1949) The organization of behavior; a neuropsychological theory. New York: Wiley. Heidbreder CA, Groenewegen HJ (2003) The medial prefrontal cortex in the rat: evidence for a dorso-ventral distinction based upon functional and anatomical characteristics. Neurosci Biobehav Rev 27:555–579. Hok V, Save E, Lenck-Santini PP, Poucet B (2005) Coding for spatial goals in the prelimbic/infralimbic area of the rat frontal cortex. Proc Natl Acad Sci USA 102:4602– 4607. Honda M, Deiber M-P, Ibanez V, Pascual-Leone A, Zhuang P, Hallett M (1998) Dynamic cortical involvement in implicit and explicit motor sequence learning: a PET study. Brain 121:2159 –2173. Joel D, Weiner I, Feldon J (1997) Electrolytic lesions of the medial prefrontal cortex in rats disrupt performance on an analog of the Wisconsin Card Sorting Test, but do not disrupt latent inhibition: implications for animal models of schizophrenia. Behav Brain Res 85:187–201. Jung MW, Qin Y, McNaughton BL, Barnes CA (1998) Firing characteristics of deep layer neurons in prefrontal cortex in rats performing spatial working memory tasks. Cereb Cortex 8:437– 450. Kesner RP (2000) Subregional analysis of mnemonic functions of the prefrontal cortex in the rat. Psychobiology 28:219 –228. Kesner RP, Holbrook T (1987) Dissociation of item and order spatial memory in rats following medial prefrontal cortex lesions. Neuropsychologia 25:653– 664. Lashley KS (1951) The problem of serial order in behavior. In: Cerebral mechanisms in behavior (Jeffress LA, ed), pp 112–136. New York: Wiley. Liebman JM, Cooper SJ (1989) The neuropharmacological basis of reward. Oxford: Claredon. McNaughton BL, Barnes CA, O’Keefe J (1983) The contributions of position, direction, and velocity to single unit activity in the hippocampus of freely-moving rats. Exp Brain Res 52:41– 49. Minai AA, Barrows GL, Levy WB (1994) Disambiguation of pattern sequences with recurrent networks. In: World Congress on Neural Networks: Proceedings of the International Neural Network Society, Vol IV, pp 178 –181. Mahwah, NJ: Erlbaum. Mogensen J, Holm S (1994) The prefrontal cortex and variants of sequential behaviour indications of functional differentiation between subdivisions of the rat’s prefrontal cortex. Behav Brain Res 63:89 –100. Mulder AB, Nordquist R, Orgut O, Pennartz CM (2000) Plasticity of neuronal firing in deep layers of the medial prefrontal cortex in rats engaged in operant conditioning. Prog Brain Res 126:287–301. Olds J, Milner P (1954) Positive and reinforcement produced by electrical stimulation of septal and other regions of the rat brain. J Comp Physiol Psychol 47:419 – 427. Olds ME, Fobes JL (1981) The central basis of motivation: intracranial selfstimulation studies. Annu Rev Psychol 32:523–574. Olton DS (1989) Frontal cortex, timing and memory. Neuropsychologia 27:121–130. Pascual-Leone A, Wassermann EM, Grafman J, Hallett M (1996) The role of the dorsolateral prefrontal cortex in implicit procedural learning. Exp Brain Res 107:479 – 485. Paxinos G, Watson C (1997) The rat brain, Ed 3. San Diego: Academic. Pratt WE, Mizumori SJ (2001) Neurons in rat medial prefrontal cortex show anticipatory rate changes to predictable differential rewards in a spatial memory task. Behav Brain Res 123:165–183. Preuss TM (1995) Do rats have prefrontal cortex? The Rose-Woolsey-Akert program reconsidered. J Cogn Neurosci 7:1–24. Ragozzino ME, Adams S, Kesner RP (1998) Differential involvement of the
Euston and McNaughton • Sequence Encoding in Prefrontal Cortex dorsal anterior cingulate and prelimbic–infralimbic areas of the rodent prefrontal cortex in spatial working memory. Behav Neurosci 112:293–303. Ragozzino ME, Wilcox C, Raso M, Kesner RP (1999) Involvement of rodent prefrontal cortex subregions in strategy switching. Behav Neurosci 113:32– 41. Ragozzino ME, Kim J, Hassert D, Minniti N, Kiang C (2003) The contribution of the rat prelimbic-infralimbic areas to different forms of task switching. Behav Neurosci 117:1054 –1065. Sakurai Y, Sugimoto S (1986) Multiple unit activity of prefrontal cortex and dorsomedial thalamus during delayed go/no-go alternation in the rat. Behav Brain Res 20:295–301. Sanchez-Santed F, de Bruin JP, Heinsbroek RP, Verwer RW (1997) Spatial delayed alternation of rats in a T-maze: effects of neurotoxic lesions of the medial prefrontal cortex and of T-maze rotations. Behav Brain Res 84:73–79.
J. Neurosci., December 20, 2006 • 26(51):13143–13155 • 13155 Seamans JK, Floresco SB, Phillips AG (1995) Functional differences between the prelimbic and anterior cingulate regions of the rat prefrontal cortex. Behav Neurosci 109:1063–1073. Shimamura AP, Janowsky JS, Squire LR (1990) Memory for the temporal order of events in patients with frontal lobe lesions and amnesic patients. Neuropsychologia 28:803– 813. Takehara K, Kawahara S, Kirino Y (2003) Time-dependent reorganization of the brain components underlying memory retention in trace eyeblink conditioning. J Neurosci 23:9897–9905. Uylings HBM, Groenewegen HJ, Kolb B (2003) Do rats have a prefrontal cortex? Behav Brain Res 146:3–17. Wilson MA, McNaughton BL (1993) Dynamics of the hippocampal ensemble code for space. Science [Erratum (1994) 264:16] 261:1055–1058. Wilson MA, McNaughton BL (1994) Reactivation of hippocampal ensemble memories during sleep. Science 265:676 – 679.