In this study, data in bar charts were encoded using friction. ... senses are employed to present the information to people with impaired vision. Audio ... detection of edges (a fundamental component of contour following) is impeded by the .... Figure 2 shows the proportion of correct answers for each question under the three.
Application Based Assessment of Frictional Properties for Haptic Data Visualisation Steven Wall and Stephen Brewster Glasgow Interactive Systems Group Department of Computing Science University of Glasgow Glasgow G12 8QQ, UK. {steven, stephen} @dcs.gla.ac.uk www.dcs.gla.ac.uk/~steven, www.multivis.org
Abstract. Haptic devices can be used to present visualisations such as graphs and charts to the blind community. Many adopt a visually mediated method of presentation, whereby the haptic graphs are similar in form and structure to their visual counterparts. Exploration through point interaction force-feedback devices has been shown to be possible, but it is often cumbersome and slow. It may be possible to adopt a new method of encoding using more haptically salient properties. In this study, data in bar charts were encoded using friction. This was compared to standard (height-based) haptic bar chart representations using visually-impaired participants. Results showed that that performance using friction encoding was significantly worse than the standard bar charts.
1 Introduction Simple visualisation methods are frequently used in everyday life to display numerical data. Using a graph allows for rapid perception of distributions in large data sets that would be painstaking to analyse numerically. Lack of access to visual graphical information is a major hindrance for visually-impaired people wishing to pursue a career in numerical and scientific disciplines. Traditionally, alternative senses are employed to present the information to people with impaired vision. Audio descriptions of graphs using synthetic speech are very impoverished compared to their visual counterparts and do not allow for dynamic visualisation of changing data. Screen readers used with spreadsheet programs can become very memory intensive for large data sets. Heat raised paper can be used to create a tactile copy but they are subject to wear and tear and cannot represent dynamic data easily. Haptic devices potentially provide a richer method of interacting with digitally stored data. A blind person could edit and perceive data in real time, whilst working alongside sighted colleagues. Many of these devices have been designed with the desktop in mind (for example, the desktop PHANToM from Sensable Technologies). Some mouse type devices are small and discrete enough to pass as standard computer mice (the Wingman mouse from Logitech, or the Virtouch tactile mouse). Research is
2
Steven Wall and Stephen Brewster
therefore timely to address how best to present visualisations using haptic devices in the absence of visual information. In previous work a common method has been to use a haptic device to explore a direct analogy to a visual graph [6]. Thus, the user explores the shape of lines, height of bars or size of slices on a pie chart. Standard visual representations of graphs are designed with consideration of the spatially distributed nature of the visual sense. Detection of trends in the data and key features of the graph occurs almost instantaneously. Conversely, the haptic sense is very localised, particularly when mediated through a point interaction device such as the PHANToM. Spatially distributed stimulation on the fingertip is unavailable, therefore the user is forced to integrate temporally varying cues to construct a mental representation. Studies by Lederman and Klatzky [3] have found that in the absence of visual information, the point interaction nature of haptic devices greatly obviates the perception of shape and size. The most efficient manual Exploratory Procedure [2] for discerning this is to enclose the object in a grasp, which is unavailable through a single point of contact. A “contour following” style of exploration must therefore be adopted, however, the detection of edges (a fundamental component of contour following) is impeded by the lack of cutaneous sensation [4]. A number of object properties exist that are more easily encoded through haptic exploration. Klatzky, Lederman and Reed [1] showed that during a sorting task with real objects, subjects discriminated visually using size and shape cues, but when working haptically they relied on material cues, for example, texture and compliance. Exploration times for discerning material cues are more rapid than for structural cues under purely haptic exploration conditions, further, the perception of properties such as roughness and compliance is not greatly impeded by the use of an intermediary link such as a PHANToM stylus [4]. It may therefore be possible to create a haptic visualisation system that scales properties of the individual graph elements to features that are more salient under purely haptic exploration. Previous experiments have considered the ability of users to discriminate friction, stiffness and the spatial period of texture using a PHANToM [5]. Subjects were significantly better at discriminating friction cues than both other properties. Friction also had the largest exponent of perceived magnitude indicating a quicker growth for increasing actual magnitude out of all three properties. Hence, friction was the most easily discriminable property. The experiment described here is a more application based study. Our previous experiments have investigated blind peoples’ perception of haptic virtual bar charts. They adopted a direct analogy with the visual representation. The data value of bars was represented by their height. In this study we incorporated an extra friction based cue. Thus, the dynamic and static friction of the bar was also scaled to the data value. This was tested by comparing the performance between a standard haptic bar chart, a standard haptic bar chart augmented with friction cues, and finally a condition with purely frictional cues where the bar heights were identical. It was hypothesised that frictional cues would provide a more haptically based cue, and thus would reduce the time required to detect salient features of the graph.
Application Based Assessment of Haptic Data Visualisation
3
2. Experimental Procedure Twelve registered blind participants from the Royal National College for the Blind, Hereford (RNCB) took part. The subjects were all paid for their participation in the experiment. They had a varying degree of familiarity with bar charts; some had used visual graphs prior to losing their sight, whereas others had never had any contact with graphs prior to the experiment. A short introduction was provided introducing the concept of bar charts using standard raised paper graphs. Three groups of bar charts were developed, based on data obtained from the U.K. Department of Health’s Website. The data describe the statistics of use of the hospitals in England from 1987/88 to 1999/2000. Thirty graphs were collated and divided into three groups of ten. There were seven bars in each graph. Participants were presented with the first group in their first condition, the second group in the next condition and the third group in their final condition. The conditions, as described in the previous section were height cues only, friction cues only, and height and friction cues combined. The order of presentation was counterbalanced. Four questions were used for each graph, to assess if the participant had correctly perceived the information presented: (1) What is the overall trend of the data? (Forced choice between consistently increasing/decreasing, and inconsistently increasing /decreasing). (2)Which bar has the highest value? (3) Which bar has the lowest value? (4)Which two bars are the most similar in value? For question four the bars need not be adjacent and could be separated by other bars. Participants verbally indicated their answers whilst exploring the bar charts. Time taken to give all four answers was also recorded. In addition, the experimenter made notes of any comments or behaviours subjects employed, and afterwards conducted an informal interview and experimental debriefing with each participant.
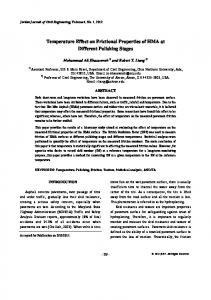
Fig. 1. A visual representation of the haptic bar charts used in the experiment. The virtual bar charts used were rendered using the Ghost SDK from Sensable Technologies [7]. The bars were located on the back wall of the workspace facing the
4
Steven Wall and Stephen Brewster
user, as opposed to on the “floor” of the virtual environment, as with traditional raised paper graphs on a desk or table. A graphical representation of this is illustrated in Figure 1. The bars are constructed out of polygons that form a V-shaped cross-section to retain the PHANToM pointer within the line [6]. The varying frictions were created by setting both the dynamic and static friction properties of the bar to a value scaled to the corresponding data, using the standard GHOST SDK routines for friction rendering. The values for friction were calculated by fixing the highest data value at a friction value of 1.0, the lowest at 0.0 and scaling the values in between proportionally. The user could click the PHANToM stylus switch while in a bar to have the number of the bar (numbered 1 to 7, from left to right) read out in synthetic speech.
3. Quantitative Results and Discussion
P (correct answer)
Figure 2 shows the proportion of correct answers for each question under the three different stimulus conditions. Subjects proved to be competent at answering the first three questions when height cues were available in the bar charts. Performance was worse when subjects’ were forced to rely on frictional cues only. 1 0.9 0.8 0.7 0.6 0.5 0.4 0.3 0.2 0.1 0
Trend Largest Smallest Similar
Height
Friction
Friction & Height
Stimulus Type
Fig. 2. Proportion of correct responses illustrated by question and stimulus type, with standard deviation. Taking the mean proportion of correct answers over all questions for each stimulus condition, friction had the worst overall performance ( P(correct answer) = 0.546), whereas height ( P(Correct answer) = 0.727) and friction and height ( P(Correct answer) = 0.71) are very similar in performance. With an ANOVA, the effect of stimuli proved to be highly significant ( F(2, 35) = 17.05, P< 0.001). Post-hoc Tukey tests revealed that the height condition was significantly different from friction ( T = 5.2, P = 0.0001) but not from friction and height (T = 0.486, P = 0.8787). Friction was also significantly different from friction and height (T = 4.797, P = 0.0003).
Application Based Assessment of Haptic Data Visualisation
5
The different stimulus conditions were also analysed for time taken for subjects to answer all four questions,. Friction had the highest overall mean time ( T = 139.7s) while performance for height (T = 124.2s) and friction and height (T = 125.6s) was comparable. However, there were no statistical effects (F(2, 35) = 1.26, P = 0.302). Question four proved to be the most difficult, which could be due to the number of stimulus comparisons necessary to answer. In order to answer questions one to three, the best strategy would be to sequentially compare pairs of bars. However, to answer question four the search space consists of pairs of stimuli. There are 21 pairs, therefore an exhaustive search is not possible due to time and memory demands, and some degree of estimation and extrapolation must be expected and hence, a greater capacity for error. The results show that the friction cues alone were significantly worse than either of the conditions with height. However, there was no significant difference in the time taken to answer the questions. While previous experiments have shown that it is possible for PHANToM users to compare a small number of stimuli, and that frictional properties are likely constitute a continuum, it appears difficult for the participants in this investigation to analyse higher numbers and multiple combinations of stimuli. It is possible that some stimuli fell below the just noticeable difference thresholds, making comparisons difficult.
4. Qualitative Results During the experiment it became evident that visually impaired users often have related special needs that may make devices such as the PHANToM inappropriate. For example, diabetes is a major cause of blindness that can impair tactile sensitivity and cause hand tremors. Several subjects also suffered from arthritis and found the pen interface tiring to grasp. They commented that a thicker handle that could be used with a power grasp would be better. The thimble attachment may also be more appropriate, but was not tested. A few subjects frequently applied too much force, causing the PHANToM to over-heat despite verbal advice from the experimenter. This may be a result of decreased tactile sensitivity on part of the subjects. Subjects found the delays caused by over-heating very disruptive and became worried that they may damage the device, which may have impaired performance. Vibration and noise from the device due to device instabilities annoyed some subjects, but others found this helpful as it provided impromptu audio feedback that the device may crash. A more rigorously implemented speech or non-speech audio warning to the user to apply less pressure may aid in preventing frustration through device overheating. While very few subjects expressed a preference for the frictional cues, several found it beneficial to confirm height estimates. Some found the use of redundant cues confusing or contradictory, and this is reflected in the overall performance being less accurate than height alone. Friction cues may have a second unrelated use in that they helped some of the subjects with tremors, weak wrists or other motor instabilities to
6
Steven Wall and Stephen Brewster
retain contact with a bar. In addition, one of the subjects with weaker wrists preferred the friction cues, as less motion was necessary in order to obtain an estimate of the value of the bar. Despite this, others found them irritating, as they required more force to move laterally along the bar. It would therefore be beneficial to allow users a choice as to whether to employ friction in the bar charts. Possible selections could be no friction, scaled friction or high friction (for user stability purposes, as described above) depending on personal preference.
5 Conclusions The results suggest that the technique of scaling the frictional properties of elements in a bar chart was not as successful as an analogy to traditional visual graphs, in which data values are scaled to height. Previous results have shown that users are able to compare values of friction and successfully order them on a magnitude scale. However, these comparisons were only made with a small set of values (two or three stimuli). Conversely, the graphs presented in this experiment contained seven distinct stimuli that had to be successfully compared to answer the questions pertaining to the data. Moreover, for finding the two closest values of data, pairs of stimuli were compared, giving a greater number of variables. However, although the novel use of friction cues offered poorer performance, the results were statistically significant and therefore valuable for other researchers in the field considering this approach. It should also be noted that these results may be specific to the haptic device used and rendering methods employed for the purposes of the study and should therefore be generalised further with caution.
6 References 1. Klatzky, R.L., Lederman, S.J., and Reed, C., There's More to Touch Than Meets the Eye: The Salience of Object Attributes for Haptics with and without Vision. Journal of Experimental Psychology. Vol. 116 (1987) pp. 356-369. 2. Lederman, S.J. and Klatzky, R.L., Hand Movements: A Window in to Haptic Object Recognition. Cognitive Psychology. Vol. 19 (1987) pp. 342-368. 3. Lederman, S.J. and Klatzky, R.L.: Designing Haptic Interfaces for Teleoperational and Virtual Environments: Should Spatially Distributed Forces Be Displayed to the Fingertip?, ASME Dynamic Systems and Control Division, Symposium on Haptic Interfaces, (1997) 4. Lederman, S.J. and Klatzky, R.L., Sensing and Displaying Spatially Distributed Fingertip Forces in Haptic Interfaces for Teleoperator and Virtual Environment Systems. Presence. Vol. 8 (1999) pp. 86-103. 5. Wall, S. and Brewster, S.: Scratching the Surface: Preliminary Investigations of Haptic Properties for Data Representation, Eurohaptics, Dublin, Ireland (2003) pp. 330-342 6. Yu, W., Ramloll, R., and Brewster, S., Haptic Graphs for Blind Computer Users, in Haptic Human-Computer Interaction, Brewster, S. and Murray-Smith, R., Editors. 2001, Springer LNCS: Berlin. p. 41-51. 7. Yu, W., Reid, D., and Brewster, S.A.: Multimodal Virtual Reality Versus Printed Medium in Visualization for Blind People, In Proceedings of ACM ASSETS, Edinburgh, Scotland, (2002) pp. 57-64