Application of a GA/Bayesian Filter-Wrapper Feature Selection Method to Classification of Clinical Depression from Speech Data Juan Torres1, Ashraf Saad2, Elliot Moore1 1 School of Electrical and Computer Engineering Georgia Institute of Technology, Savannah, GA 31407, USA.
[email protected],
[email protected] 2 Computer Science Department, School of Computing Armstrong Atlantic State University, Savannah, GA 31419, USA.
[email protected]
Abstract. This paper builds on previous work in which a feature selection method based on Genetic Programming (GP) was applied to a database containing a very large set of features that were extracted from the speech of clinically depressed patients and control subjects, with the goal of finding a small set of highly discriminating features. Here, we report improved results that were obtained by applying a technique that constructs clusters of correlated features and a Genetic Algorithm (GA) search that seeks to find the set of clusters that maximizes classification accuracy. While the final feature sets are considerably larger than those previously obtained using the GP approach, the classification performance is much improved in terms of both sensitivity and specificity. The introduction of a modified fitness function that slightly favors smaller feature sets resulted in further reduction of the feature set size without any loss in classification performance.
1. Introduction In previous work [1], we addressed the problem of selecting discriminating features for the detection of clinical depression from a very large feature set (300-1200 features) that was extracted from a speech database of clinically depressed patients and non-depressed control subjects. The approach taken in [1] was based on Genetic Programming (GP) and consisted of measuring the selection frequency of each feature in the final classifier trees over a large number of GP training episodes. While it was found that a handful of features were selected more frequently than most, the average classification accuracy of the final GP classifiers was not very high (77.4%). However, a naïve Gaussian Mixture Model (GMM) based classifier using the 16 most frequently selected features from the GP algorithm yielded significant improvements (88.8% accuracy, on average), while a simpler naïve Bayesian classifier with a Gaussian assumption performed almost as well as the GMM (88.7% average accuracy). One of the limitations of the previous feature selection approach is that
features were ranked individually. That is, there was no regard for dependency or redundancy between groups of features. In this paper, classification performance is further improved by applying a two-stage Genetic Algorithm (GA) based feature selection approach that takes the correlation between features into account.
2. Speech Database The features used in this paper were obtained from a database populated with the speech data of 18 patients (9 male, 9 female) with no history of mental disorders, and 15 patients (6 male, 9 female) who were undergoing treatment for a depressive disorder at the time of the study [2]. The speech corpus for each speaker consisted of a single recording session of the speaker reading a short story. The 65 sentences contained in the corpus were stored individually. Male and female speech samples were analyzed separately, meaning that the database is intended for training genderspecific, binary decision classifiers. A set of raw features were extracted from each voiced speech frame (approximately 25-30ms in duration). For each gender, two separate observation groupings were considered. The first grouping (G1) divided the corpus into 13 observations of 5 sentences each while the second grouping (G2) divided the corpus into 5 observations of 13 sentences each. A set of statistical measures was computed for each feature across each sentence. The resulting sentence-level statistics were then subjected to the same set of statistical measures, this time across all sentences in an observation. The procedure resulted in a large vector of observation feature statistics (OFS). The reader is referred to [1-3] for a detailed description of the features contained in the database and their corresponding extraction algorithms. In this paper, we work with the second observational grouping in the database (G2), which contains 75 and 90 observations for the male and female experiments, respectively. The male and female feature sets contain, respectively, 298 and 857 features.
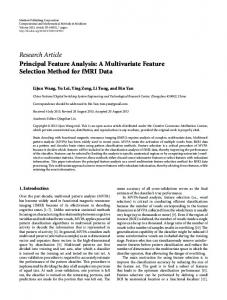
3. Feature Clustering The feature selection method under consideration was first proposed in [4] and is designed to exploit correlation in the feature space. It consists of an initial ‘filter’ in which correlated features are grouped into clusters, followed by two stages of a GAbased wrapper scheme. The initial filtering stage produces clusters that contain groups of features which are highly correlated. The correlation matrices for male and female speech (Fig. 1) show that there is significant correlation between pairs of features in both cases. Correlated feature groups are identified through hierarchical agglomerative clustering with complete linkage [5], which proceeds as follows: The distance between pairs of features is given as 1 – cij, where cij is the correlation coefficient between features i and j. Initially every feature is assigned to its own cluster, and the two closest clusters are merged at each stage of the algorithm. In the
complete linkage rule, which tends to produce compact clusters, the distance between two clusters Dx and Dy is given as: d ( Dx , D y ) = max (1 − cij ) .
(1)
i∈Dx j∈D y
That is, the distance between two clusters equals the distance between its two most distant members. Males
50 100 150 200 0.8
Feature Index
250
0.6 50
100
150
200
250 0.4
Females 100
0.2
200 300 400 500 600 700 800 100
200
300
400
500
600
700
800
Feature Index
Fig. 1. Correlation Matrices
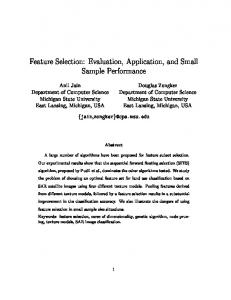
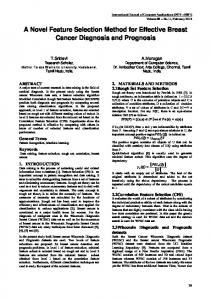
Clusters continue to be merged until the maximum distance between members of a cluster reaches a particular threshold. Therefore, this threshold controls the minimum correlation that is allowed between features in the same cluster. The number of clusters versus the value of this threshold is shown in Figure 2. Because each cluster will be represented by a single feature in the first stage of GA (Sect. 4), it is necessary for all features in a cluster to be similar. Following the recommendation in [4], the threshold was set to cij = 0.8, which yielded 127 clusters for males and 282 for females. Figure 3 shows the size of each cluster obtained from the male speech data. Once the clusters are obtained, the feature closest to each cluster center (i.e., mean) is chosen as its representative feature. It should be noted that the final result
will contain many clusters of size 1, which represent features having a correlation coefficient of less than 0.8 with respect to every other feature in the dataset.
Males 300
250
Number of Clusters
200
150
100
50
0
0
0.1
0.2
0.3
0.4
0.5
0.6
0.7
0.8
0.9
1
Minimum Inter-Cluster Correlation
Fig. 2. Threshold Value vs. Number of Clusters
Males
20
Cluster Size
15
10
5
0
20
40
60
80
Cluster Index
Fig. 3. Cluster Sizes
100
120
4. Two-Stage Feature Selection Upon completion of the initial filtering step, we then proceed with the first stage of GA, in which the feature subspace to be searched consists of a single representative feature for each cluster. The goal of this stage is to find the cluster subset that maximizes classification accuracy. In this stage, the GA chromosome of an individual consists of a binary vector equal in length to the number of feature clusters. This vector forms a bit-mask that determines which feature clusters are to be used for classification. The fitness function suggested in [4] consists of the classification accuracy as determined by the classifier of choice. In this paper, we propose a fitness function that slightly penalizes larger feature sets:
(2)
f = Accuracy – 0.01(n/N) ,
where n is the dimensionality (i.e., the number of clusters) of the feature subset under consideration, N is the dimensionality of the entire feature space, and Accuracy is defined in the interval [0, 1]. Thus, the penalty given to larger subsets is equivalent to at most 1% classification accuracy. Because the penalty is so small, the algorithm is still focused on maximizing classification accuracy, but when presented with several feature subsets that yield nearly identical classification accuracy, preference will be given to the smallest subset. Once an optimal set of feature clusters is found, we proceed into the second GA stage, in which these clusters are opened and a search is performed to find the optimal representative feature for each cluster. In this stage, the GA chromosome consists of an integer vector whose size is equal to the number of clusters selected in stage 1. Each entry in the vector is a feature index into a particular cluster. Both stages share the same evolutionary rules. The initial population is randomly chosen from a uniform distribution on the entire chromosome space. During reproduction, elitism is used to ensure that the best candidate from each generation is copied to the next. Then, two-point crossover is performed on a given fraction of the population. Parents for the crossover operation are chosen by tournament selection. Population members not chosen by elitism or for crossover are mutated uniformly with a fixed probability. Evolution stops after a fixed number of generations. The complete list of parameters that were used is given in Table 1. Table 1. GA Parameters
Parameter Crossover fraction Mutation fraction Mutation probability Population Size Tournament Size Number of Generations
Value 0.80 0.20 0.1 1000 10 10
Table 2. Classification Performance
Method Gender Accuracy Sensitivity Specificity Selected features % of feature space
Naïve Bayes Using GPFS Features M 89.3 93.3 86.7 16 5.4
F 91.1 95.6 86.7 16 1.9
Two-Stage GA Original Fitness Function M F 97.3 95.6 100.0 97.8 95.6 93.3 43 122 14.4 14.2
Two-Stage GA new Fitness Function M 97.3 100.0 95.6 34 11.4
F 95.6 97.8 93.3 89 10.4
Because of the small number of observations in the database, classification performance is evaluated using the leave-one-out cross-validation technique. Initially, the intention was to use a GMM for classification because of its ability to approximate arbitrary likelihood functions (given enough mixtures). However, GMM training proved to be too computationally intensive to be used within the wrapper scheme, since an entire cross-validation run must be performed for each individual in the GA population in every generation. In addition, the limited amount of available training data restricted the number of mixtures we could use. A naïve Bayesian classifier with a Gaussian assumption on the likelihood functions was shown in [1] to perform comparably to GMM on our speech database, and was chosen here for its computational simplicity. Moreover, because the initial clustering stage essentially filters-out the most correlated features, the naïve Gaussian classifier turns out to be a good match to the GA search stages. Although uncorrelated features from arbitrary probability distributions are not necessarily independent, the equivalence between correlation and dependence does hold for Gaussian distributions. Thus, while the Gaussian assumption limits the classifier’s ability to model features that are not normally distributed, the initial filtering step reduces the penalty associated with the naïve assumption when the Gaussian assumption is correct.
5.
Results
Performance was evaluated in terms of classification accuracy, sensitivity (true positive rate), and specificity (false negative rate). We performed 10 runs of GA for each experiment. The results of the best run, given in Table 2, show a significant improvement over the previous GP-based feature selection approach, especially for the male subjects. Furthermore, the use of (1) as a fitness function resulted in a significant reduction of feature set size without any loss in classification performance. Another interesting result is that the second GA stage did not find better solutions than those found during the first stage. This suggests that it may be advantageous to use a lower threshold during clustering in order to reduce the number of clusters at the expense of larger feature variability within clusters. The reduction in the number of
available clusters for the first GA stage may in turn lead to further reduction in the number of features in the final solution.
6. Discussion and Future Work The work described in the previous sections has resulted in a large improvement in classification accuracy relative to the work in [1]. However, the number of selected features is rather high in relation to the number of observations in the dataset. While decreasing the clustering threshold in the initial filtering step could possibly reduce the number of features in the final GA solutions, it would also result in the clustering of features that are not as significantly correlated, which would prevent some potentially effective combinations of features from being considered during the 2stage GA procedure. One way to get around this issue would be to integrate the correlation filter into the GA via modified reproduction operators. In addition, correlation is a rather limited measure of redundancy between features, since it only considers pairs of features and does not necessarily imply independence between them. Therefore, it may be beneficial to use instead a more general measure of redundancy between features, such as Joint Mutual Information [6]. Finally, work in [7] has shown that it is possible to train a Self-Organizing Map (SOM) on the GA chromosomes to obtain an approximate 2-D representation of the feature space. The map can then be used to guide the GA search into unexplored regions, thereby increasing the chance of convergence to a global minimum. We have succeeded in applying a hybrid GA and Bayesian approach to the feature selection problem in a difficult domain. By judicious choice of a fitness function for the first GA stage, we were able to improve classification performance while simultaneously reducing the size of the feature subset. The resulting feature subsets, although larger than those obtained using the GP-based approach reported in [1], provide excellent classification performance. The current GA search and Bayesian classifier implementation serve as a solid baseline for future investigation into finding useful features to diagnose clinical depression from speech.
References 1. J. Torres, A. Saad, E. Moore, Evaluation of Objective Features for Classification of Clinical Depression in Speech by Genetic Programming. Accepted for publication: 11th Online World Conference on Soft Computing in Industrial Applications, 2006. 2. E. Moore, M. Clements, J. Peifer, and L. Weisser, Comparing objective feature statistics of speech for classifying clinical depression. In Proceedings of the 26th Annual Conf. on Eng. in Medicine and Biology, pages 17-20, San Francisco, CA, 2004. 3. E. Moore, M. Clements, J. Peifer, and L. Weisser, Analysis of prosodic variation in speech for clinical depression. In Proceedings of the 25th Annual Conf. on Eng. in Medicine and Biology, pages 2849-2852, Cancun, Mexico, 2003. 4. G. Van Dijck, M. Van Hulle, M. Wevers, Genetic Algorithm for Feature Subset Selection with Exploitation of Feature Correlations from Continuous Wavelet Transform: a real-case Application. In Proceedings of the International Conference on Computational Intelligence, pages 34-38, Istanbul, Turkey, 2004.
5. R. Duda, P. Hart, and D. Stork, Pattern Classification. Wiley, New York, 2001. 6. G. Tourassi, E. Frederick, M. Markey, and C. Floyd, Application of the mutual information criterion for feature selection in computer-aided diagnosis. Medical Physics, 28(12):23942402, 2001. 7. H. B. Amor and A. Rettinger, Intelligent exploration for genetic algorithms: using selforganizing maps in evolutionary computation. In Proceedings of the 2005 Conference on Genetic and Evolutionary Computation (GECCO), pages 1531-1538, Washinton D.C, 2005.