Journal of Chromatographic Science, Vol. 42, May/June 2004
Application of Curve Fitting in Thin-Layer Chromatography–Flame Ionization Detection Analysis of the Carbohydrate Fraction in Marine Mucilage and Marine Snow Samples from Italian Seas Mauro Mecozzi1,* and Zsuzsa Pápai2 1Central
Institute for the Scientific Marine Research, Via di Casalotti 300, 00166 Rome, Italy and 2Department of Analytical Chemistry, University of Veszprém, P.O. Box 158, Veszprém, H-8201 Hungary
Abstract This paper presents a thin-layer chromatographic–flame ionization detection (TLC–FID) procedure to characterize the carbohydrate fraction of marine mucilage and marine snow samples from the Italian Seas. The identification of the different carbohydrate subfractions is supported by the application of a deconvolution procedure based on a new mathematical function for describing chromatographic peaks and enhancing their resolution. The joint- approach TLC–FID analysis and deconvolution procedure allows for the characterization of the carbohydrate fraction of the marine samples in a single step without using the different derivatization procedures requested by the most common gas chromatography and high-performance liquid chromatographic methods for carbohydrate analysis. In fact, the results obtained by the TLC–FID procedure show that different neutral, uronic acid, and aminosugar subfractions can be present simultaneously in these samples. Moreover, the results support some hypotheses about the causes of the presence of mucilages in the Italian Seas.
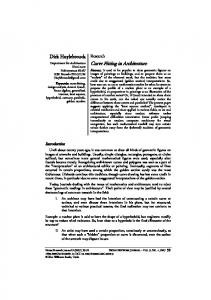
Introduction Several aggregates of organic matter, suspended and floating along the water column, are often present during spring and summer seasons in the Italian Seas. These aggregates are diff e rent for dimension and form; the aggregates with dimension lower than 1 cm are called marine snow, and the aggregates having different forms such as flocs, strings, clouds, and scums with dimensions varying from some centimeters to several hundred meters are called mucilage (1,2) (Figure 1 shows an example of these aggregates). In the mucilage events of these last years observed in the Adriatic and Tyrrhenian Seas, this phenomenon caused serious damage to tourism and fishery industries, and, as a consequence, several studies have been * Author to whom corresondence should be addressed: email
[email protected].
268
supported to clarify the causes of the mucilage presence. Some studies have shown that carbohydrates are a relevant fraction of the chemical composition of mucilages (3), which are fundamentally exudates of marine phytoplankton (4), but re a l comprehension of the pathways involved in their formation requires the elucidation of their chemical stru c t u re. With this aim, in the previous years a colorimetric method was developed to analyze total carbohydrates (5) and a thin-layer chromatographic (TLC)–flame ionization detection (FID) method to analyze the lipid fractions of these samples (6). In particular, some studies have shown that the carbohydrate fraction has a fundamental role in the aggregation characteristics of the marine organic matter (7,8). The full characterization of this fraction and the comprehension of the possible pathways of their formation are of obvious importance. For the d e t e rminations of monosaccharides in environmental samples, gas chromatographic (GC) and high-performance liquid chromatographic (HPLC) methods are often preferred to TLC methods, although the scientific literature re p o rts interesting TLC pro c e d u res to analyze carbohydrates in different matrices. Cellulose layers are reported for analyzing carbohydrates (9), yet some applications of silica gel layers are reported in food analysis (10). Whatman K6 plates were used for carbohydrates analysis by derivatization as alditols and alkaline AgNO3 dipping detection (11) and methylation with densitometric detection (12). Several high-performance thin-layer chromatographic (HPTLC) methods have also been re p o rted. HPTLC-quality silica gels and N-(1-napthyl)ethylenediamine-sulfuric acid reagent have been proposed for determining the sugar composition of food gum polysaccharides (13); amino-bonded HPTLC plates have been used for the analysis of monosaccharide mixtures (14) and fructoolisaccharides (15). The use of TLC–FID for carbohydrate analysis is not very common because it is generally restricted to the analysis of samples with a simple sugar composition (16) and to the study of the products of enzymatic hydrolysis of chi-
Reproduction (photocopying) of editorial content of this journal is prohibited without publisher’s permission.
Journal of Chromatographic Science, Vol. 42, May/June 2004
toolisaccahrides (17). This depends mainly on the chromatographic behavior of most sugars whose polar hydroxyl groups have strong adsorption bonds with the silica gel of Chromarods and the large number of positional isomers that produce individual broad bands and consequent overlapping peaks (16). However a TLC–FID approach for carbohydrate analysis can be an alternative pro c e d u re to the GC analysis of neutral and uronic carbohydrates (18) and aminosugars (19), which are methods requiring the chemical derivatization of sugars. This paper describes a TLC–FID procedure to identify the contribution of the neutral, uronic acid, and amino sugar subfractions present in marine snow and mucilage samples of Italian Seas.
Mucilage pretreatment
All the samples were dialyzed by a Spectrum 1000 dialysis membrane (Houston, TX) and lyophilized prior to any analysis. Samples were stored in dark glass containers. Equipment
Planar chromatographic analysis was perf o rmed using a TLC Iatroscan MARK V equipped with a flame ionization detector (NTS, Rome, Italy) and connected to a PC for the acquisition of chromatograms as ASCII files. Colorimetric measurements were perf o rmed using a PerkinElmer Lambda 40 UV–vis spectro p h o t o m e t e r (PerkinElmer, Norwalk, CT) connected to a PC for the acquisition of chromatograms as ASCII files. TLC–FID analysis of marine mucilage and snow samples
Experimental Sampling
Mucilage samples were taken from the Ty rrhenian Sea in different places. Some mucilages were sampled along the coasts of Elba Island (Central Italy) between 1999 and 2001 and the coasts of Giglio Island (Central Italy) in summer 1999. Other mucilages were sampled along the coasts of the countries C i rceo, Scario, and Procida (South Italy) on October 2000. Marine snow samples, Porto Turistico 02, Riovivo 02, and Casaccia 02 were collected along the coasts of Elba Island (Ty rrhenian Sea, Central Italy) in May 2002. All of the samples were stored frozen at –20°C until beginning the chemical analysis.
Each lyophilized sample (100–300 mg) was added to 5.0 mL 1M HCl and placed in an oven bath at 100°C for 2.5–3 h. After cooling, the supernatant was separated by centrifugation. The acid solution (1 µL) was spotted at the origin of the Chromarod S II silica gel 5 µm, using a microliter syringe. The development of the rod to resolve the qualitative carbohydrate fraction was p e rf o rmed by an elution phase consisting of acetonitrile–ethyl acetate–isopropyl alcohol at 82.5:10:7.5 (v/v), respectively. When the elution phase covered the 70% of the total length of the rod, it was dried in an oven at 65°C. The development was repeated t h ree times. The constant humidity was reached by placing a saturated NaCl solution in the elution tank (16). Standard solutions containing neutral uronic and amino sugars simultaneously and including also myoinositol as internal standard were used for the identification and estimation of the different carbohydrate subfraction and for the estimation of total carbohydrate amount. The diff e rences between the Rf value of the internal standard and the Rf value of the peaks was used for the identification of the monosaccharides. R e g ression curves having correlation coefficients within 0.992 and 0.997 were obtained for all of the monosaccharides tested. By means of the described procedure and operating on a 300mg sample, a detection limit ranging between 2.5% and 3% (w/w) can be obtained for the analysis of total carbohydrate amount. Application of the fitting procedure to the TLC–FID chromatograms for the identification of neutral uronic acid and amino sugars subfractions
Figure 1. Mucilage aggregates observed in Adriatic Sea in summer 1997. The length of each sample was approximately 15 cm.
As most TLC–FID chromatograms show overlapped peaks, a deconvolution procedure is necessary to enhance the peak resolution in order to improve the identification and the quantitative estimation of carbohydrates. The deconvolution of chromatographic peaks is based on the use of mathematical functions (i.e., Gaussian, log-normal, Gamma, Weibull, and modified Gaussian functions), which describe the peak shape (20). One of the most used functions is the exponentially modified Gaussian function (EMG), which is the result of the convolution of a Gaussian function and an exponential decay function: y(t) = h(t)*f(t)
Eq. 1
269
Journal of Chromatographic Science, Vol. 42, May/June 2004
w h e re y(t) is the convoluted function describing the chromatographic peak, h(t) is the function describing a pure Gaussian peak, and f(t) is the exponential decay function: h(t) = hmax exp{– (t – tR) 2/2σ2} f(t) =
Γ –1
exp{–t/Γ}
Eq. 2 Eq. 3
where hmax is the maximum peak height, tR is the retention time, t is the time, σ is the standard deviation, and Γ is a constant that quantitates the decay time of the system. The EMG model has been submitted in different studies in order to improve its efficiency in describing chromatographic peaks; Torres-Lapasió (21) has proposed a mathematical function of the EMG peaks in which the standard deviation of a pure Gaussian peak is replaced by the use of a polynomial function according to: h(t) = hmax exp –(1/2)*([t – tR ] / [σ0 + σ1(t – tR) + σ2 (t – tR)2 + ……])2
Eq. 4
and showing that the results obtained by the proposed models a re even better than those obtained by the EMG model in resolving binary and ternary mixtures of compounds having overlapped peaks. Economou et al. (22) have applied fast Fourier and Hartley transforms for the deconvolution of EMG peaks showing the aspects of resolution enhancement, linearity, background correction, and data distortion on Gaussian peaks. However, in spite of the wide use of the EMG model, it also has some disadvantages related to the estimation of σ and Γ because their accuracy is influenced by the asymmetry of the peaks (20,23), and new deconvolution procedures have been proposed to solve the problems arising from the use of the EMG model. As far as the use of deconvolution pro c e d u re in planar chromatography, it is necessary to specify that TLC peaks have to be described by binomial distributions, whereas GC and HPLC peaks are Gaussian-type shape. However, there is usually a negligible diff e rences between models (24) so that the deconvolution pro c e d u res applied in gas and liquid chromatography can be applied to TLC peaks as well. Here we used a deconvolution procedure presented in a pre v i o u s work (23) to improve the identification of the carbohydrate subfractions present in the aggregate samples of marine o rganic matter such as mucilages and marine snow. This procedure is based on studies related to the possibility of describing chromatographic peaks by mathematical function, and this approach has become a universal method for the characterization of peak shapes. Using curve fitting, the evaluation of chromatographic signals can be achieved successfully. In this case it is important to find the best mathematical function that corresponds perfectly to the digitized signal. An important application of the curve fitting re p resents the resolution of overlapped peaks; and in this work, a mathematical function is applied auspiciously for curve fitting, for which the function is presented for describing symmetrical and asymmetrical (tailing) peaks. The function
270
contains four parameters, and its mathematical form in Rf domain is as follows:
f(Rf) =
{
D(4 – a 2) if Rf < M – _________ 2a
O, H.exp
{( ) [ ( 4 __ –1 a2
•
ln 1 +
)
2a(Rf – M) – 2a(Rf – M) D(4 – a2) D(4 – a2)
]}
Eq. 5
where M is the location of the peak maximum, H is the peak height (H > 0), a is an asymmetry factor (0 < a < 2), and D is the standard deviation (D > 0). For curve fitting, the leasts q u a res method was used. It is necessary to know the initial values of the parameters as pre l i m i n a ry information for the accurate fitting of the single and overlapped peaks. In case of symmetrical peaks, it is sufficient to know the peak maximum positions and the approximate values of the peak heights from the digital chromatogram and to start fro m these values. If the peak shape is asymmetrical, the pre v i o u s information means the relatively exact knowledge of some other parameters (a, D). In case of overlapped peaks, the number of the parameters increases as a function of the number of fitted peaks. The fitted curve is suitable for a quick acquisition of chromatographic information, noise filtering, and baseline correction. The last operation can be carr i e d out by adding a linear or quadratic term to equation 5. The nonlinear least-squares fitting was executed by the Gnuplot software (MS-Windows 32 bit version 3.7) (University of Northern Iowa, Cedar Falls, IA), which is fast (5–10 s/fit) and available on the Internet (http://www.gnuplot.info). The peak a reas were calculated using MATLAB (MathWorks, Natlick, MA) version 5.2. and Pascal programs. The accuracy of the p ro c e d u re can be easily tested by comparing the peak shape of deconvolved peak with the corresponding peak of the stand a rd solution. Colorimetric determination of total carbohydrate amounts
The colorimetric determination of total carbohydrates (25) was perf o rmed with the aim to validate the TLC–FID procedure for some samples, which showed a negligible amount of carbohydrates. The mucilage samples were hydrolyzed by adding 25 mL of 1M HCl to 20.0 ± 0.1 mg of lyophilized mucilage and placed in a water bath for 2.5–3 h at 100°C. After cooling and centrifugation, 2.0 mL of the acid solution was added to 2.0 mL of 5% (w/w) water solution of phenol and 10 mL of concentrated sulphuric acid in a glass tube. The tube was allowed to stand for 2 h at least in a shaker bath at 25–30°C. S t a n d a rdaqueous solutions of glucose were pre p a red in the range of 0–30 mg/L. The spectra were collected in the range of 525–450 nm in a 5-cm path length cell against a spectrophotometric blank consisting of 2.0 mL of water, 2.0 mL of 5% phenol, and 10 mL of concentrated sulphuric acid. Chemical reagents
All of the reagents used for chemical analysis were of analytical-reagent grade Carlo Erba (Milan, Italy), and only ultrapure MilliQ water was used.
Journal of Chromatographic Science, Vol. 42, May/June 2004
Results and Discussion TLC–FID analysis of carbohydrates
As far as the chemical composition of the elution system is concerned, several mixtures were used, and better separation and re p roducibility were obtained with the conditions re p o rted in the Experimental section. Table I re p o rts the relative R f values for some selected carbohydrates; neutral carbohydrates were selected because they were alre a d y observed in a qualitative study of the mucilage composition (26), yet the presence of free uronic acids was already shown by a specific colorimetric analysis (3). Vice versa, no information is available about the presence of aminosugars, which can be also present in marine samples (27). The results of Table I show very close values of Rf for many carbohydrates so that environmental samples including all of the thre e types of carbohydrates could result in complex TLC–FID c h romatograms with strong overlapped peaks. Figure 2 Table I. Rf Values of Some Monosaccharides Obtained by the Triple Elution and Acetonitrile Ethyl Acetate and Isopropyl Alcohol (82.5:10:7.5, v/v) System Monosaccharide
Rf (cm)
Glucose Galactose Mannose Arabinose Xilose Fucose Ramnose Glucuronic acid Galacturonic acid Glucosamine Galactosamine
4.26 4.26 3.81 3.51 3.56 4.14 3.75 3.46 3.38 4.81 4.88
( re p o rting the chromatogram of a standard solution of neutral uronic and aminosugar carbohydrates) and Figure 3 (reporting the chromatogram of a real marine mucilage sample) confirm the complex behaviors of the TLC–FID chromatograms of environmental samples. The presence of s t rong overlapped peaks does not allow for a good estimation of the subfractions of neutral carbohydrates, uronic acids, and amino sugars, and a deconvolution pro c e d u re is necessary to enhance the peak resolution. Ve ry satisfying re s u l t s were obtained by applying the deconvolution procedure described previously. Some examples of the application of this pro c e d u re are shown in Figures 4 (i.e., the same chromatogram of Figure 3) and 5, and the results of the chemical speciation of carbohydrates, after the application of the fitting on all the chromatograms, are re p o rted in Table II. The results of Figures 4 and 5 show that the qualitative identification of carbohydrates and their quantitative estimation can result quite difficultly because of the overlapped peaks. Vice versa, after the application of the fitting pro c e d u re, the identification of the carbohydrates present and their quantitative estimation are enhanced. At last it should be noted that the TLC–FID analysis is an excellent alternative method to colorimetric determ i n a t i o n of the total carbohydrate amount in environmental samples. In fact, we compared the amount of total carbohydrates determined by measuring the total area in TLC–FID analysis and the amount determined by the colorimetric technique (25), obtaining a correlation coefficient of 0.983 at 95% of the statistical significance between the two methods (Table III). Practical advantages of the application of TLC–FID analysis with the proposed curve fitting procedure
Though many mathematical functions are available for peak deconvolution in chromatography, it is quite difficult to identify the most powerful function because any function has some disadvantages that can reduce the efficiency of peak re c o nstruction. As far as the EMG function is concerned (maybe the most widely used to describe chromatographic peaks), detailed studies have shown that some peaks cannot be described by this function because there are diff e re n c e s between the shape of the deconvolved peak and the shape of the pure peak o b s e rved in the chromatogram of the s t a n d a rd solution (21,22). These observed differences are strictly related to the asymmetry sometimes present in the chromatographic peaks, which d e t e rmines a non-Gaussian shape of the peak. The use of a polynomial function to describe the values of σ in an EMG distribution, as reported in equation 4, Rf (cm) can improve but not solve all of the p roblems related to the deconvolution Figure 2. Chromatogram of a standard solution containing glucuronic acid (Rf = 3.4), ramnose (Rf = 3.7), glucosamine (Rf = 4.8) and myoinositol (Rf = 8) as internal standard. of asymmetric peaks because this type of function exhibits the defect that
271
Journal of Chromatographic Science, Vol. 42, May/June 2004
h(t → ∞) 0, causing a problem of the baseline (22). Problems of modified peak shapes and baseline are not present in the use of a curve fitting pro c e d u re such as equation 5. These peculiar characteristics of the curve fitting procedure depend on the factor “a”, which takes into account the asymmetry of the peak and on the characteristics of the intensity of the analytical signal “h”, which tends to 0 when the retention time (i.e., the Rf value in TLC) tends to ∞. Ecological evaluations on mucilage phenomenon according to the TLC–FID analysis
analysis it is possible to obtain information about the pre sence or absence of three different subfractions of carbohydrates such as neutral, uronic, and amino sugars, whereas the most used GC and HPLC methods re q u i re separate pro c ed u res with specific derivatisations to obtain the same information. Because of their specific separation ability, GC, HPLC, and also HPTLC methods obviously remain more powe rful than TLC–FID for the identification of all the monosaccharides. However, TLC–FID analysis supported by the the application of an opportune curve fitting pro c e d u re is shown to be a good screening method for the pre l i m i n a ry analysis of carbohydrates in complex samples such as marine snow and mucilage.
The TLC–FID analysis showed that mucilages can have a h e t e rogeneous composition of carbohydrates because neutral carbohydrates, uronic acids, and amino sugars can be present. This evidence, never pointed out in previous studies, confirms the hypothesis that marine snow and mucilage are aggregates of o rganic matter produced according to the typical humification processes of the marine environment (3), in which all of the classes of organic compounds p resent in the marine enviro n m e n t contribute to the synthesis of the humic substance (27). In fact, it is re levant that the TLC–FID analysis shows the presence of re f r a c t o ry organic compounds such as uronic acids and amino sugars. As far as these carbohydrates a re concerned, their role in the form ation of the structural polymers of nonliving biomass is well re c o g n i z e d Rf (cm) because it depends on the peculiar interaction of uronic and amino sugars Figure 3. TLC–FID chromatogram of a mucilage sample (Circeo prof 00). The peaks with a Rf value with the cations of the aquatic enviro nranging between 3 and 5 correspond to the identified carbohydrates, and the peak with a Rf value 8 is ment such as Ca and Mg (28,29). In the internal standard. addition, the TLC–FID method pro v i d e s also information on the ageing of mucilages because the low amount of carbohydrates observed in some samples (Table II), also confirmed by the results of the colorimetric analysis, depends reasonably on an advanced state of oxidative degradation of the o rganic matter in the exudates of marine phytoplankton (30).
Conclusion The described TLC–FID pro c e d u re allowed for the analysis of the carbohydrate content of marine mucilage samples coming from the Italian Seas. The most relevant advantage obtained by this pro c e d u re is the general simplicity because with a single, inexpensive
272
Rf (cm) Figure 4. The result of the deconvolution procedure applied to the same chromatogram of Figure 3. The dotted lines show the reconstruction of each peak. Rf values are centimeters.
Journal of Chromatographic Science, Vol. 42, May/June 2004
Table II. Concentration of the Principal Monosaccharides* Identified in the Mucilage Samples after the Fitting Procedure† Sample
Glu
Gal
Ram
Fuc
Man
Ara
Aglu
Glm
TN
TU
TAS
Circeo prof 00 Riovivo 02 Casaccia 02 Circeo-3m 00 Portotur 02 Elba-30m 01 Elba 00 Elba 99 Giglio 99 Procida 00 Scario 00 Palinuro 00
nd nd nd 39 13 18 18 15 48 nd nd nd
nd nd nd nd 15 23 23 nd nd nd nd nd
30 nd nd nd nd 10 nd 35 nd nd nd nd
nd nd nd 28 32 nd nd 18 nd nd nd 35
25 nd nd nd 44 22 42 26 30 nd nd nd
nd nd nd 3 nd nd nd nd 3 nd nd nd
40 100 100 nd nd 36 nd nd nd nd nd nd
9 nd nd 33 nd nd nd nd nd nd nd 75
55 nd nd 71 104 73 83 93 nd nd nd 35
40 100 100 nd nd 36 nd nd nd nd nd nd
9 nd nd 33 nd nd nd nd nd nd nd 75
* Percent w/w with respect to the amount of total carbohydrates. † Abbreviations: nd, not detectable; Glu, glucose; Ram, ramnose; Man, mannose; Fuc, fucose; Gal, galactose; Ara, arabinose; Aglu, glucuronic acid; Glm, glucosamine; TN, total neutral carbohydrates; TU, total uronic acids; and TAS, total aminosugars.
Acknowledgments This study was jointly supported by the scientific research projects “Mucillagini in Adriatico e Ti rreno” financed by the Italian Minister of Environment and “Analisi di Immagine su Campioni di I n t e resse Ambientale” financed by ICRAM.
References 1. M. Mingazzini and B. Thake. Summary and conclusions of the workshop on marine mucoilages in the Adriatic Sea and elsewhere. Sci. Tot. Envir. 165: 9–14 Figure 5. The result of the deconvolution procedure applied to the mucilage sample called Giglio 99. The (1995). original chromatogram is reported as a continuous line and the identified peaks as dotted lines. 2. G.E. Fogg. Some speculations on the nature of the pelagic mucilage community of ther northern Adriatic Sea. Sci. Tot. Envir. 165: 59–63 (1995). Table III. Comparison Between the TLC–FID and 3. M. Mecozzi, R. Acquistucci, V. Di Noto, E. Pietrantonio, Colorimetric Methods for the Determination of the M. Amici, and D. Cardarilli. Characterization of mucilage aggreTotal Carbohydrate Amount on Some Samples* gates of Adriatic and Tyrrhenian Seas: structure similarities between mucilages and the insoluble fraction of the marine Samples % w/w TLC–FID % w/w Colorimetric humic substance. Chemosphere 44: 709–20 (2001). 4. S.M. Myklestad. Release of extracellular products by phytoplankton with special emphasis on polysaccharides. Sci. Tot. Giglio ’99 36.6 30.6 Envir. 165: 155–67 (1995). Palinuro ’00 2.5 3.2 5. M. Mecozzi, E. Pietrantonio, M. Amici, and R. Acquistucci. UltraElba ’99 65.4 71.6 sound-assisted analysis of total carbohydrates in environmental S.F. Circeo-3mt 7.7 4.4 and food samples. Ultrason. Sonochem. 6: 133–39 (1999). Casaccia 46.27 40.1 6. M. Mecozzi, M. Amici, G. Romanelli, E. Pietrantonio, and Rio Vivo 49.6 44.7 A. Deluca. Ultrasound extraction and thin-layer chromatography/ flame ionization detector analysis of the lipid fraction in marine * The amount of carbohydrates refers to the original weight of the sample: mucilage samples. J. Chromatogr. 963: 363–73 (2002). correlation coefficient between the two methods, 0.983; equation 7. I. Ciglenecki, B. Cosovic, V. Vojvodic, M. Plavsic, K. Furic, Y(TLC–FID) = –3.4 + 0.983X (colorimetric); and standard error, 3.99. A. Minacci, and F. Baldi. The role of reduced sulfur species in the
Rf (cm)
273
Journal of Chromatographic Science, Vol. 42, May/June 2004
8. 9. 10. 11. 12. 13. 14.
15. 16. 17. 18.
19.
274
coalescence of polysaccharides in the Adriatic Sea. Mar. Chem. 71: 233–49 (2000). F. De Angelis, M.V. Barbarulo, M. Bruno, L. Volterra, and R. Nicoletti. Chemical composition and biological origin of “dirty sea” mucilages. Phytochemistry 34: 393–95 (1993). T. Kowalska. “Adsorbent in Thin Layer Chromatography”. In Planar Chromatography: A Perspective View for The Third Millennium. Sz. Nyredy Ed. Springer, Debrecen, Hungary, 2001. J. Sherma. Thin-layer chromatography in food and agricultural analysis. J. Chromatogr. A 880: 129–47 (2000). N.S. Han and J.F. Robyt. Separation and detection of sugars and alditols on thin layer chromatograms. Carb. Res. 313: 135–37 (1998). R. Mukerjea, D. Kim, and J.F. Robyt. Simplified and improved methylation analysis of saccharides using a modified procedure and a thin-layer chromatography. Carb. Res. 292: 11–20 (1996). L.W. Doner. Determining sugar composition of food gum polysaccharides by HPTLC. Chromatographia 53: 579–81 (2001). G. Grygierczyk, W. Fischer, M. Sajewicz, P. Kus, R. Wrzalik, M. Czaja, M. Dziadek, and T. Kowalska. Chromatographic and spectroscopic analysis of the fluorescent compounds derived from monosaccharides on HPTLC-NH2 plates. J. Planar Chromatogr. 15: 449–53 (2002). K. Reiffová, J. Podolonovicová, A. Orinák, K. Flórián, and T. Gondová. Preliminary TLC analysis of fructooligosaccharides as feed additives. J. Planar Chromatogr. 16: 52–57 (2003). M. Ranny. Thin Layer Chromatography with Flame Ionization Analysis, D. Reidel Publishing Company, Dordrecht, Germany, 1987. M. Eisaiessen, K. Øverlø, and R.L. Olsen. Analysis of N-acetylchitoolisaccharides by the Iatroscan TLC/FID system. Carb. Res. 273: 77–81 (1995). J.S. Walters and J.I. Hedges. Simultaneous determination of uronic acids and aldoses in plankton, plant tissues and sediment by capillary gas chromatography of N-hexylaldonamide and alditol acetates. Anal. Chem. 60: 988–94 (1988). K. Kaiser and R. Benner. Determination of amino sugars in environmental samples with high salt content by high-performance anion-exchange chromatography and pulsed amperometric detection. Anal. Chem. 72: 2566–72 (2000).
20. J. Grimalt, H. Iturriaga, and X. Tomas. The resolution of chromatograms with overlapping peaks by means of different statistical functions. Anal. Chim. Acta 139: 155–66 (1982). 21. J.R. Torres-Lapasió, J.J. Baeza-Baeza, and M.C. Garcia-AlvarezCoque. A model for the description, simulation and deconvolution of skewed chromatographic peaks. Anal. Chem. 69: 3822–31 (1997). 22. A. Economou, P.R. Fielden, and A.J. Packman. Deconvolution of overlapping chromatographic peaks by means of fast Fourier and Hartley transforms. Analyst. 121: 97–104 (1996). 23. L. Pap and Z. Papai. Application of a new mathematical function for describing chromatographic peaks. J. Chromatogr. A 930: 53–60 (2001). 24. S. Ebel. “Quantitative analysis in TLC and HPTLC”. In Planar Chromatography: A Perspective View for the Third Millennium. Sz. Nyredy, Ed. Springer, Debrecen, Hungary, 2001. 25. M. Mecozzi, R. Acquistucci, M. Amici, and D. Cardarilli. Improvement of an ultrasound assisted method for the determination of total carbohydrates in environmental and food samples. Ultrason. Sonochem. 9: 219–23 (2002). 26. N. Kovac, O. Bajit, J. Faganeli, B. Sket, and B. Orel. Study of macroaggregate composition using FT-IR and 1H-NMR spectroscopy. Mar. Chem. 78: 205–15 (2002). 27. R. Ishiwatari. Macromolecular materials (humic substance) in the water column and sediments. Mar. Chem. 39: 151–66 (1992). 28. C. Hung and P. H. Santschi. Spectrophotometric determination of uronic acids in seawater using cation-exchange separation and pre-concentration by liophilization. Anal. Chim. Acta. 427: 111–17 (2001). 29. G.G. Leppard. The characterization of algal and microbial mucilages and their aggregates in aquatic ecosystem. Sci. Tot. Envir. 165: 103–31 (1995). 30. M. Mecozzi, V. Di Noto, E. Pietrantonio, and Zs. Papai. The humin structure of mucilage aggregates in the Adriatic and Tyrrhenian Seas: hypothesis about the reasonable causes of mucilage formation. 2003, submitted. Manuscript accepted April 13, 2004.
Journal of Chromatographic Science, Vol. 42, May/June 2004
8