Application of Data Mining Techniques for Remote Sensing Image Analysis S. Velickov International Institute for Infrastructural Hydraulic and Environmental Engineering, Delft, The Netherlands, Email:
[email protected]
D.P. Solomatine International Institute for Infrastructural Hydraulic and Environmental Engineering, Delft, The Netherlands, Email:
[email protected]
X. Yu International Institute for Infrastructural Hydraulic and Environmental Engineering, Delft, The Netherlands, Email:
[email protected]
R. K. Price International Institute for Infrastructural Hydraulic and Environmental Engineering, Delft, The Netherlands, Email:
[email protected]
ABSTRACT: The paper studies the applicability of various data mining techniques on aerial remote sensing imagery for automatic land-cover classification. Four techniques are applied, namely the Adaptive Dynamic K-means (ADK), Self Organizing Feature Map (SOFM), Machine Learning Induction Algorithm (C4.5) and Support Vector Machines (SVM). Special attention is drawn to the usefulness of these data mining classification techniques for automatic land-cover recognition, that is, for physical interpretation of the classes. A novel, hybrid ADK-SOFM-SVM data mining procedure suitable for automated land-cover cluster analysis is presented.
1 INTRODUCTION Over the last few decades the effect of such phenomena as the gradual desertification of certain regions and catchments, the rapid disappearances of forest areas, continuous urban development, etc., have shown that earth terrain features are essential for the management and modelling of water resources and environment. To detect changes of landcover and monitor continuous human interventions, large amount of remote sensing data was collected during the last decade using sophisticated satellites and aerial images, and became one of the major data sources for Geographical Information Systems (GIS). However, these data have still not been fully explored and analyzed by the advanced and efficient techniques that became available recently.
Data mining, as a process of searching and discovering valuable information and knowledge in large volumes of data, is an emerging research field; it draws basic principles from concepts in databases, machine learning, statistics, pattern recognition and 'soft' computing. Using data mining technologies and techniques enables more opportunistic use of data banks of aerial remote sensing images. This paper focuses on available data mining techniques for automatic land-cover classification of remote sensing aerial images. In particular, generation of landcover thematic maps using remote sensing data, such as multi spectral satellite data and aerial images, is seen as an important practical task. Applications of various data mining techniques for image analysis and classification are reported recently in the
Proc. 4-th International Conference on Hydroinformatics, Iowa, USA, July 2000. Balkema, Rotterdam
1
literature. Vassilas et al. (1995) describes fast and efficient classification of multispectral remote sensing data using Artificial Neural Networks (ANN) and constrained optimization techniques (ALECO algorithm). Waldemark (1998) applies Principal Component Analysis (PCA), ANN and Adaptive Resonance Theory (ART) techniques for cluster analysis of multivariate satellite data. Busch (1997) presents SOFM combined with wavelet-based texture segmentation for analysis of topographic images. Verevka (1995) discusses local K-means algorithm for color image quantization. Modified temporal SOFM was demonstrated to be useful for object localization in 2D images (Lakany et al., 1996). Common drawbacks of most of the methods are: (i) most of the applications studied and reported in the literature are performed using image data where the number of the classes is known a priori, (ii) applying image analysis often involves interactive or semiautomatic procedures and (iii) application of unsupervised learning algorithms usually results in discovery of classes that have no real physical interpretation. Therefore additional supervised learning vector quantization step (Kohonen, 1995) is needed to construct a meaningful classifier. Our overall goal is to demonstrate that a novel hybrid data mining approach can be used for automated aerial image land-cover classification. Details concerning the analyzed aerial image data set and mapping the original input pattern data space to feature space are described in Section 2. Four different classification techniques, the Adaptive Dynamic K-means, Self Organizing Feature Map, Machine Learning Induction Algorithm and Support Vector Machine are described and studied in Section 3. Section 4 demonstrates a hybrid approach for automated estimation of a number of classes and assigning each class to a particular land-cover label using a combination of ADK and SOFM techniques, and further building an accurate classifier using a combination of SOFM and SVMs. Section 5 and Section 6 contain results and conclusions.
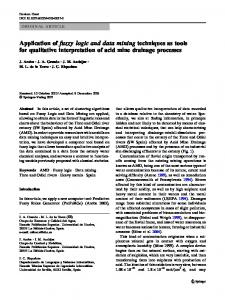
2 INPUT DATA AND FEATURE EXTRACTION The data set used in this study is a collection of digital airborne images (total of 47) of the suburbs of a European capital. Source images consist of 4387*2786 pixels stored as gray levels in TIFF format. The objective of image classification in this case is to categorize automatically all pixels in an image into land cover classes or themes. Since each image contains millions of pixels, which requires significant computational power, in order to make this process operational on a PC, a feature extractor was built to reduce the amount of input pattern space. Extraction of features from the pattern space is important for the classification or pattern recognition process. By doing this, the amount of data is reduced (pattern space is mapped into the feature space) while features can still keep the amount of information present in the input patterns (see Figure 1). Data pattern space
Feature extractor
statistics texture wavelet
Features feature space
Class Classifier
land cover
ADK SOFM SVM C4.5
Figure 1: Design of the image recognition system Several methods for feature extraction in image analysis are reported in the literature, all based on the common understanding of texture as an attribute representing the spatial arrangements of the gray levels of pixels in a region. Traditional work on texture description and analysis is driven by a statistical understanding of texture. Spectral properties of texture energy were also investigated. More recent research in texture analysis research has been influenced by the results achieved in wavelet transforms and self-similarity property of images expressed by fractal dimension. A summary of different feature extraction methods based on texture properties of image pixels is presented in Table 1 below:
Proc. 4-th International Conference on Hydroinformatics, Iowa, USA, July 2000. Balkema, Rotterdam
2
Table 1. Feature extraction techniques technique statistical moments texture textural energy wavelet analysis fractals
reference proposed by Hu (1962, describing first order statistics introduced by Haralick (1992), cooccurrence matrices according to Laws (1980), texture window filter kernels introduced by Chang and Kuo (1993) based on fractal dimension
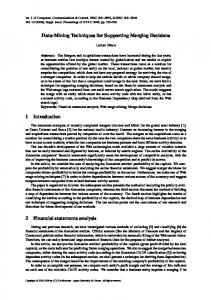
In this study, the feature extractor is based on the first and second order statistical properties of small sized texture windows. Since each image with its initial size is too big to process on a PC, every image was cut into several pieces of size 1024*1024. From these sub-images, small texture windows (segments) with the size of 16*16 pixels were chosen randomly and were assumed to be characterized by homogeneous texture and statistical parameters. For each chosen texture window (see Figure 2) basic statistical and spatial relation parameters were calculated using the feature extractor, namely: mean, variance, energy, entropy, momentum, shade, prominence and spatial correlation. This resulted in a training data set of 1280 sample patterns each containing 8 features. feature vector texture windows
aerial image
Figure 2: Texture windows and feature extraction for aerial images 3 DATA MINING CLASSIFICATION TECHNIQUIES Classification, as one of the major data mining operations, is closely coupled with clustering, which is to identify clusters embedded in multi-dimensional data space. A cluster can be seen as a collection of data objects (groups of data) that are 'similar' to one another. Similarity is usually expressed as a distance function (e.g. Euclidean distance). Various
approaches and techniques have been proposed in the literature for developing classifiers by means of clustering, which can be summarized as: (i) iterative clustering (ii) agglomerative hierarchical clustering and (iii) divisive hierarchical clustering. From a perspective of data mining, classification and clustering algorithms that employ unsupervised learning receive greater attention, such as SOFM, Bayesian classifiers, neural gas can be mentioned (Velickov and Solomatine 2000). The reason for this is the fact that in most of engineering classification problems the set of possible classes present in the data is not known a priori. However, this paper does not attempt to cover all classification and clustering algorithms. The focus has been on algorithms that give useful partition of classes and, furthermore, on algorithms that are fairly simple to implement in an automated image analysis system. Four different classification techniques, the Adaptive Dynamic K-means (ADK), Self Organizing Feature Map (SOFM), Machine Learning Induction Algorithm (C4.5) and Support Vector Machine (SVM) are studied and applied in this work. The main aim was to infer if any of these methods could be used directly as a tool for automatic land-cover classification of aerial images. It this text 'automatic' means that no human interface should be needed in the process of the landcover classification. Normally a question follows: Why is this important? One can argue that usually experts tend to be ‘biased’ i.e. a judgement or decision made by an expert changes over time and several experts also may have several opinions. Furthermore, the amount of data produced by remote sensing imagery is so large that is impossible manually to scan and classify all data in reasonable time. Therefore an automated classification system based on data mining techniques can provide a good basis for the further data analysis. 3.1 The adaptive K-means algorithm using dynamic initialization (ADK) The standard K-means algorithm (Anderberg, 1973) is one of the most widely used clustering algorithms utilizing supervised
Proc. 4-th International Conference on Hydroinformatics, Iowa, USA, July 2000. Balkema, Rotterdam
3
learning. It is also known under many other names, e.g. the adaptive sequential procedure. It is well known that the standard K-means algorithm is sensitive to the initialization procedure and many variations have been suggested to overcome this problem. One suggestion is to select the starting points (class centers) using a more dynamic based method (Verveka, 1995). The initialization procedure is then based on the actual data patterns and uses a maximum cluster radius r as a limiting condition for starting a new cluster. The ADK algorithm is presented below. Algorithm 1. ADK algorithm Initialize cluster centers c Introduce the next input pattern x Update only the cluster center ck closest to x if ck is within r from x : new( c k ) = old ( c k ) + α ( x − old ( c k )) α is a learning rate which decreases over time (iteration) Step3 Otherwise, enable and initialise a new cluster center: ck =x Step4 Go to step1; end after fixed number of iterations. Step1 Step2
The experiments carried out in this work using the ADK algorithm showed that the adaptive dynamic K-means algorithm when varying the number of classes and different radius r is time consuming and computationally expensive, especially for large data sets. ADK performs well when the existing classes (groups of data) are well separated in the multivariate data space and they can efficiently located. What is positive in this algorithm from the automation point of view is that one can find the dependency between the radius r and the number of addressed classes. Regions with a constant number of classes when r is rapidly increasing may indicate a suitable partition of the analyzed data. 3.2 Self Organizing Feature Maps (SOFM) Over the last decade Artificial Neural Networks (ANN) have shown their effectiveness in classification, regression and cluster analysis tasks (see e.g. Bhattacharya
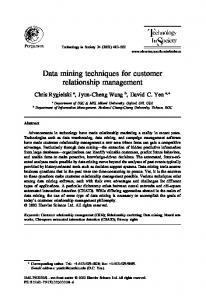
and Solomatine, 2000). The Self Organizing Feature Map (SOFM) proposed by Kohonen (1995) is a neural network algorithm based on unsupervised learning i.e. it is able to organize a set of input patterns into classes independently. The key feature of the SOFM is its ability to perform a nonlinear topological mapping from n-dimensional data input space to k-dimensional structure (usually twodimensional map). It is also an efficient method for vector quantization, which makes it possible to get a low-dimensional representation (visualization) of the data without loss of information. The fairly simple algorithm makes SOFM a popular data mining classification technique. The SOFM generally consists of an input layer and a two-dimensional output neuron configuration (map), as shown in the Figure 3a, though topologies of higher dimensions are also conceivable. Each neuron (unit) is assigned a representative vector (code book vector) the elements of which are comprised of the input signal's connection weights. Therefore each neuron bears a code book vector of dimension M of the input space and represents a point in the input space via this vector. 1 2 3
...
ω11 ωω1M 12
N
ΝΕj (0) ΝΕj (t2 ) ΝΕj(t1 )
ωNM j
... 1 2
M
x1 x2 xM
a) b) Figure 3: a) SOFM structure; b) changing size of the neighborhood while learning During the training stage (learning process), the code book vectors are adapted in accordance of the input signal, i.e. their positions are shifted in the input space in the direction of the input vector. As a result of the algorithm, an organized network develops, that is, signal similarity of the input patterns is transformed into a degree of proximity between the locations of the excited (winning) neurons. In order to attain this organization of the neurons, the neurons are arranged in accordance to the input patterns by means of
Proc. 4-th International Conference on Hydroinformatics, Iowa, USA, July 2000. Balkema, Rotterdam
4
neighbourhoods, which means that the neurons are adapted not individually, but in a conjunction with neighboring neurons ('team work'). During this process however, it is essential to maintain the configuration in a steady state of transfer. This implies that the size of the adjustment steps and the neighborhood must decrease monoclinically with respect of the number of the executed learning steps (epochs). In this way, the neurons can be organized initially into groups approximately representing similar patterns (clusters). In the following stages a finer structure of the neuron groups is developed; see Figure 3b. In general, a large number of variations of the SOFM algorithm exist. Most of them differ in the implementation of the learning rate, the initialization of the weights for neurons (processing units - PUs) and the feedback function. The training algorithm for the SOFM adopted for this work can be found in Kohonen (1995) and is presented below. Algorithm 2. SOFM training algorithm 1 2 3 4
Initialize all elements wij of the weight vectors wi with random numbers Introduce the next input pattern x Search for winning neuron k using min Euclidean distance Adapt (adjust) weight vectors according to the following function new( wij ) = old ( wij ) + α ( t ) ⋅ rij ( t ) ⋅ ⋅ ( x j − old ( wij ))
5
Go to step 2; end after fixed number of iterations. α ( t ) - learning rate of epoch t rij ( t ) - the feedback function of neuron i to the winning neuron k of epoch t
The results obtained using the SOFM algorithm can be summarized as follows: (i) proper selection of the number of the PUs is necessary in order to avoid focus, collapse, pinch and boundary effects (see Kohonen, 1995); (ii) the SOFM can identify the desired classes if the size of the network is large enough, i.e. number of PUs ≥ than the number
of classes, and (iii) if SOFM is initialized with a correct number of PUs then it performs a good partitioning of the data. The main drawback for implementing SOFM in the automated classification procedure is having knowledge of the proper SOFM configuration to be used on a specific data set. In order to overcome this problem we investigated the possibility of coupling the ADK and SOFT algorithms (see Section 4). Once the learning processes is finished, the problem is how to label the SOFM processing units, and further, to give a physical meaning to the discovered classes. Several suggested methods to solve this problem exist, one is to run an additional supervised vector quantization algorithm using a labeled data set (an additional data set with well-known classes). In this work we adopted this approach where k-nearest neighbors were used to label the SOFM PUs. Given a final weight vector wi , its k nearest neighbors in the labeled data set are determined, and wi is assigned to the class to which the relative majority of neighbors belong. In this way the SOFM PUs are assigned labels of particular classes. Such labeled network can be used further for the classification of a new unseen data set. 3.3 Machine Learning Induction Algorithm (C4.5) – creating decision tree from data Machine learning methods that represent their mined knowledge as decision trees and classification rule sets form family of classifiers that can be effectively used for solving classification problems. In most of these algorithms the classification target (the set of class labels) has to be pre-determined. There are several groups of algorithms that generate decision trees, which differ in the feature selection criterion for partitioning the training data set. In this work we used the enhanced version of the ID3 algorithm know as C4.5 (Quinlan 1992). The learning algorithm is presented with a set of examples relevant to the classification task. The aim of the learning method is to produce a tree that correctly classifies all examples in a subset of the training set. Examples in the training set are then classified using the tree. If the tree
Proc. 4-th International Conference on Hydroinformatics, Iowa, USA, July 2000. Balkema, Rotterdam
5
gives the correct answer for all of these latter examples then it is correct for the entire training set, and the iterative process terminates. If not, a selection of the incorrectly classified examples is added to the initial subset and the process starts again. An information-based divide-and-conquer strategy is used to construct the decision tree (see Quinlan, 1992). 3.4 Support Vector Machine (SVM) – statistical learning theory in practice The Support Vector Machine (SVM) is a learning technique based on statistical learning theory (Vapnik, 1998). SVMs have attracted wide interest as a mean to implement structural risk minimization for the problems of classification and regression estimation. In this paper we focus on using SVM for classification problem. For two-class (binary) pattern recognition problem, the task is to estimate a function f: RN → {±1} using input-output training data: (x1, y1), . . . (xl, yl ), ∈ RN × {±1} (1) such that f will correctly classify unseen examples (x,y), i.e. f(x)=y for examples (x,y) that were generated from the same underlying probability distribution P(x,y) as the training data. Since there is no restriction on the class of functions f that can be estimated from the training data, minimizing only the average training error, known also as empirical risk, 1 l 1 f ( x i ) − yi (2) l∑ 2 i =1 does not imply a small test error (risk), averaged over the test samples drawn from the same probability distribution P(x,y), 1 R [ f ] = ∫ f ( x ) − y dP( x , y ) . (3) 2 Statistical learning theory (Vapnik and Chervonenkis, 1974), sometimes referred as VC theory, shows that it is imperative to restrict the class of functions to one which has a capacity that is suitable for the amount of available data. VC theory provides bounds on the test error. The minimization of these bounds, which depend on both the empirical risk and capacity of the function class, leads to the Vapnik’s principle of structural risk Remp [ f ] =
minimization. The best-known capacity concept of the VC theory is VC dimension, defined as the largest number h of points that can be separated in all possible ways using functions of a given class. If h> assumed number of classes (usually 8