Control of whole body MR imager used for clinical ... Shewhart control charts describe the changes in the temporary ... In the control x-individual chart, seven.
And Quantitative
Application of LCModel for Quality Control in Vivo ‘H MR Spectroscopy by Short Echo Time STEAM Sequence
M.HAjek, M.DezortovB, M.Burian MR Unit, Institute for Clinical and Experimental Medicine, Prague, Czech Republic Introduction
In viva metabolite concentrations can be measuredusing different methods. One of these is the application of linear combination of model spectra (LCModel - [1,2]). The method is based on fitting the measured experimental spectrawith the spectra of model compounds. The aim of the study was to develop the application of LCModel software package which could serve for routine Quality Control of whole body MR imager used for clinical measurementsof 1H MR spectra of the brain. Methods
1H MR spectra of the standard Siemens phantom (0.1 mmol acetate and lactate solution in the sphere of diameter 15 cm) centered with respect to both coil and magnet were acquired using a whole-body 1.5T Siemens Magnetom Vision scanner (Siemens, Erlangen, Germany) equipped with an actively shielded gradient system. Standard Siemens circular polarized (CP) headcoil (diameter 29 cm) was used. All the spectra were acquired using standard STEAM sequence(TR/TE/TM=1500/1 O/l 5 ms, TA~‘1.024 s, 1024 data points). The model spectrum from a cubic voxel (8 ml) in the center of the magnet was acquired (64 acquisitions) after a localized shimming procedure. After phase correction, model basis for LCModel analyzing software was created. The actual correction factor kT = fqcA I fqcO describeschangesof the imager settings. fqcO is the sum of the signal intensities of lactate and acetate in VOI 8 ml, representing the nominal intensities in the QC-phantom at the start of the QC testing (see point 1, the graph in Figure l), fqcA is the sum of the actual signal intensities. The QCT measurementof signal intensities is repeated three times, and the mean value of the intensities is used. The LCModel program was modified for calculations of the concentrations of pure compounds(see below). Results and discussion
The system of Quality Control newly developed follows these steps: a) measurement of 1H spectra of phantom using a fully automatedcommercial sequence, b) automatic calculation of the temporary correction factor, c) application of kT for the quality assuranceby Shewhart control charts [3], d) correction of actual in vivo concentration by kT. A key point of the QC is fitting of the spectra by LCModel. The original version of LCModel is not quite suitable for calculation of the spectra of pure compounds [l]. We found that the spectra must be apodized before the use of LCModel, preferably by exponential function to allow the optimizing procedure to find a better lit. In our experiencethe exponential constant should be 400 ms.
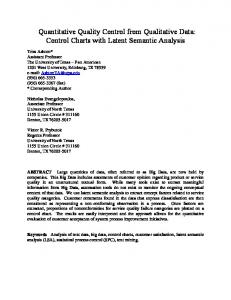
The values of coefficient kT used for the construction of Shewhart control charts describe the changes in the temporary coefficient kT from January 1996 till July 1998 (see Figure 1). In the control x-individual chart, seven areas where values outlie the UCL or LCL (upper and lower control levels) can be found. Compared to servicing records, these areasin both charts correspondwell to cases of apparatus misadjustment or failure. Groups and problems were identified as follows: Ra - regulated area (the values from this region comply with the condition for Shewhart chart creation), A - initial value, B - breakdowns of the system, C - changesrelated to replacement of builtin preamplifier and its later replacement by the original one, D - changesin the sensitivity and homogeneity of the coil due to head-coil break-down leading to its exchang,e, E - parameters of the new head-coil, F - change in parametersafter complete scannerretuning. x-individual
150
0
20
40
60
60
100
120
Sample No.
Fig.1. Time dependenceof the actual correction factor kT Conclusion
To test the full protocol, the spectra of healthy volunteers were evaluated and the concentrations of metabolites in white matter and hippocampus were obtained. The application of the kT parameter for the correction of in vivo data increases the precision of molar concentration determination by about 4 %. The repeatability of the measurementof prominent metabolites such as NAA, Cr and Cho was found to be around 10% (n=6); precision in a group of volunteers (n=20 and 28, resp.) is approximately in the range 13 to 20%. Quality control by a Shewhart regulation diagram leads to continuous evaluation of the setting of the MR imager. This study was supported by grants GACR 309/97/KO48, 309/96/0884 of the Grant Agency of the Czech Republic and IGA MZ 3423-3. References
1. Provencher, SW. Magn Reson Med, 30,672, 1993. 2. Dezortova M, Burian M, Hajek M. JMagn Reson Anal, in press. 3. Shewhart WA. Statistical Method from the Viewpoint of Quality Control. Dover Publishing 1987.