J. Basic. Appl. Sci. Res., 2(11)10859-10868, 2012 © 2012, TextRoad Publication
ISSN 2090-4304 Journal of Basic and Applied Scientific Research www.textroad.com
Application of Mathematical Approach in Identifying Behavioral Patterns of Route Choice Gholamali Shafabakhsh1, Mahdi Pour Rouholamin2, Mana Motamedi3 1
Assistant Professor, Civil Engineering Faculty, Semnan University, Semnan, I.R. of Iran 2,3 Civil Engineering Faculty, Semnan University, Semnan, I.R. of Iran.
ABSTRACT It has been widely accepted that numerous different factors can affect the choice of route by road users. Therefore, recognizing the most important parameters with respect to existing relationships between them plays a key role in future modeling. In this study, a new mathematical approach known as Rough Sets Theory, is used as a powerful data mining tool to determine and evaluate the effects of different parameters on route choices by road users. Consequently, a group of set(s) of most important parameters is identified by applying Rough Sets Theory so that this set(s) is successful in detailing and predicting the choice behaviors of road users. The set of the most affecting parameters is then identified by applying a Regression analysis in order to evaluate the obtained results. A comparison is then conducted between the two results. This comparison indicates that Rough Sets approach is efficient and accurate enough in predicting trip assignment process and is expected to provide reliable outcomes. KEYWORDS: Trip assignment; Rough Sets Theory; Regression analysis; Affecting parameters, Choice pattern 1. INTRODUCTION The selection of routes by road users, better known as Trip Assignment (TA), is the final step of the fourstep traditional travel demand forecasting process and its complement plays a major role in transportation studies. In order to predict this process and assign traffic load to network lines, a variety of models have been presented. All of these models are a combination of affecting parameters but, due to their theoretical foundation, most of them cannot take into account qualitative parameters in addition to quantitative ones in the method of route choice by road users. This deficiency can be ascribed to a lack of proper tools for investigating qualitative and quantitative parameters, or for identifying the most important parameters affecting the process of trip assignment for future modeling. As we know, the impact of mathematics on each aspect of life and science can lead to enormous and fundamental changes in that aspect. Therefore, making use of such documentary and logical theoretical concepts can eliminate imperfections inherent in other branches of science. Accordingly, transportation planning and in particular trip assignment as a domain of science is not an exception. Therefore, a new generation of trip assignment models using concepts such as Artificial Neural Network (ANN), Genetic Algorithm (GA) and Fuzzy Logic (FL) are being explored. Rough Sets Theory was first proposed by Z. Pawlak in 1982, and can accommodate the vagueness and uncertainty inherent in decision-making. Since 1982, this theory has been developed and used in many domains such as seismology and earthquake studies [1], network intrusion detection systems [2], workflow management [3] and in illustrating the relationships between human psychological and physiological states [4]. In this paper, Rough Sets Theory is used to analyze the decision table composed of attributes recognized as affecting parameters on the choice behavior of road users in order to use these parameters in the future traffic planning and management, as these parameters are not discernible using many current and classic mathematical concepts. The paper is structured as follows; a brief review of trip assignment and modern modeling of this procedure is provided in section 2; in section 3, Rough Sets Theory is introduced and its main concepts are discussed; section 4 is allotted to analyzing the provided data using Rough Sets Theory; another analysis using Regression method is implemented in section 5, and in section 6, a comparison between results obtained from both analyses is offered and results are compared and discussed. Conclusions based on the aforementioned analyses are given at the end of the paper. 2. Trip Assignment The goal of trip assignment models is to estimate how traffic load goes through the links in a traffic network, each link in a traffic network corresponding to a section, road or a collection of roads, and the associated effects of traffic on the network and vice versa. There are a number of criteria that can measure these effects; some of these are travel time, environmental conditions and distances travelled. Therefore, there has *Corresponding Author: Gholamali Shafabakhsh Assistant Professor, Civil Engineering Faculty, Semnan University, Semnan, I.R. of Iran. email:
[email protected] Tel: +98 (231) 3354109 10859
Shafabakhsh et al., 2012
always been a need for considering all these parameters in order to estimate the amount of traffic that has been assigned to a link. Early models used simple concepts to obtain reasonable link flows but, due to this simplicity, they usually could not take into account complicated parameters. Models based on Wardrop’s principles and deterministic techniques lie in this class. But with the arrival of new and flexible mathematical concepts, models changed greatly and could accommodate both simple and complex parameters. Fuzzy Logic (FL), Artificial Neural Network (ANN) and Genetic Algorithm (GA) are examples of these concepts. Shafahi and Ramezani [5] proposed a new assignment model using Fuzzy Set theory. This model had more flexibility with relation to driver behavior characteristics. They demonstrated that the results from their model are the same as UE (User Equilibrium) results when they include risk-neutral motorists and/or deterministic travel time. In addition to this, they could derive a mathematical fuzzy user equilibrium condition. Varia and Dhingra [6] tried to formulate a dynamic system-optimal traffic assignment model for a congested urban road network with a number of signalized intersections. In order to do that, they employed a simulationbased approach for the case of multiple-origin-multiple-destination traffic flows. Genetic Algorithm technique was used to minimize the overall travel cost in the network with fixed signal timings and optimization of signal timings. Validation was provided by applying the proposed method to the sample network. They concluded that the GA method allows the relaxation of many assumptions, so that it simplifies modelling whilst increasing accuracy. 3. Rough Sets Theory Rough Sets Theory [7] is a recently proposed and powerful mathematical tool that can be applied to a wide range of sciences in order to analyze vague, uncertain and imprecise information [8]. The philosophy and concept of this theory is founded on the assumption that every object in the universe of discourse is connected to some information [9]. For example, if objects are assets listed on a market, the information about the assets is composed of their price behavior and economic characteristics [10]. Objects characterized by the same information are indiscernible in view of the available information about them. The indiscernibility relation generated in this way is the mathematical basis for Rough Sets Theory [11,12]. Rough Sets Theory has some advantages over other similar theories [13,14]. For example, it does not need any external information and is based solely on original data. Using this theory, it is possible to analyze qualitative attributes in addition to quantitative ones. Another advantage is that its results are easily understandable even by non-experts. Discovery of dependencies (full or partial) between attributes, removal of redundant data not required for analysis and generating decision rules are also other advantages of this theory [15]. Since it was first set down by Pawlak in 1982, this theory has been well studied by many researchers and has made great progress. Some of its progressive applications include; presenting a new approach to Rough Set Theory in pavement rehabilitation and maintenance decision support systems [16]; assessing the factors that influence the sensitivity of travellers to public transport travel costs in Europe, by carrying out a comparative analysis of elasticity values of transport demand resulting from studies in various countries [17]; reducing the size of the original pavement database in terms of attributes and rows using Rough Sets Theory and using this reduced table as an input into the neural network [18]. In order to become familiar with some principles of this theory, the basic concepts are introduced in this section. For further information and detailed review on Rough Sets Theory, all researchers and readers can refer to Pawlak [8] and Hampton [19]. 3.1. Information systems Information systems (attribute-value systems) are structures that record human knowledge on the basis of experiences and are used to represent knowledge in Rough Sets Theory. The concept of an information system has been first formulated by Pawlak [8] and after that it has been developed by many researchers such as Yasdi [20], Hampton [21,22] and Komorowski et al. [23]. An Information system S ( U, , Vq , f q ) consists of:
U − a nonempty, finite set called the universe; − a nonempty, finite set of attributes; C D , in which C is a finite set of condition attributes and D is a finite set of decision attributes; For each q , Vq is called the domain of q ; f q − an information function f q : U Vq . Objects can be interpreted as cases, states, processes, patients and observations. Attributes can be interpreted as features, variables and characteristic conditions. A special case of information system called a decision table or attribute-value table is applied in the following analysis. In a decision table, the rows and columns correspond to objects and attributes, respectively [24, 25, 26].
10860
J. Basic. Appl. Sci. Res., 2(11)10859-10868, 2012
3.2. Lower and upper approximation Due to the imprecision which exists in real world data, there are always conflicting objects contained in a decision table. Here conflicting objects refer to the two or more objects that are indiscernible by employing any set of condition attributes, but they belong to different decision classes. Such objects are called inconsistent, and this decision table is called an inconsistent decision table [10]. In Rough Sets Theory, the approximations of sets are introduced to deal with inconsistency. If S ( U, , Vq , f q ) is a decision table, B and X U , then the B-lower and B-upper approximations of X are defined, respectively, as follows:
B X Y U / IND B : Y X
B X Y U / IND B : Y X where U / IND B denotes the family of all equivalence classes of B (classification of U); and called the B-indiscernibility relation, is defined as follows:
INDB ,
IND B x, y U 2 : for every a B , a x a y
The set BN B X B X B X is called the B-boundary of X. B X is the set of all elements of U which can be certainly classified as elements of X, employing the set of attributes B. B X is the set of elements of U which can be possibly classified as elements of X using the set of attributes B. 3.3. Quality of approximation Inexactness of a set (category) is due to the existence of a boundary region. There are two measures to describe inexactness of approximation classifications. The first measure is the accuracy of approximation of by B. It expresses the possible correct decisions when classifying objects employing the attribute B. This measure can be formulated as follows:
B X
card B X card B X i i
The second measure to describe this inexactness is called the quality of approximation of by B. It expresses the percentage of objects, which can be correctly classified into class employing the attribute B:
B
card B X i
card U If B 1 , then the decision table is consistent, otherwise, it is inconsistent [10].
3.4. Reducts and core One of the key problems and fundamental concepts in Rough Sets Theory is computation of reducts and core. The reduct sets are the subsets of condition attributes that are sufficient to describe the decision attributes and provide the same quality of approximation as the original set of attributes. The so-called core is the intersection of all possible reducts so can be found in all reduct sets. These two concepts can be described and formulated as below: The B-reduct of , represented by RED(B), is the smallest subset of , which offers the same quality of approximation as the set of whole attributes [10]. In a given data set, more than one reduct set can be found [17] so that it make it possible to analyze the information table by using any one of these reduced sets of attributes. The B-core of , represented by CORE(B), is the essential part of , which cannot be eliminated without disturbing the ability to classify objects into elementary classes of B [10]. The core is the set of all attributes indispensable in that contains all the attributes from B which are considered of greatest importance in the information table. On the other hand, each of the attributes not belonging to the core may be neglected without deteriorating the quality of the classification considered, but if any of attributes belonging to the core are eliminated from the information table, it will not be possible to obtain the highest quality of approximation with the remaining attributes [17]. 4. Rough Sets Analysis As mentioned above, Rough Sets Theory is primarily a classification method devised for non-stochastic information. This also means that ordinal or categorical information (including dummies) may be taken into
10861
Shafabakhsh et al., 2012
consideration. This makes Rough Sets analysis particularly useful as a meta-analytical tool in the case of incomplete, imprecise, or fuzzy information [27]. Following results can be expected from the Rough Sets analysis: evaluation of the relevance of particular condition attributes; providing the smallest subsets of attributes offering the same quality of approximation as the whole set of attributes (i.e., reducts of the set of attributes); intersection of those reduced sets called core that cannot be eliminated without disturbing the quality of approximation of the set of attributes; and elimination of irrelevant attributes [17]. In this section, all the parameters (condition attributes) affecting the trip assignment process and choice of routes by road users (decision attributes) will be identified and then adapted to local conditions. After that, discretization is used to change these continuous attributes into ordered discretized ones. In the next step, these attributes will be analyzed by means of Rough Sets Theory and reducts and core will be derived as the result of analysis. Finally, the obtained results are validated using Linear Regression methods. In Figure 1, all these steps can be found as a conceptual diagram. Identifying Condition and Decision Attributes Discretizing Attributes Data Collection Analyzing Using Rough Sets Theory Reducts
Core
Analyzing Using Linear Regression Set of the Most Affecting Parameters
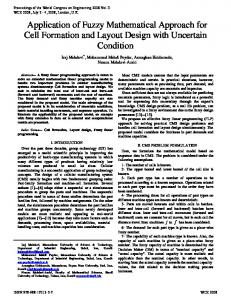
Figure 1. Conceptual Diagram of Methodology 4.1 Determination of attributes Before using Rough Sets Theory, all attributes (including both decision and condition attributes) must be determined in order to compose the decision table. This process is called Pre-collection Activity and is one of the most crucial steps prior to any data collection. In this research, we recognized 13 condition attributes which could affect choice of route by road users in the city of Semnan. These attributes are shown in Table 2. As it can be seen, the decision attribute is the dependent parameter and actually is the choice behavior of road users in a distinct area. Semnan CBD is chosen as this Distinct Area (Figure 2) and necessary data will be gathered through interviews with individuals or small groups of people. On the other hand, condition attributes are independent variables that affect dependent variables.
Figure 2. Semnan CBD (study area) and its subdivision
10862
J. Basic. Appl. Sci. Res., 2(11)10859-10868, 2012
Each of these condition attributes has its own description. Needed maneuvers can be interpreted as the quantity of necessary changes in direction of a moving vehicle. So it is more dependent on geometric design of the route and traffic conditions. Accordingly, this parameter cannot be taken into account when trips are being undertaken on foot. Reliability as a factor in travel has been getting more attention, as can be seen by the increasing number of studies being done in this area. There are different types of reliability that transportation studies have mentioned: connectivity reliability, travel time reliability and capacity reliability [28,29]. From these three concepts, we will focus on travel time reliability. From a road user’s point of view, travel time reliability is related to the variability in experienced travel time. This means that the increased variability of travel time makes scheduling difficult and brings the possibilities of early and late arrival, introducing risk in the decision-making process [30]. There were a few other affecting attributes (in addition to these thirteen condition attributes) such as length of grades and surrounding view of route, but they were excluded for certain factors. As for length of grades, since truck speed reduction on an ascending grade is the most important factor in geometric design [31] and therefore affects route choice. As no trucks were allowed to enter the studied area, this attribute was excluded. Concerning surrounding views, since the whole studied area was located in the residential and commercial district, there was no discernible major variance in views and perspectives and therefore this attribute was also ignored. This parameter can be studied where there are two or more alternative links that connect two certain points to each other and all of these links are going through different environments. 4.2 Discretization of attributes Having established the attributes, the essential problem now is how to convert these continuous attributes into discretized ones, because the Rough Sets Theory cannot be used to handle continuous attributes, which is a disadvantage of this method. It means that these attributes must first be converted into categorical data by means of an adequate codification. In most cases, boundary values to divide these attributes into disjoint intervals corresponding to different states are selected by the judgments of the researcher, depending on his/her experience, reasoning and perception. In the case of inexperience in the required field, some other discretization methods must be applied. There are various discretization methods that can be used, such as equal-width-intervals, equal-frequencyintervals [32], Minimal Entropy Method [33] and fuzzy discretization approaches [34,35]. When the subintervals for the discretization are specified by a domain expert using his/her judgement, or using norms established in the subject domain, they are called ‘expert discretizations’. On the other hand, when they are defined automatically, they are called ‘automatic discretizations’ [36]. As a result of discretization, the precision of the original data will be decreased but its generality will be increased [10]. In one research project, Guan et al. [37], instead of utilizing discretization methods, established a tolerance Rough Sets model based on similarity of different objects, which was used to compute optimal decision rules and reduce continuous valued decision information systems. This approach could prevent the loss of information, and effectively revealed the knowledge hidden in continuous valued decision information systems. In this paper, the authors will try to discretize continuous attributes mostly using perception and experiments based on logical reasoning. For example, dividing the distinct area into subareas and harmonic regions is done using some theoretical concepts such as land use and areal extent of the subareas. These subdivisions are shown in Figure 1. Movement velocity in routes as a continuous attribute is discretized using experimentation and logic. Since average walking speed in traffic studies usually counts as 5 km/h, so the first interval we defined is 0-5 km/h. Other intervals are calculated by using local surveys and speed limits on the routes of the studied area. Trip time, trip costs, number of signalized intersections and a few other attributes have been discretized by the same approach. The basic criterion for discretization of trip mode was mode availability in the studied area. These classification exercises resulted in a decision table, in which all objects are subdivided into distinct categories for each relevant attribute, and for each of these categories a number has been assigned. The categories used and their related numbers are listed in Tables 1 and 2. We can substitute these associated codes for each investigated attribute to provide the information table in the next step. 4.3 Analysis using Rough Sets Theory After the pre-collection activities are fully completed (determination and discretization of decision and condition attributes), data and information about these parameters must be collected. There are many methods of collecting primary data about a specific subject, such as questionnaires, interviews, observations, portfolios etc. [38]. Due to the innovative nature of the research and its subject area, and consequently a lack of available data about it from related organizations, its authors attempted to collect necessary information using questionnaires and interviews. Concerning the population of Semnan (about 190,000 people in 2010, when this survey was implemented), with a 95% confidence level and accepting a margin of error (degree of accuracy) of plus or minus 5 percent, it was necessary to have a sample size of 384 questionnaires. In order to do this, 500
10863
Shafabakhsh et al., 2012
participants were asked to choose the category of each attribute which has the most impact on their attitude toward choosing routes. Collecting of data required information, so that we could establish an information system. As previously stated, the information system is an information table in which each row indicates one of the samples that has been studied, each column showing one of the evaluated attributes in a categorized form. The last column implies the decision parameter. A portion of coded information table is shown in Table 3. Table 1. Categorization of investigated decision attribute Level 1 2 3 4
Trip is done in Region No.1 Trip is done in Region No.2 Trip is done in Region No.3 Trip is done in Regions No.1 and 2
Level 5 6 7
Trip is done in Regions No.2 and 3 Trip is done in Regions No.1 and 3 Trip is done in Regions No.1 and 2 and 3
Table 2. Categorization of investigated condition attributes Route Length (LEN) 1 Shorter than 1.5 km 2 1.5 to 3 km 3 3 to 4.5 km 4 Longer than 4.5 km Trip Costs (fare, toll, etc.) (CST) 1 0 dollar 2 Less than 0.5 dollar 3 0.5 to 1 dollar 4 More than 1 dollar Trip Time (TIM) 1 Less than 5 minutes 2 5 to 15 minutes 3 15 to 25 minutes 4 More than 25 minutes Trip Mode (MOD) 1 Walk 2 Bus 3 Taxi 4 Private car Route Velocity (VEL) 1 Less than 5 km/h 2 5 to 30 km/h 3 30 to 50 km/h 4 More than 50 km/h Traffic Congestion (CON) 1 High 2 Medium 3 Low 4 No effect Number of Vehicle Changes (NVC) 1 0 time 2 1 time 3 More than 1 time
Route Queue (QUE) 1 High 2 Medium 3 Low 4 No effect Pavement Condition and Quality (PAV) 1 High-quality pavement 2 Medium-quality pavement 3 Low-quality pavement 4 No effect Needed Maneuvers of Route (MAN) 1 High 2 Medium 3 Low 4 No effect Number of Crossed Signalized Intersections (NSI) 1 0 2 1 3 2 4 More than 2 Route Reliability (REL) 1 High 2 Medium 3 Low 4 No effect Route Accustomization (ACC) 1 High 2 Medium 3 Low 4 No effect
Applying Rough Sets analysis to this data results in many outputs being be obtained; among them the three most important results with regard to this research are reducts, core and accuracy and quality of approximation. 1) The reducts are combinations of condition attributes (independent variables) that can appropriately explain the decision attribute (dependent variable), without needing any other explanatory attributes. Although the most accurate set of attributes is the set that includes all affecting parameters, these sets can describe the decision attribute with a high level of acceptable accuracy and quality of approximation. These reducts are shown in Table 4. In this research, 5 reducts have been derived from the information table. 2) The core is the combination of attributes in the information system that is present and common among all the reducts. These attributes are so important in an information system that without them it is impossible to attain the highest quality of approximation with the remaining attributes. In this research, as Table 4 exhibits, these attributes are Route Length, Trip Time and Pavement Condition and Quality. Route Length, Trip Time and Trip Cost are the three criteria that have been determined as the most important factors influencing trip assignment in transportation studies. Accordingly, many conventional trip assignment models have tried minimizing (or optimizing) one or more of these factors as their policy. The inclusion of these Route Length and Trip Time as core can strengthen our results and show that in the majority of road users’ opinion, time and length of route are determinative.
10864
J. Basic. Appl. Sci. Res., 2(11)10859-10868, 2012
Sample number
LEN
CST
TIM
MOD
VEL
CON
NVC
QUE
PAV
MAN
NSI
REL
ACC
Decision attribute
Table 3. A portion of coded information
1 2 3 4 5 6 7 8 9 10 11 12 13 14 15
2 3 3 2 1 4 2 3 4 4 1 2 3 1 3
1 2 3 3 2 4 2 4 3 4 2 2 3 1 3
2 3 2 3 2 4 2 3 2 2 1 3 3 2 2
1 3 3 3 2 3 2 4 3 4 2 4 3 1 3
1 3 3 3 2 4 2 4 2 4 2 2 3 1 3
4 2 3 1 1 2 2 2 3 3 3 2 4 4 2
1 1 1 2 1 3 1 1 1 1 1 1 2 1 1
4 3 3 2 1 4 2 2 3 2 4 2 4 4 3
4 2 2 1 2 1 2 1 3 4 4 4 3 4 3
4 2 3 2 1 2 1 2 2 4 3 2 2 4 2
2 3 4 3 3 4 3 4 4 4 4 1 3 2 3
2 1 2 1 2 1 2 3 3 3 2 1 2 4 1
1 1 1 2 1 3 2 1 2 2 1 4 1 2 2
2 4 5 5 3 6 4 5 7 6 1 5 4 2 4
Table 4. Reducts and Core Reducts Set no. 1 Set no. 2 Set no. 3 Set no. 4 Set no. 5 Core
{LEN,TIM,CON,PAV,ACC} {LEN,CST,TIM,NVC,PAV} {LEN,TIM,VEL,PAV,NSI} {LEN,TIM,MOD,QUE,PAV} {LEN,CST,TIM,PAV,MAN} {LEN,TIM,PAV}
3) The accuracy and quality of approximations are also important results, and the values obtained are given in Table 5. For all classes of decision attribute, the accuracy is 1. Moreover, the accuracy and quality of approximation are equal to 1, which is the maximum possible value which can be obtained. This means that based on the attributes defined in the information table and studied in this research, the choice of route by road users (decision attribute) can be confidently estimated. Table 5. Accuracy and quality of the classification of trip assignment levels Trip assignment level Accuracy 1 1 2 1 3 1 4 1 5 1 6 1 7 1 Accuracy of approximation:1 Quality of approximation: 1
5. Regression Analysis In this section, the authors attempt to determine the existing relationship between the decision and condition attributes using statistical methods, in this case using a Regression analysis. In general, Regression analysis in statistics is used to determine which independent variables are related to the dependent variable, and to explore the forms and level of these relationships. We must state that this is not a validation test, because several research projects have already demonstrated the accuracy of results that have been derived from Rough Sets Theory. Following this attempt, Multiple Linear Regression (MLR) can be applied to determine the set of condition attributes on which the decision attribute is mostly dependent. MLR is an analytical method widely used to understand the linear relationship between a dependent variable (also called predictand) and one or more independent variables (also called predictors). In other words it discovers which among the predictors are related to predictand and determines the forms of relationships that may exist. There are various techniques and criteria such as t-tests, adjusted R-square and the Akaike Information Criterion (AIC) [39] that can determine the choice of independent variables. Accepting R-square (R2, coefficient of determination) as our criterion and using
10865
Shafabakhsh et al., 2012
stepwise regression, we found that Route Length, Trip Costs, Route Velocity and Pavement Condition and Quality are the most effective factors on road users’ choice behavior. The obtained results are shown in Table 6. It is observed that by adding and replacing other additional independent parameters to this set of attributes, slight changes occur to the value of R2. These changes are insignificant and can be neglected. In other words, these independent parameters have a high value of correlation with the dependent value, whilst not being highly dependent on each other. Table 6. Comparison between Rough Sets analysis and Regression analysis Algorithm
R2
Accuracy of approximation 1 1 1 1 1 0.67
{LEN,TIM,CON,PAV,ACC}* 77.3 {LEN,CST,TIM,NVC,PAV}* 79.4 {LEN,TIM,VEL,PAV,NSI}* 78.6 {LEN,TIM,MOD,QUE,PAV}* 79.1 {LEN,CST,TIM,PAV,MAN}* 78.7 {LEN,CST,VEL,PAV}** 81.4 Note: *Algorithms resulted from Rough Sets analysis **Algorithm resulted from Regression analysis
Quality of approximation 1 1 1 1 1 0.81
6. DISCUSSION OF RESULTS In previous sections, we attempted to identify the most important parameters affecting trip assignment process and choice behavior of road users among a set of all the affecting parameters. Applying Rough Sets analysis and Regression analysis, these necessary attributes were identified. The results of these investigations are listed in Table 6, where a set of attributes derived from both of the aforementioned analyses are recorded. These sets of attributes can also be called algorithms. Some of the identified attributes in these algorithms are those that play a key role in trip assignment models. As can be seen in Table 6, the difference between the R2 resulting from Rough Sets analysis and that from the Regression analysis is approximately less than 3 percent; this is insignificant and can be neglected (as we accepted R2 as our criterion to recognize affecting parameters in stepwise regression, it seems logical to have higher R2 value than that from the Rough Sets analysis). Referring to this comparison, it can be concluded that algorithms resulting from Rough Sets analysis enjoy an appropriate coefficient of determination (and also an appropriate correlation coefficient) in estimating the choice of road users. Other criteria that can be examined are accuracy and quality of approximation. Rough Sets Theory uses these criteria to determine the most affecting set of condition attributes. These values show how accurately and carefully the condition attributes can explain the decision attribute in the information system. This means the accuracy and quality of evaluated sets can be estimated by the aforementioned criteria. Therefore these values were calculated for all algorithms derived from both Regression and Rough Sets analyses. The results are shown in Table 6. Comparing values reveals that the algorithm obtained from stepwise regression has lesser values of accuracy and quality of approximation than those obtained from Rough Sets analysis. The difference between accuracy and quality of approximation in sets resulting from Rough Sets analysis and stepwise linear method are 33% and 19% respectively, which shows a considerable difference between the results of the two methods. On the basis of aforementioned results, it can be confidently concluded that the set of attributes obtained from Rough Sets analysis has a proper R2 value and has the highest accuracy and quality of approximation, in comparison with the set of attributes resulting from Regression analysis. Hence, applying Rough Sets analysis to extract the relationship between independent variables separately, and between independent variables and dependent variables to find the most important set(s) of parameters describing dependent variables, is highly recommended. 7. Conclusions The goal of this research has been to discover the most important parameters affecting the trip assignment process and choice of route by road users. To this end, the decision table was established as a first step, where we attempted to recognize affecting parameters and adapt them to local conditions. Next, using expertise and theoretical concepts, continuous attributes were discretized to disjointed ones, and then, data about these attributes was collected. The Rough Sets Theory and Multiple Linear Regression (MLR) were used to get the final results. Finally, a comparison between these results was conducted. Concerning two criteria that have been studied, the R2 value and the accuracy and quality of approximation, the main findings are as follows: Rough Sets analysis offers more accurate and reliable results than that of Regression analysis. We can therefore discover the most affecting independent parameters more accurately using Rough Sets Theory.
10866
J. Basic. Appl. Sci. Res., 2(11)10859-10868, 2012
Applying Rough Sets analysis, we recognized three attributes (Route Length, Trip Time and Pavement Condition and Quality) as core attributes. This means that in the studied area, these factors are the main factors affecting the choice behavior of road users. Now, here is a question. What is the importance of these findings and in general, the importance of these reducts? The answer is that we can now take advantage of these attributes to make new, more reliable and more flexible trip assignment models, where qualitative parameters are considered in addition to quantitative parameters. Moreover, they can be used to improve the flow of traffic in poor traffic conditions. By changing the values of all parameters in a certain set of attributes, we can transfer traffic load from one route to another alternative route within a traffic network.
REFERENCES 1. Sikder, I. U. and T. Munakata, 2009. Application of rough set and decision tree for characterization of premonitory factors of low seismic activity. Expert Systems with Applications, 36 (1): 102-110. 2. Wang, X., F. He and L. Liu, 2007. Application of Rough Set Theory to Intrusion Detection System. IEEE International Conference on Granular Computing (GRC 2007), pp: 562. 3. Peters, G., R. Tagg and R. Weber, 2008. An Application of Rough Set Concepts to Workflow Management. In the Proceedings of Rough Sets and Knowledge Technology (RSKT) Third International Conference, pp: 715-722. 4. Nomura, S. and Y. Kudo, 2009. An Application of Rough Set Analysis to a Psycho-Physiological StudyAssessing the Relation Between Psychological Scale and Immunological Biomarkeri. Journal of Advanced Computational Intelligence and Intelligent Informatics (JACIII). 13 (4): 352-359. 5. Shafahi, Y. and H. Ramezani, 2007. Application of Fuzzy Theory for Traffic Assignment. In the Proceedings of the 18th IASTED International Conference on Modeling and Simulation, Montreal, QC, Canada, pp: 604608. 6. Varia, H. R. and S. L. Dhingra, 2004. Dynamic User Equilibrium Traffic Assignment on Congested Multidestination Network. Journal of Transportation Engineering, 130 (2): 211-221. 7. Pawlak, Z., 1982. Rough sets. International Journal of Computer and Information Sciences, 11: 341-356. 8. Pawlak, Z., 1991. Rough Sets: Theoretical Aspects of Reasoning About Data, Dordrecht. Kluwer Academic Publishers. 9. Kim, K. J. and I. Han, 2001. The Extraction of Trading Rules From Stock Market Data Using Rough Sets. Expert Systems, 18 (4): 194-202. 10. Tay, F. E. and L. Shen, 2002. Economic and financial prediction using rough sets model. European Journal of Operational Research, 141 (3): 641-659. 11. Pawlak, Z. and A. Skowron, 2007. Rough Sets: Some extensions. Information Sciences, 177 (1): 28-40. 12. Tripathy, B. K., 2009. Rough Sets on Fuzzy Approximation Spaces and Intuitionistic Fuzzy Approximation Spaces. In Abraham, A., R. Falc and R. Bello, Rough Set Theory: A True Landmark in Data Analysis. Berlin: Springer-Verlag, pp: 6-7. 13. Dimitras, A. I., R. Slowinski, R. Susmaga and C. Zopounidis, 1999. Business failure prediction using rough sets. European Journal of Operational Research, 114: 263–280. 14. Greco, S., B. Matarazzo and R. Slowinski, 1998. A new rough set approach to evaluation of bankruptcy risk. In: Zopounidis, C. (Ed.), Operational Tools in the Management of Financial Risks, Dordrecht: Kluwer Academic Publishers, pp: 121–136. 15. Pawlak, Z., 1997. Rough sets. In: Lin, T.Y., Cercone, N. (Eds.), Rough Sets and Data Mining. Dordrecht: Kluwer Academic Publisher, pp: 3–8. 16. Attoh-Okine, N.O., 1997. A Rough-Set Application to Data Mining Principles in Pavement Management Database. Journal of Computing in Civil Engineering, 11 (4): 231-237. 17. Nijcamp, P. and G. Pepping, 1998. Meta-Analysis for Explaining the Variance in Public Transport Demand Elasticity in Europe. Journal of Transportation and Statistics, 1 (1): 1-14. 18. Attoh-Okine, N.O., 2002. Combining Use of Rough Set Theory and Artificial Neural Networks in Doweled Performance Modeling: A Hybrid Approach. ASCE Journal of Transportation Engineering, 128 (3): 270-275.
10867
Shafabakhsh et al., 2012
19. Hampton, J., 1998. Rough set theory: The basics (part 3). Journal of Computational Intelligence in Finance, 6 (2): 35–37. 20. Yasdi, R., 1995. Combining Rough Sets Learning and Neural Learning method to deal with uncertain and imprecise information. Neurocomputing, 7: 61–84. 21. Hampton, J., 1997. Rough set theory: The basics (part 1). Journal of Computational Intelligence in Finance, 5 (6): 25–29. 22. Hampton, J., 1998. Rough set theory: The basics (part 2). Journal of Computational Intelligence in Finance, 6 (1): 40–42. 23. Komorowski, J., Z. Pawlak, L. Polkowski and A. Skowron, 1999. Rough sets: A tutorial. In: Pal, S.K., Skowron, A. (Eds.), Rough Fuzzy Hybridization: A New Trend in Decision making. Springer, Singapore, pp: 3–98. 24. Shen, L., F. E. H. Tay, L. Qu and Y. Shen, 2000. Fault Diagnosis Using Rough Sets Theory. Computers in Industry, 43 (1): 61-72. 25. Gento, A. M. and A. Redondo, 2003. Rough Sets and Maintenance in a Production Line. Expert Systems, 20 (5): 271-279. 26. Gento, A. M., 2004. Decision Rules for a Maintenance Database. Journal of Quality in Maintenance Engineering, 10 (3): 210-220. 27. Baaijens, S. and P. Nijkamp, 2000. Meta-Analytic Methods for Comparative and Exploratory Policy Research: An Application to the Assessment of Regional Tourist Multipliers. Journal of Policy Modeling, 22 (7): 821-858. 28. Nicholson, J. and M. Bell, 2003. Assessing transport reliability: Malevolence and user knowledge. In M. Bell and Y. Iida (Eds.), The Network Reliability of Transport: In the Proceedings of the 1st International Symposium on Transportation Network Reliability. Pergamon: Elsevier Science Ltd., pp: 1-22. 29. Yang, H., K. K. Lo and W. Tang, 2000. Travel time versus capacity reliability of a road network. In M. Bell and C. Cassir (Eds.), Reliability in Transport Networks. Hertfordshire: Research Studies Press. 30. Tilahun, N. and D. Levinson, 2010. A Moment of Time: Reliability in Route Choice using Stated Preference. Journal of Intelligent Transportation Systems, 14 (3): 179-187. 31. Mn/DOT, 2004. Alignment and Superelevation. In: Road Design Manual. 32. Shan, N., H. J. Hamilton, W. Ziarko and N. Cercone, 1996. Discretization of continuous valued attributes in classification systems. In the Proceedings of the Fourth International Workshop on Rough Sets, Fuzzy Sets and Machine Discovery RFSD’96, Tokyo, Japan, pp: 74–81. 33. Fayyad, U. M. and K. B. Irani, 1992. On the handling of continuous-valued attributes in decision tree generation. Machine Learning, 8 (1): 87–102. 34. Roy, A. and S. K. Pal, 2003. Fuzzy discretization of feature space for a rough set classier. Pattern Recognition Letters, 24 (6): 895–902. 35. Tsai, Y. C., C. H. Cheng and J. R. Chang, 2006. Entropy-based fuzzy rough classification approach for extracting classification rules. Expert Systems with Applications, 31: 436–443. 36. Susmaga, R., W. Michalowski and R. Slowinski, 1997. Identifying regularities in stock portfolio tilting. Interim Report, IR-97-66, International Institute for Applied Systems Analysis. 37. Guan, Y., H. Wang, Y. Wang and F. Yang, 2009. Attribute reduction and optimal decision rules acquisition for continuous valued information systems. Inf. Sci., 179 (17): 2974-2984. 38. Zemkem R. and T. Kramlinger, 1986. Figuring Things Out: A Trainer’s Guide to Needs and Task Analysis. Reading, MA. Addison-Wesley Publishing, US. 39. Akaike, H., 1974. A New Look at the Statistical Model Identification. IEEE Transaction on Automatic Control, 19 (6): 716-723.
10868