Missing:
The mathematical fractal approach in calculating visual complexity and its influence on the aesthetic perception of residential facades Jaikumar Ranganathan1 and Dr. Gnanasambandam Subbaiyan 2 research Scholar, 2 Professor, Department of Architecture, National Institute of Technology, Tiruchirappalli, India 1
Abstract Fractal Dimension is a quantitative computational method to evaluate visual complexity in design (Ostwald 2009).The inverted ‘U’curve relationship between aesthetic preference and visual complexity indicated that People have a high aesthetic preference for designs which have intermediate visual complexity. The research focuses on the aesthetic preference of residential facades and evaluates the influence of visual complexity on aesthetic preference. Fractal dimension is calculated for residential façade designs, and the relationship between aesthetic preference and fractal dimension is established. R.P.Taylor through his experiments proved that people aesthetically have a high preference for designs falling with the fractal range of 1.3 to 1.5(Universal aesthetic of fractals- Spehar et al, 2003).The study found out that aesthetic preference increases with increase in the fractal dimension of residential façade designs. When the façade designs are evaluated by expert architects using Aesthetic measure formula the result indicates the inverted U curve relationship between aesthetic measure and fractal dimension of residential façade designs (Birkhoff 1933; Megahed 2010). Introduction Nature exhibits mathematical principles. The magic of mathematics can be seen in flowers, sea shells, leaves, branching of trees, mountain ranges, human body proportion, in the form of galaxies etc. Counting of petals in flowers is in Fibonacci series, Seashell and human body follow golden proportion, mountain ranges and branching of trees follows fractal mathematics by nature (Omotehinwa T. O and Ramon S.O 2013; Salingaros 2012; Taylor 2006; Benoit Mandelbrot 1977). Patterns in nature exhibit fractal geometry and the main source of inspiration for Designers and Architects is nature which is manifested in the form of Architecture and product design. Architects and Artists during Renaissance used a golden proportion to achieve beauty in the work of Art and Architecture. Leonardo Da Vinci studied the golden proportion of human body ‘The Vitruvian man’ and applied in his works, thereby achieving beauty in the eye of the beholder. Renaissance Architects like Andrea Palladio used Golden rectangle in his design of Villa Rotonda in Vicenza, Italy and modernist Architect like
Le Corbusier used the modular system of golden rectangle in his designs, especially in designing the capital complex at Chandigarh, India. Architectural forms, including its scale and proportion inspired by nature, can play an important role in overall architectural design composition. Berlyne (1974, 1977) stated that visual complexity is a major parameter which influences the aesthetic perception of people. Berlyne (1974) established the inverted ‘U’ Curve relationship between aesthetic preference and visual complexity. Aesthetic preference increases with increase in visual complexity and peaks at moderate visual complexity, and then aesthetic preference starts decreasing with increase in visual complexity. In this research,the hypothesis proved by Berlyne has been tested for residential façade designs through quantitative mathematical approach. First, through computational fractal mathematics using the Box-Counting method in Benoit 1.3(fractal analysis software), the visual complexity of residential facades are calculated and correlated with aesthetic preference measured using semantic questionnaire survey. Secondly Birkhoff's aesthetic measure formula subsequently modified by Megahed (2010) was used to evaluate architectural design using principles of design. The research mainly aims at mathematically proving the relationship between aesthetic preference and aesthetic measure with respect to fractal dimension of Architectural façade designs which has been experienced in our day to day life. Mathematics in Nature and Architecture and its influence in Aesthetic appreciation In nature, flowers exhibit Fibonacci series, discovered by Leonardo Fibonacci. For example, if the spirals in sunflower are counted in clockwise and anticlockwise, this will lead to the subsequent Fibonacci number. The Fibonacci sequence of Numbers “Starting with 1, each new number in the series is simply the sum of the two before it.” (R. F. Borges,2004) Fibonacci series 0,1,1,2,3,5,8,13,21,34,55,89,144,233,377,610,987,1597 etc. The ratio of two successive numbers in Fibonacci’s series are as follows 1/1=1; 2/1=2; 3/2=1⋅5; 5/3=1.666; 8/5=1.6; 13/8=1.625; 21/13=1.61638; 34/21=1.61904; 55/34=1.6176.; 610/377=1.6180, 1597/987=1.6180. The ratio converges to a value very close to the golden ratio(R. F. Borges,2004). The Golden ratio can be seen in the development of spiral in conch and seashells.
Fig 1: Consecutive Fibonacci numbers found in the bi-directional spiral growth pattern of seed in sunflower plants (Source: Fibonacci Numbers and Golden Ratio in Mathematics and Science, by Omotehinwa T. O and Ramon S.O, 2013)
Fig 2: Golden spiral in Sea Shell following the Fibonacci sequence ( Source: http://design.zemniimages.info/golder-ratio/ and https://www.visindavefur.is/svar.php?id=66802 retrieved on 10.5.2018) The Golden proportion 1:1.618 is extensively used by Architects to make the building that looks aesthetically appealing (Shekhawat, 2015). The construction method of a golden rectangle is shown in figure 3a, and the golden spiral achieved by repeating the inward construction of golden rectangle and the method is an iterative process.
Fig 3a Construction method of the golden rectangle ( Source: http://umk-javorova.blogspot.in/20 15/01/choo sing-canvas-shap es-2-golden-ratio.html and https://en.wikipedia.org/wiki/Golden_rectang le retrieved on 10.5.2018)
Fig 3b The golden mean proportion: a/b= (a+b)/a=1.61803. (Source: https://sq.wikipedia.org/wiki/Skeda:Golden_ratio_line.svg retrieved on 10.5.2018 )
Fig 3c By repeating the golden rectangle construction inwards, the golden spiral is achieved, and the method is an Iterative process. (Source: https://in.pinterest.com/pin/546765210993403457/ retrieved on 10.5.2018)
The growth pattern generated in nature using iterative process is known as fractals. Fractal is a natural phenomenon, in which whole to part and parts of the whole are same. Fractal patterns are depicted by self-similarity repetition in increasing or decreasing order of magnificence scale (Joye 2007; Md Rian 2007; Salingaros 2012). The fractal geometry is formulated by Benoit Mandelbrot in 1970’s using a recursion formula. The mathematical approach of creating fractal geometry is known as iteration. Different rules of iteration or recursion formula create different fractal patterns. In nature fractal characteristics are exhibited in fern leaf, mountain ranges, branching of trees and rivers, the pattern in sunflower and conch etc. (Joye 2007; Taylor 2006; Salingaros 2012).
Fig 4 Fern Leaf depicting fractal nature (photography by Author)
Fig 5: Mandelbrot set created using recursive formula (Source: Mandelbort, 1977) The iterative process can be seen in Sierpinski Gasket and carpet introduced by great mathematician Maclaw Sierpinski (1916).
Fig 6 Sierpinski Gasket and Carpet demonstrating the iterative process (Source: Choas and fractals , Peitgen , Jürgens , Saupe, 2004)
To demonstrate the iterative process in three dimensions, the model of tetrahedron has been interlocked with another tetrahedron of the same size. By iterating the form with further interlocking newly emerged tetrahedrons with similar size tetrahedrons and by repeating the process the third time the tetrahedron transforms into a hexahedron(Cube). (See fig 7)
Fig 7: Iterative process demonstrated using the geometric form (Source: Choas and fractals , Peitgen, Jürgens, Saupe, 2004) Fractal geometry and Fibonacci series by nature are interrelated with each other to create iterative designs which are aesthetically appealing because of visual order in complexity and golden proportion followed within the design. For example Villa Rotonda by Andrea Palladio. (Shekhawat ,2015)
Fig 8 A golden Section diagram of Villa La Rotonda and view of Villa Rotonda in Vicenza (Source: Shekhawat ,2015)
The significance of fractal characteristics has been demonstrated in historical Architecture. The Shikara of Kanderiya Mahadev temple, Khajuraho, India depicts fractal characteristics by self-similar repetition of the main tower in varying scales using iterative principle in built form ( MD Rian 2007; Joye 2007). Gothic cathedrals also exhibit self-similarity and repetition of spires and pinnacles which appear in different scales thereby demonstrating fractal nature in Gothic Architecture (joye 2007).
Fig 9: The Hindu temple vimana uses an iterative process of self –similar repetition of form in varying scales (Source: joye 2007) Postmodern, contemporary and parametric Architecture uses fractal principles in design. Federation Square, Melbourne designed by Lab Architecture Studio used Penrose tiling approach for the façade design. It is generated by iterative function system in which five triangles are used to create a panel, and five panels are combined together to form a construction module. Thus creating a fractal pattern on the facades of buildings in the federation square, Melbourne (Joye 2007).
Fig 10 Federation Square, Melbourne (Source: Connor)
Fractal pattern and designs are measured for visual complexity using fractal dimension. Michael J Ostwald one of the key researchers in the field of fractal Architecture has explored the influence of visual complexity in Architectural Design. Ostwald (2008) compared the fractal characteristics of a masterwork of F L Wright’s Robie house and Le Corbusier’s Villa Savoye. The fractal dimension of Robie house was found to be higher than the fractal dimension of Villa Savoye. Ostwald(2008) concluded that F L Wright’s work is visually complex than Le Corbusier’s work and further stated that organic Architecture has more fractal nature than modern Architecture (Ostwald, 2009). Ostwald (2012) studied the impact of significant lines on fractal dimension using Villa Jaquemet, one of the earlier works of Le Corbusier as an example. The building detail is increased in stage wise and fractal dimension is calculated for each stage starting with the silhouette of the building, building mass, building design, detail design, surface finish and ornamentation details increased stepwise. It is noticed that the fractal dimension increases with increase in details ( Ostwald, Vaughan, 2012).Naturally fractal art , architecture and landscape influence people’s emotions and aesthetic perception (Taylor, 2004, 2006) Influence of Fractal Dimension D on people’s aesthetic preference Natural Scenes can evoke various emotions in the observer. By looking at a natural scene, one can get overwhelmed, mesmerized by the beauty and the wonderful creation of nature. Artwork inspired by nature can induce similar emotions on the observer. For example, Claude Monet’s water Lilies calm the observer, while Vincent Van Gogh’s sunflower electrifies the observer (Taylor, 2006). The aesthetic preferences based on the fractal dimension of artworks were carried out, and people prefer artworks with fractal dimension ranging from 1.3-1.5. Fractal artworks with fractal dimension 1.3-1.5 have the highest alpha frequency activity in the frontal brain areas. Alpha is considered to show a wakefully relaxed state and it is a characteristic commonly found in the EEG of a person sitting with closed eyes and attention directed inward. (Taylor 2003, 2006; Hagerhall 2015). ‘Fractal nature of artwork reduces the physiological stresses’ (Taylor ,2006) ; this is confirmed by an experiment conducted by NASA. The participants were induced with stress by giving three tasks namely creative thinking, Logical problem solving and mental arithmetic. The stress created by mental work is measured by skin conductance (electrodermal activity) a well-established method to observe physiological conditions. The participants unconsciously noticed the fractal artwork on the wall. The result indicates that artwork with fractal nature reduces stress. It is established that aesthetic preference of fractal images has been categorised into three ranges with respect fractal dimension: 1.1– 1.2 low preference, 1.3–1.5 high preference and 1.6–1.9 low preference. (Spehar et al 2003).
Natural landscape images were used for evaluation of aesthetic preference by Hagerhall (2004).Using eye-tracking, it is found that observer’s eye fixes on the silhouette of a landscape scene. Hence, the landscape silhouettes were tested for aesthetic preference. The result revealed that people visually prefer landscapes silhouettes with fractal dimension 1.3 which is within the preferred fractal range of 1.3-1.5 (Hagerhall et al., 2004). People experience urbanscape with landscape and buildings in the day to day life. Cooper studied fractal nature of streetscape skyline with landscape and built form silhouette. The fractal dimension of streetscape skyline increases as the percentage of vegetation increases and fractal dimension decreases as the flat roofline increases. But the study is not carried out for aesthetic preference of streetscape skylines which are experienced every day (Cooper, 2003). People perceive buildings in close proximity, when they are walking on the streets. Hence, the visual complexity of the façade would certainly influence the aesthetic preference of people. It is necessary that people’s aesthetic preference of building facades based on visual complexity in terms of fractal dimension needs to be established and find whether the mid-range fractal dimension of building facades influences the aesthetic preference of people.
People’s perception of building facades based on the visual complexity Imamoglu (2000) studied the visual complexity of eight traditional and eight modern houses and categorized into minimum, intermediate and maximum complexity. Architecture and Non-Architecture students of Turkish University rated the buildings in seven-point semantic differential scales, and the result revealed that there is an inverted U Curve relationship existed between complexity and preference. The majority of the participants preferred the buildings with intermediate complexity than more or less complex buildings. Similarly, Akalin (2009) also studied the aesthetic preference of residential facades based on visual complexity using bi-polar adjectives rated on a fivepoint semantic differential scale. The research concludes the Berlyne’s (1974) ‘inverted U curve’ hypothesis between preference and complexity.The observer aesthetic preference peaks up to moderate visual complexity and beyond which the aesthetic preference decreases with increase in visual complexity (Akalin, 2009).
The aesthetic preference based on visual complexity can be influenced by educational background, gender, cultural background etc. Hershberger (1969) conducted a semantic questionnaire survey on buildings with Architects and non-Architects. The survey showed a significant difference in the preference of Architects due to their training and experience. Groat (1982) used modern and postmodern building designs to be categorized using multiple sorting techniques, in which layperson sorted based on their preference and Architects sorted based on modern, postmodern style, form, and historical significance. Devlin (1990) compared the perception of two Chicago office buildings between Architects and Layperson. Layperson’s evaluation was descriptive whereas Architects evaluation was abstract and conceptual. Nasar (1997) argued that Architects should learn to appreciate the design taste and aesthetic preference of nonArchitects. Stamps and Nasar (1997) have described a aesthetic preference experiment on 35 single-family house facades (regarding popular and high styles) as judged by 82 respondents in two different cities. The results of this study indicated that the correlation between males and females was 0.94. Imamoglu (2000) showed that females and males significantly different in their aesthetic preference based on the complexity of Residential facades. Females generally perceived house facades as more complex than males. Aysu Akalin (2009) in the study of residential facades established that male participants seemed to show more positive opinion than female participants in analyzing most of the attributes of façade design especially visual complexity. Hence, visual complexity is one of the main factors contribute in evaluating the aesthetic preference of Architectural façade design. In the recent research by Taylor et al. (2016) states that fractal pattern with symmetry and recursion increases aesthetic preference with an increase in visual complexity in the fractal pattern generated with a high level of symmetrical and complex recursive pattern .The research focuses on fractal Dimension and its impact on aesthetic preference and aesthetic measure of Architectural Design.
Research Design In this world everyone wants their home to be aesthetically appealing and appreciated to be a ‘beautiful Home’ by his or her friends and neighbours. It’s everyone’s dream to own a beautifully designed home, and the first impression is created by the front facade of the home. Hence, in this research residential façade designs were evaluated for aesthetic measure based on fractal dimension. An aesthetic measure of residential facades is calculated using modified Birkhoff’s aesthetic measure formulated by Megahed (2010) for Architectural design. The impact of fractal dimension on aesthetic preference and the aesthetic measure has been calculated mathematically. The research has been carried out among Architecture and Engineering students to know the influence of educational background on the aesthetic perception of building facades and also to check whether
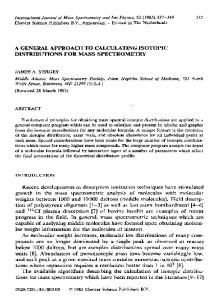
gender plays an important role in the evaluation of aesthetic preference and visual complexity of residential façade design. Residential façade designs in the format of orthographic drawings (elevations) were collected from various Architects in Tamilnadu (INDIA). The elevation drawings in jpg format are pre-processed using photoshop before calculating the fractal dimension. The images are converted to grayscale and resized to the same width of 18inch by height 14inch, and the resolution is set at 175 pixel/ inch. The images are positioned centrecentre with sufficient white space around, and the line weight is set at 1-pixel width as suggested by Ostwald (2016). The images are inverted from white on black to black on white and saved as a bitmap format accepted by Benoit 1.3commercially available fractal analysis software used in the research. The softwares which calculates fractal dimension using the inbuilt box-counting method are Benoit 1.3 and Archimage. But,Benoit 1.3 has been used in the research because it is widely used by many researchers and cited in their research work . Calculation of Fractal Dimension using Box-counting method In the box-counting method, the image of the front elevations of residential façades is overlaid on a grid. Each grid is analyzed to determine whether any line is present within the grid and the boxes with details are counted N (S1).Next, a smaller scale grid is placed over the same design, and again the boxes containing details are counted N (S2). A comparison is then made with the number of boxes with details in first grid N (S1) and a number of boxes with details in second grid N (S2). By plotting a log-log graph log N(S) vs log N(1/S) for each grid size. This leads to an estimation of the fractal dimension of the design. Fractal Dimension D = (Log Ns2 – Log Ns1) / (Log (1/S2) - Log (1/S1)) Where S- Size of the grid Ns – Number of boxes with detail 1/S - Number of boxes at the base of the grid. (Ostwald 2007)
Fig 11. The Box-counting process which is iterative in nature to calculate Fractal Dimension ( Source: Michael Ostwald, 2007)
Totally 6 Residential façade designs were selected based on low, mid and high fractal dimension for evaluation of aesthetic preference Fractal Dimension Sl.no. Building Diagram/ Picture of Fractal Fractal value Facade Building Facade dimension group 1 Picture P1 1.52 2
2
Picture P2
1.26
1
3
Picture P3
1.61
3
4
Picture P4
1.19
1
5
Picture P5
1.61
3
6
Picture P6
1.44
2
Note: The images are presented in mixed order of fractal value to get genuine feedback from the participants.
Quantitative assessment of aesthetic measure of residential façade designs The six residential façade designs with varying visual complexity determined by fractal dimensions were analyzed by seven expert Architects working in the Department of Architecture, National Institute of Technology, Tiruchirappalli for assessment of the aesthetic measure.
The Aesthetic Measure = Order / Complexity M = O / C
Where M is Aesthetic measure, O is Order and C is complexity The Order of architectural structures is computed by five items; Symmetry (S), Repetition (R), Equilibrium (E), Disposition (D), and Color harmony1 (H), Randomness is considered as a negative factor affecting Order (n.f.) (Arnheim, 1977) (Staudek, 1999) (Salingaros, 2007) O = S + R + E + D + H – n.f. Since: 0 ≤ O ≤ 10 Complexity is measured by Form complexity (F.C), Ornament (Orn), Silhouette differentiation (S.d), and Color Contrast (C.c). C = F.C. + Orn. + S.d. + C.c Since: 0 ≤ C ≤ 8 The residential façade designs are in line drawing format without the usage of colours. Hence, the colour factor has been removed from the formula.All the parameters or variables are rated in three-point scale varying from 0 to 2. 2 stands for higher level, 1 moderate level, and 0 lower level. If the aesthetic measure scores 0.125< M < 1 than the building is poor aesthetics and high level of excitement, 2< M