Proceedings of the International MultiConference of Engineers and Computer Scientists 2013 Vol I, IMECS 2013, March 13 - 15, 2013, Hong Kong
Application of Neural Networks in Bridge Health Prediction based on Acceleration and Displacement Data Domain Reni Suryanita and Azlan Adnan, Member, IAENG
Abstract—The health condition of the bridge can be predicted through sensors’ reading in bridge monitoring. The sensors measure the acceleration and displacement of bridge response. The data is sent to the local server through the data acquisition. Interpretation of the data applied neural network in the localized server system. This paper aims to define performance of the acceleration and displacement data domain as input in applied neural networks. The architecture of neural networks’ model used an input layer, one and two hidden layers with n neurons and an output layer. The input layer consists of time-acceleration domain and time-displacement domain of the bridge due to earthquake loads. Meanwhile, the output layer consists of bridge condition level which is determined using finite-element analysis software. The training activation used Gradient Descent Back-propagation and activation transfer function used Log Sigmoid function. The bridge condition is categorized in a range 0 to 3, which indicates the extent of bridge health condition ranging from safe to high-risk level. The case study is 3 spans of box-girder’s bridge subject to four earthquakes loads. The results showed that the prediction of bridge health condition based on displacement data domain with one hidden layer is more acceptable compared with based on acceleration. The comparison obtains the recommendation of the best of data reading from the sensors to predict the bridge health condition. The application neural networks in the bridge health prediction can help the authorities to know the condition of the bridge due to earthquake at monitoring time, as the repair and maintenance of bridges can be performed as early as possible before the bridge was damaged. Index Terms—neural networks, acceleration, displacement, bridge health condition.
I. INTRODUCTION
N
EURAL networks are computer processes that attempt to imitate the working process of human brain. The activity of neural networks associated with the use of intelligent. The learning mechanisms in neural networks exist to acquire the knowledge. The architectural model of neural networks has been classified as various types based on their training activation. The multi perceptron layers architectures are usually selected to solve many problems using neural networks. The neural networks have the ability Manuscript received December 24, 2012; revised January 28, 2013. Reni Suryanita is with the Civil Engineering Department - University of Riau, Jl. HR Subrantas Km.12,5 Pekanbaru 28293, Riau - Indonesia phone: +628127513783 e-mail: renisuryanita@ yahoo.co.id Azlan Adnan is with Faculty of Civil Engineering – University Teknologi Malaysia, 81310 Skudai Johor Bahru, Malaysia e-mail:
[email protected].
ISBN: 978-988-19251-8-3 ISSN: 2078-0958 (Print); ISSN: 2078-0966 (Online)
to model the non-linear relationship between a set of input variable and the corresponding outputs without the need for predefined mathematical equations. Furthermore, neural networks do not need prior knowledge of the nature to the relationship between the model inputs and corresponding outputs. Comparison to traditional methods, neural networks tolerate relatively imprecise, noisy or incomplete data. Approximate results are less vulnerable to outliers, have better been filtering capacity and more adaptive. This enables neural networks to overcome the limitations of the existing methods and successful in be applied on many problems within the field of Civil Engineering. The neural networks have been applied in Civil Engineering since the past decades. Reference [1] investigated the use of neural network in some Civil Engineering system. The training and testing process utilize actual field data as the input. The target output is the theoretical solution of the problem being analyzed. The results showed that the neural networks are reliable as well as the other conventional methods. Some other researchers interested to develop the neural networks’ algorithm despite their presently basic form at solving direct mapping problems. Therefore, currently the total of the applied neural networks in the Civil Engineering studies have increased[2]. Even in the bridge engineering field, many civil engineering researchers had applied the neural network in the latest research such as [3], [4], and [5]. However, there is a little discussion about which the best of both acceleration and displacement values for input data in neural networks, especially for bridge health prediction. Accordingly, the aim of this paper is to define performance of the acceleration and displacement data as an input domain in bridge health prediction due to an earthquake. As of, the civil engineer can make a recommendation to bridge authorities for the choice of optimal sensors. II. BRIDGE HEALTH CONDITIONS AFTER EARTHQUAKE Bridge’s structure needs to be observed periodically in the real time. In bridge health monitoring, the damage of the bridge can be known and detected early through data reading by the sensors. The acceleration and displacement data reading was sent to the local server through data acquisition. Interpretation of data reading used the neural networks in the localized server system. Several researchers observed the accelerations and displacements as the input data in neural networks, such as [4], and [6]. Reference [4] used neural networks to observe a bridge under dynamic load, especially general traffic load. The objective of the research is to estimate the bridge displacement which corresponds to the
IMECS 2013
Proceedings of the International MultiConference of Engineers and Computer Scientists 2013 Vol I, IMECS 2013, March 13 - 15, 2013, Hong Kong strain of the bridge. On the other hand [6] studied the acceleration based approach using neural networks. The objective of research is to predict the displacement of building response under earthquake excitation. The inputs data are the acceleration, velocity and displacement at ground and several stories of building. The others researchers investigated the application of neural networks in existing bridge evaluation such as [7], and detected a bridge damage such as [8] used frequencies and mode shapes as the input data. Studies about the application of neural networks on bridge structures under seismic have been conducted by [3], [9], and [10]. In structural dynamic, the response of the bridge due to earthquakes commonly is derived from (1)
[ M ]{Y&&} + [C ]{Y&} + [ K ]{Y } = −[ M ]{u&&g }
(1)
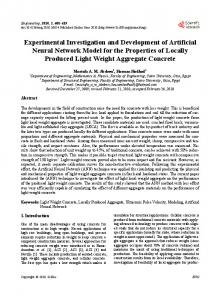
Fig. 1. The Fig.1 displayed the peak ground accelerations (PGA) of the earthquakes are 0.1539G (1.51 m/s2) for San Fernando earthquake, 0.8677G (8.51 m/s2) for New Zealand earthquake, 0.4731G (4.64 m/s2) for Lomaprieta earthquake, and 0.3803G (3.73 m/s2) for Landers earthquake. The acceptance criteria of pier damage based on structural performance levels in FEMA 356 [14]. The criteria are Immediate Occupancy (IO), Life Safety (LS) and Collapse Prevention (CP). The IO is defined as the structure still safe to occupy which only very limited structural damage has occurred after an earthquake. The risk of life-threatening injury is expected very low. The LS is defined as some structural element and component are severely damaged but the risk of life-threatening injury is expected low. The CP is defined as the structure is on the verge of partial or total collapse and significant risk of injury may exist.
where [M], [C] and [K] respectively is matrix of mass, damping and stiffness. Meanwhile Y&& , Y& , and Y individually is vector of acceleration, velocity, and displacement of a bridge response. Vector u&&g is acceleration of earthquake excitation. By using the uncoupling procedure, the modal equation of nth mode can be written as (2).
Y&& + 2ξ nωnY&n + ω 2Yn = − 1φ n u&&g
(2)
Displacement for each mode shown as (3)
y(t ) = ∑φnYn (t )
(3)
where ξ n , ω , and φn respectively are damping ratio, frequency and n number of mode shape. The acceleration is generated by second time derivative of displacement. The displacement values of a bridge response describe the performance of the bridge under an earthquake loading. In bridge monitoring, both of acceleration and displacement values can be resulted from measurement by sensors were installed. The acceleration and displacement values can also be produced from finite-element analysis using a computer program. The construction era of a bridge is a good indicator of likely performance, with higher damage levels expected in older construction than in newer construction [11]. The more ages of the bridge structure, the longer loading to have been accepted. Therefore, bridge structure monitoring is necessary done as periodically in order to know the bridge health condition at the given time. According to [12], damage of bridge structure is normally defined as the intentional or unintentional changes in material and geometric properties of the bridge, including changes in boundary or supporting conditions and structural connectivity, which adversely affect the current or future serviceability of the bridge. Damage can occur under large transient loads such as strong motion earthquakes and can also be accumulated incrementally over long periods of time due to factors such as fatigue and corrosion damage. In this paper bridge health condition is focused on the non linear behavior of piers due to earthquakes. The analysis of the simulation model used the finite-element software. Response acceleration data is adopted from [13] as shown in
ISBN: 978-988-19251-8-3 ISSN: 2078-0958 (Print); ISSN: 2078-0966 (Online)
Fig. 1. Response acceleration of earthquake data from PEER [13].
III. NEURAL NETWORK IN BRIDGE HEALTH PREDICTION This study used the Neural Network Back Propagation (BPNN) algorithms. The best performances of BPNN depend on the selection of suitable initial weight, learning rate, momentum, networks architecture model and activation function. The weight describes the acceleration or retardation of the input signals. The architecture model for this system has n number of input neurons, one and two hidden layers with n neurons and an output. The input networks consist of time-acceleration domain and timedisplacement domain of the bridge seismic response analysis. The numbers of input correspond to the numbers of sensor on the bridge monitoring. Meanwhile the output layer is the level of a bridge health condition due to an earthquake, which is resulted by finite-element analysis software. The architecture model of neural networks illustrates in Fig. 2.
Fig. 2. The architecture model of neural networks with 2 hidden layers in the system.
The training function used Gradient Descent Backpropagation to minimize the sum squared error (E) between
IMECS 2013
Proceedings of the International MultiConference of Engineers and Computer Scientists 2013 Vol I, IMECS 2013, March 13 - 15, 2013, Hong Kong the output value of neural network and the given target values. The total error is defined as (4). (4) E = 12 (t j − a j ) 2
∑ j∈ J
where tj denotes target value, aj denotes activation value of output layer, and J is set of training examples. The steps are repeated until the mean-squared error (MSE) of the output is sufficiently small. The final output is generated by a non linear filter Φ caller activation function or transfer function. The transfer function for this model used Log Sigmoid function, which has a range of [0,1] to obtain the output. This function is differentiable function and suitable used in BPNN multilayer as shown in (5).
a j = 1 (1 + e − anet , j )
acceptability. The bridge model in this study has been simulated to receive four excitations of earthquake in Fig. 1. Thereby, responses of bridge structure due to some earthquakes have applied as input in the training process. The damage of structure element from finite-element analysis is described in Fig. 4. The criteria of bridge damage is based on standard of Federal Emergency Management Agency [14]. Initial of B is described as operation level, which states transition from safe level to IO level. The IO is immediate-occupancy; LS is life-safety, and CP is collapseprevention. The level before damage is described with S (safe level). Fig.4 illustrates the point of high risk damage at the top of piers (CP level).
(5)
where l
a net , j = [ ∑ w ij a i ] + θ i =1
j
Each i represents one of the units of layer l connected to unit j and ɵj represents the bias. The weight, wij of networks has adjusted to reduce the overall error. The updated weight on the link connection the ith and jth neuron of two adjacent layers is defined as,
∆Wij = η (∂E / ∂Wij )
(6)
where, η is the learning rate parameter with range 0 to 1 and ∂E / ∂Wij is the error gradient with reference to the weight. In this study, input data has normalized by a linear normalization equation as follows: (7) zi' = ( zi − zmin ) ( zmax − zmin ) where is the normalized input values, zi the original data, zmax and zmin, respectively, the maximum and minimum values.
Fig. 4. Damage level of bridge model due to the excitation of Lomaprieta, 1989 earthquake
Fig.5 and Fig.6 show the response of the bridge model due to Lomaprieta earthquake. The acceleration and displacement response of the bridge is measured during 11.65 seconds at the point where sensor1 and sensor2 will be located. The damage level occurred after 9.25 seconds. This level consists of IO level (1st index), LS level (2nd index) and CP level (3rd index) respectively at 9.26, 11.05, and 11.50 seconds. The time before 9.25 seconds is categorized a safe level (zero index). The maximum acceleration values of bridge response are 4.745 m/s2 at sensor1 and 1.7089 m/s2 at sensor2 (Fig. 5). The maximum displacement value at sensor1 is 0.0486m, whereas at sensor2 is 0.00985m (Fig. 6). 4
Acceleration (m/s2)
IV. A CASE STUDY The bridge simulation model covered 3 spans of box girder concrete. The lengths of the 3 spans are 79m, 110m, and 79m respectively. The 2 sensors were assumed to be installed on the top of piers as shown in Fig. 3. The sensors measure the acceleration and displacement values of the bridge response.
Sensor1
3
Sensor2
2 1 0 -1 0
2
4
6
8
10
12
-2 Safe level = 0 index
-3
Damage level = 1st, 2nd, and 3rd index
-4 -5
Time (sec)
Fig. 5. The acceleration response of bridge model due to the excitation of Lomaprieta 1989 earthquake.
Fig. 3. The 3 spans of box girder bridge model
ISBN: 978-988-19251-8-3 ISSN: 2078-0958 (Print); ISSN: 2078-0966 (Online)
Displacement (m)
The bridge model in Fig. 3 has been analyzed using the finite-element software. The non linear time history analysis has been applied in the model so the behavior and condition on the model due to earthquake can be known as a detail at the given time. According to FEMA 356, time history analysis shall be performed with at least three time-histories data sets of ground motion. Since three time history data sets are used in the analysis of structure, the maximum value of each response parameter shall be used to determine design
0.05 Sensor1
0.04
Sensor2
0.03 0.02 0.01 0 -0.01
0
2
4
6
Safe level = 0 index
-0.02
Time (sec)
8
10
12
Damage level = 1st, 2nd, and 3rd index
Fig. 6. The displacement response of bridge model due to the excitation of Lomaprieta 1989 earthquake.
IMECS 2013
Proceedings of the International MultiConference of Engineers and Computer Scientists 2013 Vol I, IMECS 2013, March 13 - 15, 2013, Hong Kong
TABLE I THE EXAMPLE OF INPUT DATA FROM LOMAPRIETA EARTHQUAKE INPUT No. of OUTPUT TIME ACC1 DISPL1 ACC2 DISPL2 DATA 1 0 0.00E+00 -9.77E-05 0.00E+00 -2.95E-04 S=0 2 0.05 3.57E-02 -1.29E-04 1.18E-03 -3.29E-04 S=0 ⁞ ⁞ ⁞ ⁞ ⁞ ⁞ ⁞ 225 11.2 -3.26E-02 -5.65E-03 6.44E-01 2.45E-04 IO= 1 226 11.25 5.59E-02 -3.37E-03 1.70E-01 2.83E-03 IO= 1 227 11.3 -1.36E-01 -9.34E-04 -3.18E-01 5.81E-03 IO= 1 228 11.35 2.58E+00 2.74E-03 -2.27E-01 8.24E-03 IO= 1 229 11.4 6.23E-01 1.13E-02 -8.02E-01 9.85E-03 LS= 2 230 11.45 1.10E+00 2.26E-02 -8.31E-01 9.58E-03 LS= 2 231 11.5 -1.44E+00 3.64E-02 -5.99E-01 7.66E-03 CP=3 232 11.55 -3.25E+00 4.69E-02 5.41E-02 4.70E-03 CP=3 233 11.6 -4.75E+00 4.86E-02 1.09E-01 9.90E-04 CP=3 234 11.65 3.01E+00 4.06E-02 8.88E-01 -3.14E-03 CP=3 Note: ACC1 and DISPL1 are acceleration and displacement values at Sensor1. ACC2 and DISPL2 are acceleration and displacement values at Sensor2.
Mean Square Error (MSE)
30000th iteration. The error of the validation process increase since after the 30000th epoch. There was overfitting at the process. The network begins to over-fit the data, since the MSE of the validation set will typically begin to rise. The discrepancy of the MSE validation indicates the architectures of the model unsuitable for acceleration data domain with one hidden layer. 0.07 0.06 0.05 MSE Mean
0.04
MSE Training
0.03
MSE Testing
0.02
MSE Validation
0.01 0.00 0
10000
20000
30000
40000
50000
Epoch
Fig. 7. The Means Square Error of neural network model for 1 hidden layer of acceleration domain
Fig. 8 illustrates all MSE in the neural networks model based on displacement have the same trend line and in tune since 10000th epoch. The error on all processes decreases along the iterations. The result indicates the architectures model for 1 hidden layer can be accepted and used for predict the damage level based on the displacement data domain. Mean Square Error (MSE)
The architecture of neural network method in this study is shown in Fig. 2. The study used 1 and two hidden layers to finding the best result for prediction of bridge condition. The architectures model for 1 hidden layer has 5 neurons for input, 5 neurons for hidden and 4 neurons for output layer. The topology of the neural network neurons is 5-5-4. Whereas the architectures model for 2 hidden layers has 5 neurons for input layer, 5 neurons for 1st hidden and 5 neurons for 2nd hidden layer and 4 neurons for output layer. The topology of neurons can be written as 5-5-5-4. The neurons for input layer consist of time, acceleration and displacement from sensor1 and sensor2. The output layer is a damage level of the bridge which is categorized into 4 indexes. The indexes are 0 (zero) for safety level (S), 1 (one) for IO level, 2 (two) for LS level and 3 (three) for CP level. One of the excitations is the Lomaprieta earthquake, which has 234 data for input and output data as shown in Table I. The safety level has been described by 186 data during 9.25 seconds for S=0 output index, 42 data during 2.05 seconds for IO=1 output index, 2 data during 0.05 seconds for LS=2 output index, and 4 data during 0.15 seconds for CP=3 output index.
0.07 0.06 0.05 0.04
MSE Mean
0.03
MSE Training
0.02
MSE Testing
0.01
MSE Validation
0 0
10000
20000
30000
40000
50000
Epoch
ISBN: 978-988-19251-8-3 ISSN: 2078-0958 (Print); ISSN: 2078-0966 (Online)
Fig. 8. The Means Square Error of Neural Network model for 1 hidden layer of displacement domain
Mean Square Error (MSE)
The total numbers of input and output data are 1809, which is resulted by finite-element analysis due to four earthquakes excitation. The neural networks used 70% data for training, 15% data for testing and 15% data for validation process. The parameters to indicate the end of training are the mean square error (MSE), maximum of epochs and learning rate (Lr). The MSE with 0.01 performance goal has been used in the networks, whereas the maximum number of epoch used 50000, and learning rate used 0.1. The networks have been examined by the computer with specification Intel Core i5-2410M, the power of processor is 2.30 GHz with turbo boost up to 2.90 GHz and memory 4 GB. The results from the models with one hidden layer are shown in Fig. 7 and Fig. 8, while the models with 2 hidden layers are shown in Fig.9 and Fig. 10. The MSE of neural networks of a model based on acceleration data domain is seen in Fig.7. The MSE of training, testing and validation process have the same trend line along the 10000th to
0.07 0.06 0.05 0.04
MSE Mean
0.03
MSE Training
0.02
MSE Testing
0.01
MSE Validation
0.00 0
10000
20000
30000
40000
50000
Epoch
Fig. 9. The Means Square Error of Neural Network model for 2 hidden layer of acceleration domain
The neural networks model based on acceleration data domain with two hidden layers is shown in Fig. 9. The figure illustrates all MSE models have the same trend after 10000
IMECS 2013
Proceedings of the International MultiConference of Engineers and Computer Scientists 2013 Vol I, IMECS 2013, March 13 - 15, 2013, Hong Kong iterations. The MSE values of testing process are higher than other MSE values. The error into the testing process is not used during the training process, but it is used to compare the different models. Fig.10 shows the MSE of the model based on displacement data domain. The MSE of validation has the fluctuation along the iterations before 25000 epochs. The fluctuation describes the networks have not been convergent yet. It means the acceleration data domain more acceptable rather than the displacement data domain for two hidden layers’ model. Mean Square Error (MSE)
0.07 0.06
TABLE III Comparison of acceleration and displacement domain for 2 hidden layer
0.05 0.04
MSE Mean
0.03
MSE Training
0.02
MSE Testing
0.01
MSE Validation
Epochs
0 0
10000
20000
30000
40000
Fig.10. The Means Square Error of Neural Network model for 2 hidden layer of displacement domain
The comparison of acceleration and displacement data domain for 1 and 2 hidden layers model has been observed in Table II and Table III. The comparisons are the average of mean square error (MSE mean), regression (R mean) and running time (CPU time). The best performance of MSE value is the smallest of MSE, because it means the smallest of the error occurred in the calculation. However the best regression value is the highest one close to 1. The regression with value close to 1 defines the prediction value almost 100% close to the actual one. The best performance of CPU time is the shortest time to process the calculation in central processing unit (CPU). The CPU time is measured in seconds. The CPU time is dependent with CPU’s computational power and specification of the computer. The both Table II and Table III show the MSE value decreases since the epoch increases. However CPU time increases since the epoch increases. On the other hand regression value increases close to 1 since the epoch increases. TABLE II Comparison of acceleration and displacement domain for 1 hidden layer
5000 6000 10000 15000 25000 50000
Acceleration MSE Mean R Mean CPU Time
0.0618 0.0611 0.0624 0.0609 0.0597 0.0574
0.79144 0.79401 0.79517 0.80089 0.80509 0.80689
369.114 445.3361 738.1031 1080.4 1824.3 3846.7
Displacement CPU Time MSE Mean R Mean
0.058 0.0573 0.059 0.0546 0.0538 0.0531
0.80933 360.6743 0.81163 430.4848 0.80359 716.1226 0.82214 1050.5 0.82635 1797.5 0.82937 3661.6
Table II shows the all average of regressions (R-mean) is above 80% for displacement data domain with 1 hidden layer. The table describes the displacement data domain has the smaller MSA values and the higher R-mean values rather than the acceleration data domain. The best of MSE and R-
ISBN: 978-988-19251-8-3 ISSN: 2078-0958 (Print); ISSN: 2078-0966 (Online)
5000 6000 10000 15000 25000 50000
Acceleration MSE Mean R Mean CPU Time
0.0611 0.0576 0.0583 0.0578 0.0572 0.0556
0.79973 0.79704 0.80678 0.80832 0.80988 0.81451
Displacement MSE Mean R Mean CPU Time
391.5625 473.8842 760.3333 1153.8 1910.9 3900.6
0.0565 0.0555 0.0546 0.0525 0.0522 0.0512
0.81091 409.0502 0.81619 472.527 0.81876 779.771 0.8278 1193.9 0.82921 2013.8 0.83001 4091.8
50000
Epoch
Epochs
mean value are 0.0531 and 0.82937 at 50000 epochs for displacement data domain. The values are 3.89% smaller than MSE of acceleration data domain and 1.37% higher than R mean of acceleration data domain. The process time needs 2.46% shorter than the acceleration data domain. Analog with Table II, the comparison of the acceleration and displacement data domain for 2 hidden layers has been shown in Table III. Table III displays the all average of regressions (R-mean) is above 0.81% for displacement data domain with 2 hidden layers. Similar with Table II, the table displays the displacement data domain has the smaller MSA values and the higher R-mean values rather than the acceleration data domain.
The best of MSE and R-mean value are 0.0512 and 0.83001 at 50000 epochs for displacement data domain. The values are 4.12% smaller than MSE of acceleration data domain and 0.94% higher than R mean of acceleration data domain. However, the process time needs 2.39% longer than the acceleration data domain. The result shows the neural networks model for 1 hidden layer model is suitable for the displacement data domain because the results display the values of the MSE mean are smaller and the regression values (R mean) are higher close to 1 and the CPU time is shorter than acceleration data domain. The smaller MSE mean defines the error occurred in calculation to predict the bridge damage is smaller. Whereas the neural networks model for 2 hidden layers model is unsuitable with the displacement data domain. Although the model has the MSE mean values are smaller and regression values (R mean) are higher close to 1, however the process time is longer than acceleration data domain. Therefore for prediction damage level on bridge monitoring is recommended to use 1 hidden layer with displacement data domain. V. CONCLUSION The bridge health system used several sensors to detect the behavior of a bridge such as bridge deformation and damage. The sensors connected to data logger and sent the information data such as displacement and acceleration to the local server. The data is used as input by neural networks within the server system. The architecture of neural network method in this study used one and two hidden layers. The results denote the models with one hidden layer for acceleration data domain had the discrepancy of the MSE validation. The problem indicates the architectures of the model unsuitable for acceleration data domain with one hidden layer. While the neural networks’ model based on displacement with a hidden layer have the same trend line and in tune since the 10000th epoch. The error on all processes decreases along the iterations.
IMECS 2013
Proceedings of the International MultiConference of Engineers and Computer Scientists 2013 Vol I, IMECS 2013, March 13 - 15, 2013, Hong Kong The neural networks’ model based on acceleration data domain with two hidden layers illustrates all MSE models have the same trend after 10000 iterations. The MSE values of testing process are higher than others MSE values. The error during the testing process is not used during the training process, but it is used to compare the different models. While the MSE validation of the neural network based on displacement data domain with two hidden layers had the fluctuation along the iterations before 25000 epochs. The fluctuation describes the networks has not reached convergence. The comparison of acceleration and displacement data domain for one and two hidden layers’ model has been concluded based on MSE mean value, regression mean value and CPU time of the network model. Both comparisons show the MSE mean value decreases since the epoch increases. However, CPU time increases when the epoch increases. Whereas regression value increases close to 1 since the epoch increases. The average of regressions (R-mean) for displacement data domain with 1 and two hidden layers is above 80%. The value denotes the damage values from the displacement data domain has been predicted 80% close to the actual damage values. Conversely, the process time for two hidden layers needs the longer time than the acceleration data domain. Therefore, the bridge health prediction based on displacement domain data for one hidden layer is more accurate rather than the acceleration data domain with 1 and two hidden layers. According to the results, the neural networks’ method based on the displacement data has the best performance since uses one hidden layer in the system. The reason describes the displacement is derived from second time to generate the acceleration. The displacement has simpler physic quantity rather than acceleration so the convergent is approached faster. Actually, most bridge monitoring system use the accelerometer sensors to measure the acceleration of bridge response, because the accelerometer sensor is simpler to install in the field. Furthermore, the acceleration from accelerometer sensors can be modified directly to conduct the displacement value before entry into the neural networks system server. Consequently, the monitoring system is recommended to be used in the neural networks with one hidden layer based on displacement domain. The implementation of the intelligent neural network method for the bridge seismic monitoring system can help the bridge authorities to predict the stability and health condition of the bridge structure at any given time.
[4]
[5]
[6]
[7]
[8]
[9]
[10]
[11] [12]
[13]
[14]
Ok, S., W. Son, and Y.M. Lim, "A study of the use of artificial neural networks to estimate dynamic displacements due to dynamic loads in bridges." Journal of Physics: Conference Series, 2012. 382(1). Cheng, J. and Q.S. Li, "Artificial neural network-based response surface methods for reliability analysis of pre-stressed concrete bridges." Structure and Infrastructure Engineering, 2012. 8(2): p. 171-184. Qian, Y. and A. Mita, "Acceleration-based damage indicators for building structures using neural network emulators." Structural Control & Health Monitoring, 2008. 15(6): p. 901-920. Chen, M., "A Neural Network Approach for Existing Bridge Evaluation Based on Grid." 2008 International Symposium on Intelligent Information Technology Application, Vol I, Proceedings, 2008: p. 90-93. Mehrjoo, M., et al., "Damage detection of truss bridge joints using Artificial Neural Networks." Expert Systems with Applications, 2008. 35(3): p. 1122-1131. Jeng, C.H. and Y.L. Mo, "Quick seismic response estimation of prestressed concrete bridges using artificial neural networks." Journal of Computing in Civil Engineering, 2004. 18(4): p. 360372. Chakraverty, S., T. Marwala, and P. Gupta, "Response Prediction of Structure System Subject to Earthquake Motions using Artificial Neural Network." Asian Journal of Civil Engineering (Building and Housing), 2006. VOL. 7, NO. 3. Chen, W.-F. and L. Duan, eds. Bridge Engineering Seismic Design. 2003, CRC Press: Florida. 442 pp. Wong, K.-Y., "Design of a structural health monitoring system for long-span bridges." Structure and Infrastructure Engineering, 2007. 3(2): p. 169-185. PEER. Pacific Earthquake Engineering Research Ground Motion Database. 2012 15 march 2011; Available from: http://www.peer.berkeley.edu/. FEMA356, Prestandard and Commentary for The Seismic Rehabilitation of Buildings. 2000, Federal Emergency Management Agency.
References [1]
[2]
[3]
A. T. Goh, B., "Some Civil Engineering Applications of Neural Networks." Structural and Building Boord Structural Ponel Paper 10543, 1995. Proc. Instn Ciu. Bldgs. 1994,104, Nov., 463-469. Flood, I., "Towards the next generation of artificial neural networks for civil engineering." Advanced Engineering Informatics, 2008. 22(1): p. 4-14. Kerh, T., C. Huang, and D. Gunaratnam, "Neural Network Approach for Analyzing Seismic Data to Identify Potentially Hazardous Bridges." Mathematical Problems in Engineering, 2011: p. 1-15.
ISBN: 978-988-19251-8-3 ISSN: 2078-0958 (Print); ISSN: 2078-0966 (Online)
IMECS 2013