Proceedings of the World Congress on Engineering and Computer Science 2014 Vol I WCECS 2014, 22-24 October, 2014, San Francisco, USA
Neural Network Random Error Prediction on Wireless Local Area Network and Application of One-dimensional Multi Resolution Wavelet De-noising Technique Danladi Ali Member, IAENG, Gnatushenko V. V. and Abdullahi M. Abstract—Self-similarity is a phenomenon known as a random error in a discrete system and considered as one of the major factors that constitute a delay on a network; it affects the overall stability or performance and reduces the capacity utilization of the network. In view of this, an ON/OFF traffic model as a source of self-similarity on the network of a wireless local area network (WLAN) has been developed and implemented using optimized network engineering tool (OPNET) technology in a simulation environment of 100m x 100m office network topology. We monitored delay signal, used neural network predictive control (NNPC) to predict the random error in the delay signal, one-dimensional (1D) multilevel wavelet de-noising technique to filter the error, autocorrelation function (ACF) and fast Fourier transform (FFT) energy spectrum to validate the filtering effects after all the stages of the decomposition and reconstruction of the delay signal. The result of the filtering revealed that random error in the delay signal is de-noised successfully as the coefficient of ACF grows above zero and energy rate in the FFT- spectrum increased. Index Terms—Delay, monitoring, reconstruction, ACF and FFT spectrum I.
decomposition,
INTRODUCTION
These days, the demand for internet service is growing geometrically more especially with the introduction of multimedia services, such as video and audio streaming over the internet network [10]. Due to these massive activities imposed on the network, the data traffic is becoming more complex day by day; hence the network experience congestion as well as a delay phenomenon. When viewing the causes of network delay on a large scale many factors could be put into consideration; like low bandwidth, application of many hosts in a broadcast domain, multicasting and inefficient protocols. Network delay degrades overall network Manuscript received 1st July, 2014 revised 3rd August, 2014. This work was supported in part by the Nigerian Tertiary Education Trust Fund (TETF). Neural Network Random Error Prediction On Wireless Local Area Network And Application Of One-dimensional Multi Resolution Wavelet De-noising Technique. Danladi A. is with Adamawa State University, Mubi. Nigeria. Presently, a Ph. D student at National Metallurgical Academy of Ukraine.
[email protected] Gnatushenko V. V. is with Department of Information Technology, National Metallurgical Academy of Ukraine,
[email protected] Abdullahi M. is with the Department of Laboratory Technology, Modibo Adama University, Yola. Adamawa state,
[email protected]
ISBN: 978-988-19252-0-6 ISSN: 2078-0958 (Print); ISSN: 2078-0966 (Online)
performance, since it is associated with random errors, overflow probability, retransmission of data and probably may involve data drop [5]. Delay problem is very difficult to predict because one may not know the exact input characteristics of the network at a particular period. Therefore, in trying to address delay problems on the network and to develop the algorithm for the fast flow of data traffic across an IP network, question of constructing a model with self-similar behavior or input characteristics may arise. Many research works in this field have justified that recent IP network traffic suffers congestion or delay problems. In [9] a study on internet delay was carried out in order to analyze delay and causes of delay across internet; the study shows that internet network exhibits delay, caused due to inefficient design of a webpage. In [6], UDP echo method was used to investigate network problems as a faulty network interface card; the study revealed that packets were lost randomly. In [2], the study conducted was based on loss and delay measurement in data collected from internet service providers (IPS) in US; the study arrived to a conclusion that some paths experienced severe impairments due to network protocol failure, reconfiguration and router operation may be responsible for network delay instead of normal congestion and quality of service. In [7], research was conducted to study network efficiency in terms of measuring network congestion; the result of the work revealed that most congestion problems were experienced due to the network components, which includes structural failure, links, nodes, others such as a natural disaster, and attack from terrorist. In all the related works mentioned above by the various authors, they were concerned with identifying the cause of the delay on the network but did not provide information on how ON/OFF traffic can cause selfsimilarity as well as delay on a network and method on how to reduce the delay problem is neither attempted nor addressed, while in this work, we developed a WLAN ON/OFF traffic model, predicted and addressed the random error on the network. A self-similar study was conducted using ON/OFF simulation model by [22], result of work revealed that the simulated network exhibits self-similar behavior with Hurst parameter; 0.546 ˂ H ˂ 0.733. Also another work conducted by [23] using ON/OFF model, confirmed that information flow across the network could be hindered WCECS 2014
Proceedings of the World Congress on Engineering and Computer Science 2014 Vol I WCECS 2014, 22-24 October, 2014, San Francisco, USA
due to the presence of the self-similarity on the network. This prompted us to develop ON/OFF model as a source of data delay on a network. In [16], work was conducted on filtering of unwanted signal from non-stationary bowel sound signal using 1D multilevel wavelet; the work revealed that the wavelet tool is capable of improving the signal to noise ratio of the non-stationary bowel sound. Another study carried out on de-noising ECG signal by discrete wavelet transform confirmed that 1D multilevel wavelet is an appropriate tool for de-noising the signal and improving signal to noise ratio [17]. However, in [16][17], the level at which the filtering effect is effective is not ascertain in terms of speed and accuracy. But, in this work, the use of ACF and FFT energy spectrum confirmed the effectiveness of the filtering. In this work, we propose to develop a WLAN model with an ON/OFF traffic as a source of self-similarity that could probably cause delay on a network using OPNET technology [20]. ON/OFF traffic is known to have; heavy tail distribution, long range dependence (LRD) and selfsimilar traffic. The self-similar nature of the ON/OFF traffic is best captured by Pareto model, instead of the traditional Poisson distribution, which is memory less and depend on the queuing length. The degree of selfsimilarity is usually estimated by Hurst parameter (H). 0.5≤H≤1 [24], means, as H approach 1, the degree of the self-similarity increases. We also propose to use NNPC to train the network [15] and predict the random error which may likely occur due to the self-similar effect on the network. After obtaining the result of neural network (NN) prediction, we will apply 1D wavelet de-noising technique to filter the error present in the signal. Even though, there are many methods in which error from delay can be reduced among all are segmenting the network using some equipment like switch, bridge and routers, using high bandwidth, suitable protocols [14]. Our interest is raised to the choice of the wavelet de-noising technique because it seems to be one of the best and promising methods in de-noising errors that are associated with delay on the entire network. To ascertain that de-noising application is effective. Emphasis will be put on the properties of the ACF in terms of a strong relationship with the self-similarity; one obvious observation with ACF, is that as the presence of self-similarity on the network increases, its coefficient decay to near zero, this means that the signal is uncorrelated with the random error on the network [11][21] and in the FFT energy spectrum; the energy in the spectrum reduces while the traffic volume transmission or the frequency reduce to a considerable extent. These two parameters were used to verify the filtering method. This is the major reason of choosing this technique. II.
First, a startup wizard is set. The topology is then created. The required number of the nodes is dragged into the empty space base on the number of nodes needed for a particular section and then each of the node field is set to carry out their functions. These include two or more workstations. ON time is set to 80s, OFF time to 20s, as we know ON/OFF is a random variable, inter-arrival time to 1000 packet/s, packet size (bits); location parameter 10 and shape parameter 0.8 Pareto distributed and operational mode; full duplex. The goal is to monitor data delay with self-similar behavior. In optimized network engineering tools there are two major statistics available, these are; global statistics and node statistics. Global statistics tells us about the statistics of the entire network while node statistics tell us about the statistics of an individual node. Appropriate statistics are then imposed on the scenario model, simulation is run, and results are taken, the WLAN data delay monitored is then presented in Fig.1, below as a signal. III.
RESULTS ANS DISCUSSION
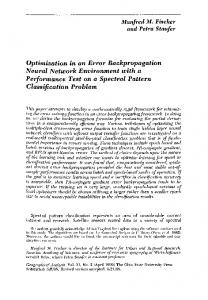
Fig. 1, depicted below is the delay signal monitored after the simulation. This delay signal is collected from OPNET simulator, as we can see the delay signal varies with time, the inconsistency in the peak of the signal or the variation may attribute to the presence of the random error caused due to the self-similar effect within the given simulation time. The delay signal shows stationary behavior with time. This is one of the major characteristics of suspecting self-similarity on a network.
Fig. 1. Data delay monitored
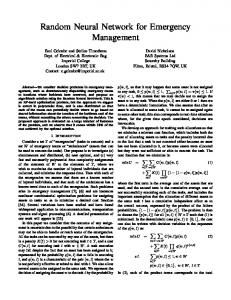
While Fig. 2, presents the histogram of the delay signal showing the suspected delay part on the network; the greatest delay concentration is towards the beginning part of the signal which means at that point the signal has high random error that could be undesirable for the network.
IMPLIMENTATION OF THE SIMULATION MODEL AND COLLECTION OF STATISTICS
A simulation model of an ON/OFF traffic is developed in 100m x 100m office topology network.
ISBN: 978-988-19252-0-6 ISSN: 2078-0958 (Print); ISSN: 2078-0966 (Online)
Fig. 2. Histogram of the data delay
WCECS 2014
Proceedings of the World Congress on Engineering and Computer Science 2014 Vol I WCECS 2014, 22-24 October, 2014, San Francisco, USA
Haven seen that the delay signal exhibit stationary behavior, we then used variance-time and rescale adjusted range method to test the presence of the self-similarity on the network using the expressions (2) and (4) respectively
2 X i m
~ am
, as m
(1)
It is possible to estimate β for different m values by taking log of both side of (1)
log 2 X i
m
~ logm loga , m
(2)
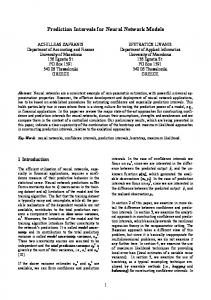
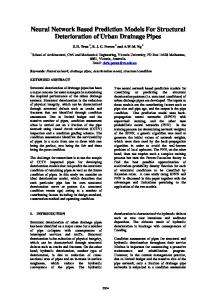
Fig. 3. Random error signal predicted after the NN training
This method of aggregate differences (Variance method) use logarithmic sample variance to equalize the level of aggregation which should give a straight line with a slope greater than -1. In this case H = 1 + β / 2. m
Where X is the variance of the combined process, m is the size interval, a is the finite positive constant and β is the slope of the straight line. Hurst is the ratio of rescaled adjusted range given by (3).
Rn H M ~ cn , as n S n
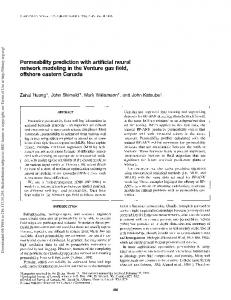
Fig. 4. NN output after training
(3)
It is also, possible to estimate H, by taking the log of both parts of (3) as shown in (4)
R n log M ~ H logn + logc n S n
(4)
This is a method of normalizing magnitude (R / S plot method). The logarithmic samples of the R / S statistics in the equation with the number of points aggregated series gives a straight line with a slope H. We found that H=0.5082 from (2) and H=0.5244 from (4) respectively. This confirmed the effect of the selfsimilarity on the network and may be responsible for the cause of the delay on the network. We then introduced the delay signal from the simulated network into the NNPC tool [19] in order to obtain a weight that could give us desired input/output. In the process, we trained the network several times so that the network will learn about the delay signal and predict the random error, as the training continues; we noticed that the successive training pairs negate the change in each stage of training to a reasonable point, that is up to the stage that the random error goes below the threshold. This now confirms the degree of error on the network, at that point NNPC tend to recognize the actual input signal as well as the random error. Fig. 3, shows the amount of the random error predicted after the training and validation. While Fig. 4, shows NNPC recognized output signal with little or no interference.
ISBN: 978-988-19252-0-6 ISSN: 2078-0958 (Print); ISSN: 2078-0966 (Online)
As mentioned in the previous part of this text congestion or delay is undesirable for any network user. However, it becomes necessary to monitor our network in order to provide a reasonable quality of service (QoS) to the end user. This prompts us to use wavelet to filter the random error. Wavelet technique consists of decomposition, compressing and reconstruction processes before the signal is de-noise [8][12][13]. The process of decomposition consists of down sampling and filtering while reconstruction process involves up sampling and filtering. The decomposed signal provides information about the approximated signal and its detail on octave as given in (5) [18] j
y a x J , k 0 J , k + d x j , k 0 j, k k 1
(5)
The approximated signal is usually situated on the upper scale of the octave [25] ranging from 1 ≤ J ≤ J0 while the details on the lower scale ranging from 1 ≤ j ≤ J0. The wavelet coefficients a x ( J , k ) , d x ( j , k ) are derived from (6) after full decomposition.
a ,b t
1 a
t b a
(6)
Where a is the positive number which defines the scales and b is the real number that defines the shift in (6) sometimes called child wavelet derived from the mother wavelet. During the process of the filtering in any of the stages we paid attention to the choice of the appropriate filter because if care is not taken some vital part of the
WCECS 2014
Proceedings of the World Congress on Engineering and Computer Science 2014 Vol I WCECS 2014, 22-24 October, 2014, San Francisco, USA
information may be lost or we can easily compromise the signal structure, since the signal always consists of high, low frequencies and it is compressed, information about the signal may not be clear at that time. The signal is then analyzed with wavelet db10 type, at level 3 decomposition, with interest of de-noising the undesirable content of the signal that leads to the delay. Before the process of decomposition and reconstruction it is expected that the delay signal may contain a high noise level (random error), when looking at it from a theoretical point of view [1], the signal will have a poor autocorrelation function coefficient with the random error; decaying to zero, and in the fast Fourier transform energy spectrum, the energy rate will be reduce due to the delay while the volume of the successfully data traffic that will be transmitted to the destination will be reduced. The de-noising process is validated by closely observing the behavior of the ACF and FFT spectrum of the signal at each stage of decomposition and after the reconstruction process as shown in Fig. 7 and 8. Fig. 5 shows the comparative signal structures; the reconstructed signal is presented in black color, while the delay signal presented in red color. This is evident that the delay signal contained a reasonable amount of random error. We can see that the structure of the reconstructed signal is within the threshold and the signal structure is not compromised, both the signals follow the same trend.
Fig. 7 and 8, show the autocorrelation function and fast Fourier transform spectrum respectively; here the ACF as shown in Fig. 7, its coefficient grows above zero after decomposition and the reconstruction showing poor correlation with the random error, which means the network is de-noised to a reasonable extent, since ACF
Fig.7. Autocorrelation function
characteristics does not comply in terms of the delay while looking at the FFT spectrum in Fig.8, indicates that the data traffic flow rate is tremendous due to the denoised process compared to the traffic flow rate in Fig. 1.
Fig. 8. FFT-Energy spectrum
Fig. 5. Reconstructed signal.
Fig. 6, shows the random error signal; this is an undesirable or the signal content filtered from Fig. 1, it consumes almost all the content of the signal in Fig. 1. This is evident that the random error occupied the larger portion of the original signal and it may attribute to the cause of the delay in the WLAN.
Fig. 6. Residual signal after de-noising.
ISBN: 978-988-19252-0-6 ISSN: 2078-0958 (Print); ISSN: 2078-0966 (Online)
Fig. 9, presents the NN simulation result that shows the prediction pattern of the error, we can see clearly; as the NN learn more and more about the delay signal it recognized the random error better and prediction increases exponentially, which means the NN has predicted reasonable amount of random error in the delay signal and well validated. The NN starts to recognize the random error and validate the prediction at 5 and continues to 10 where the final prediction is validated.
Fig. 9. NN simulation result showing prediction pattern
WCECS 2014
Proceedings of the World Congress on Engineering and Computer Science 2014 Vol I WCECS 2014, 22-24 October, 2014, San Francisco, USA
The network experience average delay of 0.094/s due to the presence of self-similarity, while after de-noising delay signal the value reduced to 0.028/s. which means that 81.5% of the delay on the network is caused due to the presence of self-similarity and the 18.5% maybe attributed to other factors or parameters, which is not our main focus in this work. IV. CONCLUSION
A WLAN has been developed, simulated and implemented using ON/OFF traffic load. Delay signal is monitored. Random error is predicted on the network by NNPC showing that the network experience high delay and the cause of the delay is identified as due to the presence of self-similarity on the network with 0.5082≤H≤0.5244. On-dimensional multi resolution wavelet de-noising technique is applied to de-noise random error while ACF and FFT confirmed that the error content of the network has been successfully de-noised. This work is focused on the error prediction, connection of ON/OFF traffic with self-similarity and delay. We believe that this work has provided some vital information on how the delay is related to self-similarity and how to predict and de-noise signal from the delay. We recommend that any further work on network implementation should consider the relationship between self-similarity and delay as a major source of planning, designing, controlling and management of the modern IP network.
Technology Research 6 (1), 2014, pp. 1-5 [15] Matlab neural network toolbox user's guide.www.mathworks. com/contact_TS.html [16] Z. Xizheng, R. Yuanqing, W. Weixiong, “A new filtering methods in the wavelet domain for bowel sound” , International Journal of advance computer science and applications, vol. 1 no. 5, November, 2010. [17] A. Aouinet and C. Adnane, “Electrocardiogram de-noised signal By discrete and continuous wavelet transform” signal processing international journal, vol. 8 no. 1, 2014, pp. 1-9. [18] M. Misiti, Y. Misiti, G. Oppenheim and J. Michael Poggi. Wavelet toolbox for use with matlab, user's guide version 1. http://www.matworks.com [19] A. Khotanzad, H. Elragal and T. L. Lu.Combination of neural network forcasters for prediction of natural gas consumption. IEEE transactions, on neural-network, vol 11 no 2, 2000, pp. 464 - 473. [20] Reports of the Network design projects homepage: http://www.esat.kuleuven.ac.be/~h239/reports.htm. [21] I. Cerpedes, J. Ophir, and Kaisar Alam. The combined effect of signal de-correlation and random noise on the variation of time delay estimation. IEEE Transaction, on ultrasonic, and frequency control, vol. 44 no.1, January, 1997, pp. 220-225 [22] Gnatushenko V.V. and Danladi Ali “ Study of self-similar processes over traffic based on ON / OFF model” Journal of National University "Lviv Polytechnic" series "Computer Science and Information Technologies" . - № 751, pp. 87-94. Lviv, 2013 [23] Gnatushenko V. V. and Danladi Ali “Study of effect of Pareto distribution structure form on information flow characteristics by applying simulation model. Journal of system and Technology. Vol,1 no 87, pp 131 – 138. Dnepropetrovsk, 2013. [24] Danladi Ali and V.V. Gnatushenko” Estimation of Hurst Exponent and Filtering of Gaussian effect on Fractional Brownian Motion” Proc. of the Intl. Conf. on Advances In Computing, Communication and Information Technology. Institute of Research Engineers and Doctors, pp. 40-44. ISBN: 978-1-63248-010-1 doi: 10.15224/ 978-1-63248-010-1-08 [25] Danladi Ali and Vlada N.Y. Wavelet based path loss modeling for global system for mobile communication in an urban environment International Journal of Science and Research 3(7): 1929-1932
REFERENCE [1] [2] [3] [4] [5]
[6] [7] [8] [9] [10] [11] [12] [13] [14]
P. Abry and D. Veitch. Wavelet analysis of long range dependence traffic. IEEE Transaction on information theory. 1998. M. Athiama, T. Fouad, and K. Mansour. Loss and delay measurement of internet backbone. Computer communication special issue on monitoring and measurement, 2005. P. Hamibindu , Z. Ying, Z. M. Morley and Y. H. Charlie. Understanding network delay changes by routing events. Proceeding of ACM SIGMETRICS , 2007. D. Hayes and G. Armitage. Improving co-existence and loss Tolerance for delay-based TCP congestion control. Proceeding of IEEE LCN, 2010, pp. 24-31 R. Jain. A. Delay – based approach for congestion avoidance in interconnected heterogeneous computer network. ACMSIGCOMM computer communication review 19-5 ,1989, pp. 56-71 C. B. Jean. End to end packet delay and loss behavior in the internet. SIGCOMM's-Ithaca, N.Y US., 1993. A. Nagurney, Q. Qiang. A efficiency measure for congested network. Epl Journal, 2007. J. L. Passmore, B. C. Collings, and J. P. Collings, Autocorrelation of electrical noise. Journal Physics 63, 1999, pp. 592-596 G. Pradeep. Study on internet delays. Master’s Thesis Department of computing science Umea Sweden, 2005. A. Qazi, L. L .H Andrew, and T. Znati.”Congestion control with multi packet feedback. IEEE/ACN transaction, on networking 20-6, 2010, pp. 1721-1733. P Quan , Z . Lei , D. Guanzahang, and Z. Hongcai , Two De-noising methods by wavelet transform. IEEE Trans, of signal processing, 47 -12 , 1999, pp. 3406-3409 R. Q. Quian and H. Garcia. Single-trial event- related potential with wavelet de-noising. Clinical Neuro physiology, 2003, pp. 376-390 C Rami. Signal de-noising using wavelets. Project report. Http//tx.technion.ac.cl/rc, 2011. D. A. Shalangwa. Evaluation of bandwidth performance in a corporate network. Academic Journal of Engineering and
ISBN: 978-988-19252-0-6 ISSN: 2078-0958 (Print); ISSN: 2078-0966 (Online)
WCECS 2014