SELECTED TOPICS in SYSTEM SCIENCE and SIMULATION in ENGINEERING
Application of Pattern Recognition Method in Classifying Power System Transient Disturbance Noraliza Hamzah, Fahteem Hamamy Anuwar, Zuhaina Zakaria Faculty of Electrical Engineering, Universiti Teknologi MARA, Shah Alam, Selangor, MALAYSIA
[email protected]
Abstract: - Power system transient can cause serious damage to main power system apparatus and sensitive loads. There are many causes of power system transient including capacitor bank switching, switching of large inductive loads and lightning. This paper discusses the application of pattern recognition method, namely Support Vector Machine (SVM) to classify the cause of transient disturbance in power system. Two types of feature extractions are applied to provide the inputs to the SVM, i.e. the minimum and maximum peak voltage values and the wavelet energy level of the transients. The IEEE 30 bus system is modeled using the Power System Computer Aided Design (PSCAD) software to generate different type of transient data caused by capacitor switching and lightning. Feature extraction is performed using discrete wavelet transform (DWT) analysis. The results showed that the performance of the feature extraction using maximum and minimum peak voltage values is superior (80%) as compared to the wavelet energy (54%) to classify the cause of the transient. Key-Words: - Power quality, transient, discrete wavelet transform, support vector machine, radial basis function
1 Introduction
cause of transient either by capacitor switching in power distribution system or due to lightning.
Transient are sub-cycle deviations from the normal voltage or current waveform. A number of transient causes are lightning strokes, switching actions in the distribution or transmission system, self-clearing faults or faults clear by current limiting fuses, and the switching of end-user equipment. Transient occurs in a very short duration (microseconds to milliseconds) and can be of large magnitude [1]. Low frequency transient due to capacitor bank energizing have received the most attention in the power quality literature due to their adverse impact on the adjustable speed drives [1-3]. Therefore, in order to improve the quality of power system, it is desirable to develop method for identifying the causes of power quality disturbance which include transient. Li et. al [4] has employed SVM for classification of various cases of line energization in the category of safe or unsafe based upon the peak value of overvoltage at the receiving end of line. Przemyslaw et. al [5] used a multi class SVM to classify the disturbance whilst Tong et. al [6] employed an integrated SVM and the one-versus-one (OVO) based SVM which can process the multiple classification in order to reduce the processing time for PQ detection. Based on the findings in [4-9], this paper proposes the application of SVM to classify the
ISSN: 1792-507X
This paper proposes two types of feature extractions to be employed as the inputs of the SVM. The accuracy between these two feature extractions are analyzed and compared.
2 Theories This section describes theories of wavelet and support vector machine that are used in this paper to classify the cause of transients.
2.1 Wavelet Wavelet transform (WT) is a mathematical technique used for many application of signal processing. Wavelet is much more powerful than conventional methods in processing the stochastic signal because of analyzing the waveform time-scale region [10]. This paper used the applicability of the Discrete Wavelet Transform (DWT) to the analysis of power system transient [10-11]. The DWT is defined as:
DWTxm, k
391
1 aom
k nbo aom aom
xng n
ISBN: 978-960-474-230-1
(1)
SELECTED TOPICS in SYSTEM SCIENCE and SIMULATION in ENGINEERING
spaces. The translated and scaled version of the wavelet used in MRA is time frequency picture of the decomposed signal f t . The original signal f t can be decomposed to:
where g[.] is the mother wavelet whilst a= a om and b= bo aom are the scaling and translation parameters of integer „m‟ respectively. By careful selection of a o and bo , a family of dilated mother wavelets can be generated which has an orthonormal basis with respect to the L2 (R) space. By simple interchange of variables n, k and rearrangement of the DWT in (1), we get:
DWTxm, n
1 a
m o
xk g a
m o
n bo k
k
f t c j k jk t d j k jk t
Where j is the level number of the wavelet decompositions. c j , d j are the weighted sequences of the
(2)
space projection of
k
Upon closer observation of this equation, we notice that it is similar to the equation for digital FIR filters;
yn
1 xk hn k c k
f t , respectively.
2.2 Support Vector Machine Support vector machine is a very useful technique for data classification and regression problems. SVM have been used in many pattern recognition and regression estimation problems and have been applied to the problems of dependency estimation, forecasting and constructing intelligent machines [12]. Let n-dimensional inputs xi i 1,2.........., M , M is the number of samples belong to class -1 or class -2 and associated to labels yi 1 for class -1 and
(3)
By comparing equations 2 and 3, the impulse response of the filter in the DWT equation is
g ao m n bo k .
(7)
j 1 k
k
(4)
If x[n] is the discrete time signal to be analyzed then the signal is decomposed into two signals which contain the high and low frequency components as in (5) and (6) respectively.
yi 1 for class -2. For linear separation data a hyper plane f x 0 which separates the data can be determined as shown in (8). n
d1 n xk h2n k
(5)
c1 n xk g 2n k
(6)
f x wT x b w j x j b 0
k
where w is an n-dimensional vector and b is a scalar.
k
The vector w and the scalar b determined the position of the separating hyper plane. This separating hyper plane satisfies the constraints f xi 1 if
The high frequency component d1 [n] is the detailed version of the signal. The low frequency components, c1 n, is further split to get the other details of input signal. By using this technique, any mother wavelet can be implemented although certain wavelets generate symmetric filter coefficients which have certain desirable properties. In multi resolution analysis (MRA), wavelet and scaling functions are used as building blocks to decompose and construct the signal at different resolution levels [12]. The main goal of MRA is to developed representations of a signal at various levels of resolution. MRA is composed of two filters in each level which are low pass filter (LPF) and high pass filter (HPF). A set of orthogonal scaling function t and
yi 1 and f xi 1 if yi 1 and this results in
yi f xi yi wT xi b 1
(9)
for i = 1,2,……………M Considering noise with the slack variables i and the error penalty C, the optimal hyper plane can be found by solving the following convex quadratic optimization problem as given by, M 1 2 w c i 2 i 1
wavelet function t can divide function space into a series of orthogonal high frequency and low frequency
ISSN: 1792-507X
(8)
j 1
(10)
Equation (10) is subject to,
yi wT xi b 1 i
392
ISBN: 978-960-474-230-1
(11)
SELECTED TOPICS in SYSTEM SCIENCE and SIMULATION in ENGINEERING
for i = 1,2,………..M and i 0 for all i
feature space where the linear classification is possible. Using a nonlinear vector function,
where i is the distance between the margin and the
x 1 x, 2 x ,......, m x
examples x i lying on the wrong side of the margin. Applying the Kuhn-Tucker conditions for maximization into the equivalent Lagrange dual problem as given by, M
W i i 1
1 M i k yi y k xiT xk 2 i , k 0
for
y i 0
i
i
(12)
f x i yi T xi x
0
Notice that in (), the inner products are used. A function that returns a dot product of the feature space mapping of the original data points is called a kernel function K x, z T x x . The learning in the feature space does not require the inner products where a kernel function is applied. Using a kernel function, the decision function can be written as,
(13)
The number of variables in the dual problems gives the number of training data. Denoting the optimal solution of the dual problem with * and w* the equality conditions in () holds for the training inputoutput pair xi , yi only if the associated * 0 . In
f x i* yi K xi , x
In this paper, Gaussian radial basis kernel function which gives the best results is selected. The radial basis kernel function is defined as,
xz2 K x, z exp 2 2
(19)
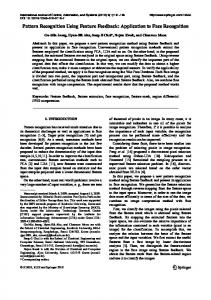
3 Results and Discussions The transient signals are obtained from the PSCAD simulation. The input signal is transformed into the time-frequency domain using DWT. When the SVM classifier is trained, the free regularization constant C and kernel function argument must be determined. Common method to tune free parameters is to use cross-validation technique. In this paper, after performing the cross validation test, it is shown that SVM gives better outputs when the value c=8 and =2. Radial Basis Function (RBF) has been selected as the kernel function. As mentioned earlier, two types of transient is considered in this paper that is caused by capacitor switching and lightning. Figure 1a) and b) shows the waveform of transient which is caused by capacitor switching and lightning respectively. Figure 2a) and b) shows the wavelet of transient caused capacitor switching and lightning respectively.
(15)
SVs
The unknown data sample x is then classified as,
class 1, iff x 0 x class 2, otherwise The nonlinear classification problems can also be solved by using SVM applying a kernel function. The classified data is mapped onto a high-dimensional
ISSN: 1792-507X
where is the width of the Gaussian function.
(14)
where s1 , s 2 are the arbitrary SVs for class -1 and class -2, respectively. Only the samples associated with SVs are summed because the other elements of the optimal Lagrange multiplier * are equal to zero. The final decision function is given by
f x i yi xiT x b *
(18)
SVs
this case, the training example x i is called support vector (SV). The number of SVs is considerably lower than the number of training samples making SVM computationally very efficient. The value of the optimal bias b * is found from the geometry;
1 yi i* s1T xi s 2T xi 2 SVs
(17)
SVs
for C i 0, i = 1,2……..m
b*
m n
To map the n-dimensional input vector x into the m-dimensional feature space, the linear decision function in dual form is given by,
which is subject to, M
(16)
393
ISBN: 978-960-474-230-1
SELECTED TOPICS in SYSTEM SCIENCE and SIMULATION in ENGINEERING
Vo lt a g e (kV)
Voltage (kV)
20.0 15.0 10.0 5.0 0.0 -5.0 -10.0 -15.0
Time(s)
Fig. 1: Transient a) capacitor switching b) Lightning
a)
b)
Fig. 2: Wavelet detail of level 3 of transient caused by a) capacitor switching b) lightning
capacitor switching is denoted by class +1 and -1 respectively. In this experiment, it has been found that the testing classification accuracy is 80%. These results indicate that the SVM is able to classify the cause of the transient effectively.
The fourth order Daubechies wavelet (Db4) was adapted to analyze the disturbance signal since it has the best similarity to power disturbance signals. The samples disturbance signals were decomposed with 10 levels MRA to ensure that all disturbance features are extracted in both high and low frequency spectrum. Support Vector Machine is trained to determine and identify the support vectors which are the parameters that define the optimal hyper plane. Results at level D3 of db4 were selected as an input to SVM. The SVM input vectors that are the maximum and minimum peak value of the wavelet detail function of the wavelet are normalized within [0-10]. Normalization is done to eliminate the risk of numerical problems during the training process. The processed features are stored in m by n dimensional training matrix, in which m and n is input and output of the SVM respectively. A 2D SVM classifier is employed with +1 and -1 for the transient caused by the capacitor switching and lightning respectively. A total of 96 samples constitute the database with both samples of capacitor switching and lightning that are equally divided. The samples are defined into two classes with +1 for capacitor switching and -1 for lightning. In this experiment, about 70% samples are randomly selected to construct the training data set, whilst the remainder is used for testing. The proportion of each class sample in both dataset is equal. The results of the classification using SVM in which the minimum and maximum voltage peak values as the inputs are presented in Fig. 3. Fig. 3 shows that, the transient caused by lightning and
ISSN: 1792-507X
Classification Result 1.5 1 0.5 predict results
0 -0.5
0
5
10
15
20
25
classification results
-1 -1.5
Fig. 3: Classification results from Support Vector Method
Results on the wavelet energy as the input of the SVM are presented in Fig. 4. Fig. 4 a) and b) shows the energies of 10 level decomposition for transients caused by capacitor switching and lightning respectively. As shown in Fig. 5.0, energy level 8 and 9 are more significant as compared to the other levels. These distinctive features are important for the performance of classifier. Hence, these energy levels are used as the inputs for SVM classification. The feature set are normalized between [-1,1] before presented to classifier to reduce space and enhance the performance of the classifier.
394
ISBN: 978-960-474-230-1
Energy
Energy
SELECTED TOPICS in SYSTEM SCIENCE and SIMULATION in ENGINEERING
Level Fig. 4: Wavelet energy distribution of transient by a) capacitor switching b) lightning
by capacitor switching or lightning in the power system distribution system.
For classification using energy level 8 and 9 as the SVM inputs, a total of 72 samples constitute the database both of capacitor switching and lightning have been used. The samples are defined into two classes, with +1 and -1 for capacitor switching and lightning respectively. In this experiment, about 70% sample is randomly selected to construct the training dataset, whilst the remainder is used for testing. The proportion of each class sample in both dataset is almost equal. Fig. 5 shows that the classification for the cause of the transient and capacitor switching is denoted by class +1 and -1 respectively. In this experiment, it has been found that the testing classification accuracy is 54%. This results indicate that only 54% of the transient cause is correctly classified using the energy level as the SVM inputs.
Acknowledgments The authors would like to acknowledge the Ministry of Science and Technology Invention for the grant to support the research and also the government of Malaysia for the scholarship awarded.
SVM CLASSIFICATION RESULT
CLASS LABELS
1.5 1 0.5
predict results
0 -0.5 0
20
40
60
80
classification results
-1 -1.5 CLASS DATAS
Fig. 5: Classification results from Support Vector Method based on energy.
4 Conclusions In this paper, results attained using RBF kernel function of the SVM has proved that the method can be used to classify the causes of transient. Comparison made between the two types of feature extraction, the minimum and maximum of peak voltage values and the wavelet energy level reveal that, the former is superior in accuracy (80%) to classify the cause of transient. The RBF kernel has been identified as the best kernel to classify the causes of transient as either
ISSN: 1792-507X
395
References: [1]. L. van der Sluis, Transient in Power System. Chichester, U.K: Wiley, 2001 [2]. 2M.F. McGranaghan, T.E.Grebe, G.Hensley, M.Samotyj and T.Singh “Impact of utility switched capacitors on customer systems-Part II: Adjustable speed drive concerns,” IEEE Trans. Power Del., vol 6, no.4, pp 1623-1628, Oct, 1991. [3]. V .E.Wagner, J.P.Staniak and T.L.Orloff „Utility capacitor switching and adjustable-speed drives,” IEEE Trans.Ind.Appl., vol 27, no 4, pp 645-651, Jul/Aug 1991. [4]. C.Li, T. Tayjasanant, W.Xu and X.Li Method for transient detection by investigating slope of the system trajectory, IEEE Proc. Gerner. Transm. Distrib. Vol 150, No 3,pp 367-372, 2003. [5]. Przemyslaw, Janik and Tadeusz Lobos Automated Classification of Power Quality Using SVM and RBF Networks, IEEE Trans On Power Delivery, vol 21,pp 1663-1669, 2006. [6]. Weiming Tong, Xuelei Song, Jingbo Lin, Zhiheng Zhao, Detection and Classification Power Quality Disturbances Based on Wavelet Packet Decomposition and Support Vector Machines, Proc. Of the 8th Int. Conference on Signal Processing, vol. 4, pp 16-20, 2006 [7]. Guo-Sheng Hu, Feng-Feng Zhu, Zhen Ren, Power Quality Disturbances Identification using Wavelet Packet Energy Entropy and Weight Support Vector Machine 2007. [8]. Sheng-Wu Xiong, Ziao-XiaoNiu, Hong-Bing Liu, Support Vector Machines Based On Subtractive Clustering, Proc of the 4th Int. Conference on
ISBN: 978-960-474-230-1
SELECTED TOPICS in SYSTEM SCIENCE and SIMULATION in ENGINEERING
Machine Learning and Cybernetics, pp. 43454350, 2005 [9]. S. Chen, H.Y.Zhu Wavelet Transform for Processing Power Quality Disturbances, EURASIP Journal on Advances in Signal Processing, vol2007, Hindawi Publishing Corporation. [10]. Resende, J.W., Chaves, M.L.R., Penna, C., Identification if Power Quality Disturbances Using
ISSN: 1792-507X
The MATLAB Wavelet Transform Toolbox, Universidade Federal de Uberlandia (MG)-Brazil [11]. V M Reddy, SS Rao, FJ Mercede, On The Use of Wavelet for the Detection and Analysis of Power System Transients, 0-7803-4403-0/98/IEEE [12]. Sami Ekici, Classification Of Power System Disturbances Using Support Vector Machines, Expert Systems with Applications 2009.
396
ISBN: 978-960-474-230-1