matching principle, the identity of mesh pattern pre- r[cp] is the number of pixels occurring in an image sented in an input text image can thereby be determined.
MVA'94 IAPR Workshop on Machine Vision Applications Dec. 13-15, 1994, Kawasaki
Mesh Pattern Recognition Using Correlation Matching Method Chin-Chuan Han
Kuo-Chin Fan *
Institute of Computer Science and Information Engineering National Central University, Chung-Li, Taiwan, R.O.C.
ABSTRACT In this paper, a novel method is proposed to recognize the type of mesh pattern synthesized in a binary text image. Since the pixels of mesh pattern are regularly arranged, it is intuitive to identify the type of mesh pattern by analyzing the regularity of black pixels in the considered image. To achieve the recognition goal, the coefficient of correlation between the input image and the mesh pattern stored in the database is calculated to determine the type of mesh pattern presented in the input image. Experimental results are conducted to verify the validity of our proposed method.
1
INTRODUCTION
Text characters synthesized with mesh patterns appear in many disk top publications frequently. For instance, the title together with certain mesh pattern emphasizes the importance of an article to attract the interest of readers. Computer systcm designers utilize the mesh patterns in flowchart design to distinguish one module from other modules. However, if the document is synthesized with mesh patterns, the performance of available optical character recognition system will deteriorate drastically. Hence, removing the mesh pattern from the synthesized text characters before the character recognition process is prerequisite to resolve the recognition problem. To achieve this, the identity of mesh pattern in the synthesized images is firstly identified. And then a specified filter is designed to filter out the mesh pattern. In this paper, we will propose a novel method to identify the identity of mesh pattern in the synthesized images. A mesh pattern can be considered as a region with regular textures. Texture is an important characteristic feature in the image analysis. During the past years, three major approaches, statisticnl, spectral, and structural[l - 51, have been developed to extract the texture information. In the statistical approach, the image texture is considered as finding the useful features such as the fineness, coarseness, contrast, directionality, roughness, and regularity of images. In practice, the co-occurrence matrix approaches are widely used to extract the texture information of images. However, the texture information is character'ized by a set of multi-dimensional features in these methods. Spectral techniques[6, 7) are based on the Fourier spectrum
and are primarily used to detect global periodicity in an image by identifying the high-energy or narrow peaks in the spectrum. As to structural techniques[8, 91, they deal with the arrangement of image primitives, such as the description of texture based on regularity space. Recently, the texture spectrum method[4,5] has been proposed as a statistical approach to analyze the texture signals. The texture unit is designed t o characterize the local texture for a given pixel and its neighborhood. The texture information can be characterized as the texture spectrum which is the occurrence frequency function of all texture units within the image. However, all of them are the gray-scale images application. Carefully analyze the binary mesh pattern images, we perceive that the black pixels(value 1) of mesh pattern are arranged regularly and the mesh pattern can be considered as a region with regular texture. A novel method is developed to recognize the mesh pattern type presents in the considered text image by analyzing the regularity of black pixels.
2
THE APPROACH
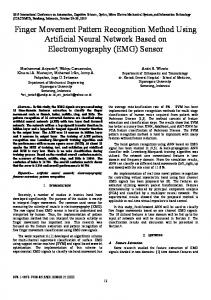
The methodology of our proposed method is composed of five main modules: (1) noise removal; (2) generation of pixel arrangement histogram; (3) data filtering and normalization of statistical data; (4) measurement between two statistical data sets; (5) correlation matching. Before describing the five modules, an encoded function is firstly defined to facilitate the later process. Consider a pixel P and its eight neighboring pixels Po, P I , . . . ,P7 as shown in Figure l(a), the arrangement of these eight pixels can be encoded by
and a byte value cpp (0 -- 255) as shown in Figure l ( b ) is accordingly obtained. Note that for conciseness sake an encoded value cp, for example cp = 63, is represented in hexadecimal form such as 3FI6 in the rest of the paper.
Module 1 : Noise removal Noise removal module is a preprocess procedure to remove the unwanted noises, improve the quality of input
(a)
Figure 1: (a) A pixel P and its eight neighboring pixels, (b) the encoded byte of these eight neighbors.
(b)
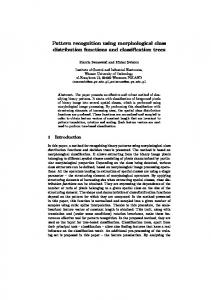
Figure 2: (a) Mesh pattern image with horizontal and vertical lines, (b) the arrangement histogram of (a).
image and enhance the performance of later recognition task. In the processed image, if a pixel P in a 3 x 3 mask satisfies
the pixel P will be treated as a black noise and removed. Besides, if the pixel P satisfies the following criteria :
2.
= IFl6 or 06167
cpp
cpp
= F8i6 or 9 p = 6BI6 or
cpp
=
the pixel P will be considered as a white noise and will thereby be set as a black pixel. In the noise removal module, the black and white noises presented in an image will be processed accordingly following the stated principles. M o d u l e 2 : G e n e r a t i o n of pixel a r r a n g e m e n t histogram The main purpose of this module is to reflect the geometric arrangement of a pixel by encoding its corresponding neighborhoods. All pixels in the mesh pattern image are encoded by Equation (1). Then count the number of pixels for a particular arrangement code 9 , denoted r[9], to generate the arrangement histogram for each possible arrangement. To best illustrate the generation of arrangement histogram, let us consider the image consisting of horizontal and vertical lines as shown in Figure 2(a). After encoding and counting the number of pixels for all arrangements. an arrangement histogram as shown in Figure 2(b) is thus obtained. Since the pixels of mesh pattern is regularly arranged, some arrangements of pixels, such as 42i6, 18i6, 9416, etc., as shown in Figure 2(c) occur frequently. An example of synthetic binary image as shown in Figure 3(a) is generated by adding a text character 'A' into the mesh pattern (e.g., Figure 2(a)). The arrangement histogram as shown in Figure 3(b) for this synthetic image can be obtained accordingly by making use of the above rules. Making comparisons between the
Figure 3: (a) An image with character 'A' and 'grid' mesh pattern, (b) the arrangement histogram of (a) before filtering, (c) the arrangement histogram of (a) after filtering. two arrangement histograms of Figures 2(b) and 3(b), the pixels whose arrangement code is changed due to the appearance of boundary pixels are very rare. That is; the arrangement histogram would not be changed too much even though the text characters are added into the mesh pattern images. Furthermore, Figure 4 demonstrates the examples of three different mesh patterns without any text character with their corresponding histograms being plotted at the right-hand side. These histograms are stored in the mesh pattern database for later correlation mat,ching module. From Figure 4, an important verdict is observed: Different mesh patterns will generate different arrangement histograms. This verdict is the foundation for use in the recognition process. Based on these tmining data stored in the database, the type of mesh pattern embedded in an input text image can be recognized. M o d u l e 3 : D a t a filtering a n d normalization of statistical d a t a After adding - the text characters. the number of pixels whose arrangement code is changed due to the appearance of boundary pixels is relatively rare comparing to those of the pixels without change. A simple filter rule is designed as
r[91=
{
;[lp1
')
if r[pl otherwise;
for 9 = 0,1,. . . ,255 (2)
Figure 4: Three arrangement histograms of three different mesh patterns. where :
matching principle, the identity of mesh pattern presented in an input text image can thereby be determined with arrangement code cp, and the value is the average by choosing the one with the maximum correlation coefnumber which equals Cy20I'[cp]. ficient. For the given example, the correlation coefficient of the two images as shown in Figtlre 2(a) and FigIf the number for a specific arrangement code is smaller p,, than the average number, the number for this code is set ure 3(a) is 0.992 which is the maximrlm correlation coefto zero. Because this arrangement code may be considficient value comparing with the correlation coefficients ered as the code generated via the boundary pixels of for the input image in Figure 3(a) and three mesh patadded text characters. Otherwise, if the number for an tern images in Figure 4 which are -0.059, -0.029 and arrangement code is larger than the average number, the -0.037, respectively. Therefore, we can conclude that number for this arrangement code remains unchanged. the input image is a text image mixed with the mesh According to the expression stated in Equation (2), pattern of horizontal and vertical lines. a new arrangement histogram as depicted in Figure 3(c) is thus generated from Figure 3(b). 3 EXPERIMENTAL RESULTS Since the sizes of input text image and mesh pattern In this section, some experimental results are illusimage stored in the database may be different, the nortrated show the of O u r proposed method. malization procedure should be performed to normalize Eight mesh patterns as in Figure 5 are the size of arrangement code in the arrangement histhe scanner 'Onstruct the database. Each mesh togram. The rules for normalization can be formulated pattern is identified with an identity, such as type A , B, as . . . , F. The arrangement histograms for each mesh pat~[cP] tern in the database are also displayed at the right-hand x,# = for = 0,1,. . . ,255. (3) ~[cP]' side of each mesh pattern. In Figure 5, we only plot the arrangement codes from 1 to 254 in each histogram. Module 4 : The measurement of two statistical Two real images as shown in Figure 6 are inputted data sets from a platform scanner. They are two examples of text In this module, an evaluation hlnction, correlation characters with F type mesh pattern, and text characters with mesh pattern. The arrangement hiscoefficient[lO], is devised to measure the similarity of in. put, image and mesh pattern image stored in the database. tograms for these two images are shown at the rightThe ofcorwlation between the tested random hand side of Figure 6. The correlation coefficients calthese images vs the images in culated for each variable Y and the variable Z in the database is denoted the database are tabulated in Table 1. In Figure 6(a), by p{Y, Z ) and defined as the type of mesh pattern with the maximum coefficient value equaling 0.95 is type F . Similarly, the maximum C:I(YV -m z v p{Y,Z) = (4) correlation coefficient of the image in Figure 6(b) is 0.98. - P)2cF:l(~v - ~ ) 2 ' According to the correlation matching rule, the mesh where: pattern presented in the input image of Figure 6(b) is y = 1 ~ 2v=l5 y,# 4 and Z = & ;izpI z,#are the sample identified as type B. 254 mean of variable Y and 2, respectively. , and ZFF,, in random Four elements ymls, Y F F ] ~ h16, 4 CONCLUSIONS variables Y and Z should be excluded from consideration because the size of these four elements is mostly A pattern method for recogaffected by the body of added Hence, the nizing the pattern presented in a text image is presented in this paper. The basic idea behind our apindexes of Equation (4) start from and end at 254. proach is the analysis of the regularity embedded in the mesh pattern from which the correlation coefficient is Module 5 : Correlation matching developed. The identity of the mesh pattern presented In this module, we adopt the correlation coefficient in an input image can then be obtained by performing the correlation matching. The one with the maximum as the matching criterion to ~ e r f o r mthe recognition job. The correlation matching principle is : The higher the correlation coefficient is identified as the match. Expersimilarity between two statistical sets, the larger the cor- imenting with a wide variety of text images verify the validity of our proposed method. relation coefficient will be generated. According to the
r[cp]is the number of pixels occurring in an image
c:zN,
Jc~:l(y,
-a
Table 1: The correlation coefficients for the four images in Figure 3 vs each mesh pattern image in the database.
tures extraction," Pattern Recognition Lett., vol. 6, pp. 269 - 273, 1987. [5] D. C. He and L. Wang, "Texture features based on texture spectrum," Pattern Recognition, vol. 24, no. 5, pp. 391 - 399, 1991. [6] R. Bajcsy, "Computer Description of Texture Surfaces," Proc. 1973 Int. Conf. Artificial Intell., Stanford, Calif., pp. 572-579.
References [I] R. Bajcsy and L. Lieberman, "Texture Gradient as a Depth Cube," Comput. Gmph. Image Proc., vol. 5, no. 1, pp. 52-67, 1976.
[2] G. R. Cross and A. K. Jain, "Markov Random Filed Texture Models," IEEE Trans. Pattern Anal. Mach. Intell., vol. PAMI-5, no. 1, pp. 25-39, 1983. (31 R. M. Haralick, "Statistical and Structural Approaches to Texture," Proc. 4th Int. Joint. Conf. Pattern Recog., pp. 45-60, 1979. [4] D. C. He, L. Wang, and J. Gilbert, "Texture fea-
[7] D. Chen and L. Wang, "Texture Feature Based on Texture Spectrum," Pattern Recog., vol. 24, no. 5, pp. 391-399, 1991. [8] S. Y. 1,u and K. S. Fu, "A Syntactic Approach to Texture Analysis," Comput. Gmph. Image Proc., vol. 7, no. 3, pp. 303-330, 1978. [9] F. Tomita, Y. Shirai and S. Tsuji, "Description of Texture by a Structural Analysis," IEEE Tmns. Pattern Anal. Mach. Intell., vol. PAMI-4, no. 2, pp. 183-191, 1982. [lo] R. V. Hogg and A. T. Craig, Introduction to Mathematical Statistics, Machillan, New York, 1986.
Figure 5: The mesh patterns and their corresponding arrangement histograms stored in database.
(a) (b) Figure 6: Three real images and their arrangement histograms.