arXiv:1606.02074v1 [stat.AP] 7 Jun 2016
Application of the Signature Method to Pattern Recognition in the CEQUEL Clinical Trial
A. B. Kormilitzin,a,1 K. E. A. Saunders,b P. J. Harrison,b J. R. Geddes,b T. J. Lyonsa a
Mathematical Institute, University of Oxford, Andrew Wiles Building, Woodstock Rd, Oxford OX2 6GG, UK
b
Department of Psychiatry, Oxford University, and Oxford Health NHS Foundation Trust, Warneford Hospital, Oxford OX3 7JX, UK
E-mail:
[email protected]
Abstract: The classification procedure of streaming data usually requires various ad hoc methods or particular heuristic models. We explore a novel non-parametric and systematic approach to analysis of heterogeneous sequential data. We demonstrate an application of this method to classification of the delays in responding to the prompts, from subjects with bipolar disorder collected during a clinical trial, using both synthetic and real examples. We show how this method can provide a natural and systematic way to extract characteristic features from sequential data.
Keywords: stochastic analysis, sequential data, classification, bipolar disorder, digital healthcare
1
Corresponding author.
Contents 1 Introduction
1
2 Methods
3
2.1
Continuous Paths and their relation to raw sequential data
3
2.2
The Signature of a Path
4
2.3
The Signature Based Methodology in Machine Learning
6
2.4
Dealing with Missing Data
7
2.5
The CEQUEL Data
8
3 Results
9
3.1
Technical Details of the Classification Procedure
10
3.2
Computational Considerations
11
4 Discussion and Conclusions
1
12
Introduction
The analysis of streaming data is one of the biggest challenges posed by the expansion of digital healthcare and bioinformatics. A data stream is a sequence of data that arrives over time. Familiar examples are stock prices, sensor data from mobile devices, personal data from monitoring platforms and many more. The field of machine learning and data mining offers various frameworks for discovering patterns, hidden information, and learning the functional dependencies in complex data. Most methods in machine learning require a good choice of characteristic features to learn functions or compute the posterior probabilities. Feature extraction and selection methods are numerous. Unfortunately, there is no clear consensus as to how analyse and extract features from heterogeneous sequential data. In this work we are aiming to introduce a novel framework for the analysis of data streams. Our approach is based on the mathematical theory called rough paths theory. This allows one to solve controlled differential equations driven by rough signals [1] as well as to solve stochastic partial differential equations [2–4].
–1–
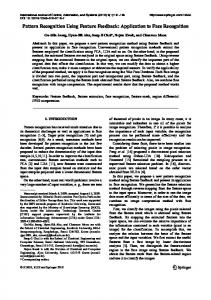
The foundations of the proposed approach date back to the seminal work [5] on iterated integrals of multidimensional piecewise smooth paths. The core ingredient of the theory is a signature. The signature is a transformation of a path into the sequence of its coordinate iterated integrals, whereas the integrals obey particular algebraic properties. Here we describe an application of the signature method to the analysis of longitudinal mood data from the clinical trial of treatments for bipolar depression. Bipolar disorder is a mental illness characterised by episodes of elevated mood (manic episodes) and periods of depression (low mood states) [6]. Depressive episodes are longer in duration that periods of mania and are associated with long-term disability and a high risk of suicide [7–9]. Effective treatments for bipolar depression are limited. One of the widely used medications is quetiapine, an atypical antipsychotic agent. Another recommended treatment is lamotrigine, an anticonvulsant. CEQUEL (Comparative Evaluation of QUEtiapine-Lamotrigine combination versus quetiapine monotherapy in people with bipolar depression) was a double blind randomised placebo controlled parallel group trial of lamotrigine plus quetiapine versus quetiapine monotherapy in patients diagnosed with bipolar disorder currently suffering from a depressive episode. [10]. The primary outcome measure for the trial was improvement at 12 weeks in patientreported depressive symptoms using the the 16 item Quick Inventory of Depressive Symptomatology - Self Report (QIDS-SR16 ) [11]. The resulting overall scores are represented by integer numbers and lies in the range between 0 and 27 for QIDS-SR16 . Subjects were encouraged to submit their QIDS-SR16 on a weekly basis, and were prompted by text or e-mail sent using the True Colours platform (TC)1 . Missing data correspond to absence of response within one week interval between the reminders. Typical self-reported data from subjects is presented in Fig. 1a. The original data analysis [10] reported a significant improvement in depressive symptoms in patients randomised to lamotrigine compared with placebo.In our reanalysis of the data we focus on timestamps of the responses rather than the actual rating scale scores and examine the regularity of responses in the different treatment groups. The objective data were delays, defined as time intervals between the prompts and the actual response. Delays are schematically depicted in Fig. 1b. These represent the time it took for participants to complete their mood ratings following the receipt of a prompt to do so. Psychomotor retardation is a common symptom of depression [12–14] and these delays are likely to be representative of this impairment. Shortening of delays would predicted to occur as depressive symptoms improved. Given that mood lability, in addition to depression and mania, characterizes bipolar disorder [15], we were also interested to determine the regularity in response timings. We formulated the problem as a binary classification problem: is there a difference between 1
https://truecolours.nhs.uk/demo/documents/PatientGuide.pdf
–2–
27 QIDS
Score
18
9 di
0
0
50
days
100 150 200 250 300 350
Time [days]
0
(a) QIDS-SR16
7
14
21
28
35
(b) Delays
Figure 1: Left panel: examples of two rating scales QIDS-SR16 (blue line) and the AMSR (red line). Right panel: Response delays di of subjects. The dashed vertical lines correspond to the time stamp of the prompt text and the red dots correspond to time stamps of actual responses. The sequence of delays in this example is: d = (4, 2, 5, 0, 5, 0). two treatment groups “0” (placebo) and “1” (lamotrigine) conditioned on the distribution of delays.
2
Methods
One may think of the signature as a transformation of data into a sequence of real numbers (signature terms), which summarise the information hidden in data. These signature terms are then used as a systematic set of features of the data for any machine learning task. Intuitively, this method is similar to spectral methods (for example, the Fourier transform), where the iterated integrals of data serve as basis functions, but quite different conceptually. Recently, the signature framework for the time-series models [16] has been proposed and successfully applied to financial data streams [17]. In the following sections we will elaborate on this approach and provide the detailed mathematical derivations.
2.1
Continuous Paths and their relation to raw sequential data
Consider a collection of N d-tuples X = {X1i , X2i , ..., Xdi }N i=1 , where each Xki represents an individual one-dimensional sequential data. We embed the discrete set of data into a continuous path by piecewise interpolation methods. For example, consider a set of pairs {(ti , Xi )} and a set of triples {(ti , Xi , Yi )}. In Fig. 2, the left panel shows the stairstep =5 piecewise (axis path [18]) embedding of the pairs X = {ti , Xi }N i=1 into a path, and the right panel shows a path constructed from the set of triples X = {ti , Xi , Yi }5i=1 in threedimensional space.
–3–
10 axis path raw data
10
X
Y
5 0 -5
5 0 10
1
2
3
4
5
5
0
X
t
-5
4 5 3 1 2
t
Figure 2: Examples of embedding of the raw discrete data into continuous paths: in two dimensions (left panel) and in three dimensions (right panel). The data set is given by: t = {1, 2, 3, 4, 5}, X = {1, 5, 3, −2, 7}, Y = {2, 7, 5, 1, 10}. Another important type of embedding of discrete data streams is the Lead-Lag transformation. It accounts for the relationship between the subsequent elements of the streams, which results in revealing the cross correlated information hidden in data. Formally, the lead-lag transformation of the stream {X}N i=0 is defined separately for the lead and the lag streams: lead lead = X2n+1 = Xn+1 ; ∀n ∈ {0, ..., N − 1} X2n+2
(2.1)
lag lag X2n = X2n+1 = Xn+1
The lead-lag transform of the stream {X}N i=0 is defined by the two concatenated streams: lead {X lead−lag }2N , Xilag )}2N i=0 = {(Xi i=0
(2.2)
The transformation of data streams into continuous paths in higher-dimensional space is the first step in our approach, followed by the computation of coordinate iterated integrals of continuous paths. 2.2
The Signature of a Path
The signature of a path is a sequence of its coordinate iterated integrals [19]. Let the X be a path in Rd parametrized on interval [0, T ] with finite p-variation for some p < 2. The iterated integrals of order k with multi-index I = (i1 , i2 , ..., ik ) of the path X are defined as: Z I (2.3) dXui11 dXui22 ...dXuikk . X = 0