Application of Phased Array Technology for Identification of Low ...
Recommend Documents
Commissariat a PEnergie Atornique, LIST/SISC, CEA Saclay, Bdt. 611, 91191 Gif-sur-Yvette cedex, France b nstitut de Radioprotection et de SCiret6 Nucl6aire, ...
Figure 1. Conical-scanning phased array of phased arrays using liquid crystal on silicon optical phased arrays (LCoS. OPAs). The LCoS OPA technology offers ...
Download Best Book Phased-Array Radar Design: Application of Radar ..... development of initial concepts and overall sys
electromagnetic simulations and compared to analytic results. Keywords: Infrared ... as an interelement phase shift acquired during propagation along the CPS.
IN the endless pursuit of higher bandwidth for wireless communications, researchers and industries are becoming more and more interested in millimeter wave ...
Krutz GW, Schueller JK: Advanced engineering: future directions for the
agricultural and ... Biotechniques 2001, 30:368-376. 13. Loy A ... BioTechniques
Books;.
Phased Array System Toolbox™ Getting Started Guide .... Phased Array System
Toolbox™ provides algorithms and tools for the design, simulation, and analysis
...
7.7. Shaped Beams. The radiation pattern of an array may be shaped by modify- .... In phased arrays, this phase front is adjusted to steer the beam by individual ...
technology of choice for scanning a large effective aperture over a wide field of .... Therefore, wavefront error from the PAPA device has to be sensed, and the ...
in both the station layout and the array configuration of future aperture arrays is strongly recommended. This is particularly ... formed output of each station is transported to the central cor- relator to ...... Conference, Glasgow, UK, 24. Wijnhol
Jan 23, 2013 - dielectric lenses or planar lens-arrays to form directive beam-steering system. The use of ... The lens, that is usually significantly larger than the phased array, ... lens and phased-array are parallel to each other and perpendicular
range vs. range through-wall and free-space radar imagery. Images are .... between Python and C++, SWIG leverages a NumPy interface file that properly wraps ...
to optical beam forming for phased array antennas, using optical ring resonators. ... and a so-called beam forming circuit. In contrast to for ... controlled- the radiation pattern of a .... continuously tunable beam steering mechanism with fully.
array antenna working on the 5.2 GHz industrial, scientific and medical (ISM) ... sive radiators, and they are suitable for beam steering and null steering ... Radiation pattern of the array of 1, when elements 1 and 2 are driven with equal ..... 697
motivation for using phased array systems in radio astronomy and provide an .... The APERTIF system provides a net gain in survey speed compared to the ...
May 10, 2011 - of Science, Bangalore 560012, India. AbstractâThis paper presents the design, development and experimental characterization of a ... phased arrays required in radar and space communication applications. 1. INTRODUCTION ...... Godara,
tively using the GCF, and the weather signal cannot be extracted. .... 30. 35. 40. 45. 50. 55. 60. Power (dB). Capon. SLC. GCF. Fourier w/ Clutter. Fourier w/o ...
to that of the distributed MEMS transmission line phase shifters. Various components ... large antenna systems, beam steering can be achieved mechanically or.
May 10, 2010 - AbstractâThe first phased array radar dedicated to weather ... channels will enable the use of advanced signal processing to improve ...
Commercially available Liquid Crystal on Silicon (LCoS) Optical Phase Arrays (OPA) are capable of non-mechanically beamsteering up to ±3 degrees at 1550 ...
By applying a linear phase ramp across the beam's wavefront as it leaves the system, the light propagating along the system's optical axis is steered to an ...
Identification of Hypermethylated CpG Site in Lung Cancer ... hypermethylation of CpG islands associated with tumor suppressor genes (TSGs) can lead to.
Feb 7, 2014 - The aperture-array test facility at CSIRO Parkes Ob- servatory ... digital receiver and beamformer in a neighbouring hut. A nearby 12 m ...
Application of Phased Array Technology for Identification of Low ...
Occupational Safety and Health and should not be construed to represent any agency ... and Health Administration (MSHA), Continuous Mining Machine (CM) operators ..... Proceedings of NCAD 2008, Dearborn, Michigan, July 28-30, 2008.
Application of Phased Array Technology for Identification of Low Frequency Noise Sources
Hugo E. Camargo, NIOSH, USA., E-mail: [email protected] Patricio A. Ravetta, AVEC Inc., USA, [email protected] Ricardo A. Burdisso, AVEC Inc., USA, [email protected] Adam K. Smith, NIOSH, USA, [email protected] The findings and conclusions in this report have not been formally disseminated by the National Institute for Occupational Safety and Health and should not be construed to represent any agency determination or policy. Reference to specific brand names does not imply endorsement by NIOSH.
Summary Noise Induced Hearing Loss (NIHL) is the most common occupational disease in the U.S. with devastating consequences particularly in the mining industry. A study conducted by the National Institute for Occupational Safety and Health (NIOSH) revealed that 90% of coal miners have hearing impairment by age 50, compared to only 10% of those not exposed to occupational noise. According to the Mine Safety and Health Administration (MSHA), Continuous Mining Machine (CM) operators account for 30% of workers exposed to noise doses exceeding the Permissible Exposure Level (PEL). This number becomes more dramatic considering that 49% of the total national underground coal production is extracted using these machines. In this context, NIOSH is conducting research to identify and control dominant noise sources in CMs. Previous noise source identification was performed using a Brüel &Kjær (B&K) 1.92-m diameter, 42-microphone phased array. These measurements revealed that the impacts from the conveyor chain onto the tail roller, and the impacts from the conveyor chain onto the upper deck are the dominant noise sources at the tail-section of the CM. The objectives of the work presented in this paper were: 1) To rank the noise radiated by the different sections of the conveyor, and 2) to determine the effect of a urethane-coated tail roller on the noise radiated by the tail-section. This test was conducted using an Acoustical and Vibrations Engineering Consultants (AVEC) 3.5-m diameter, 121-microphone phased array. The results from this new test show that a urethane-coated tail roller yields reductions in the tail-section of 2 to 8 dB in Sound Pressure Level in the frequency range of 1 kHz to 5 kHz. However, integration of the acoustic maps shows that the front-section and mid-section of the conveyor also contain dominant noise sources. Therefore, a urethane-coated tail roller in combination with a chain with urethane-coated flights that reduces the noise sources in the front and mid sections of the conveyor is required to yield a significant noise reduction on the CM operator’s overall exposure. These results show the applicability of phased array technology for low frequency noise source identification.
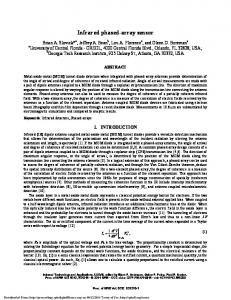
1. Introduction Coal is one of the main energy sources used in the United States of America. During the last decade, coal-generated electricity accounted for 48.98% to 52.83% 1 of the total electricity generated nationwide. As such, coal mining is a well-regulated industry. However, in spite of over 30 years of regulation, NIHL continues to be one of the most common occupational diseases among miners. A study conducted by the National Institute for Occupational Safety and Health revealed that 90% of coal miners have hearing impairment by age 50, compared to only 10% of those not exposed to occupational noise 2 . Half of the underground coal production is extracted using the room and pillar method. In this mining method, a self-propelled machine known as the CM is used to rip the coal from the face and load it into shuttle cars in a continuous operation. A CM has three main noise-radiating components: the cutting head, the chain conveyor, and the scrubber system. The cutting head is used to rip the coal from the face and consists of a rotating steel drum equipped with cutting bits. The chain conveyor is used to transport the ripped coal from the front to the back of the machine; it is driven by a sprocket wheel located at the front, and it goes around an idler tail roller at the back of the machine. The scrubber system is used to collect the dust generated during the cutting process by means of a vane axial fan that pulls air through the dust collector. The three noise radiating components, as well as the tail roller are shown in Figure 1.
Operator Location
Figure 1. Noise-radiating components on a CM. The use of a CM during the extraction process and the proximity of the operator and helper to this machine in a diffuse field environment, are definitely among the predominant factors leading to NIHL. According to MSHA, 30.2% of CM operators in 2006 were exposed to noise levels higher than the Permissible Exposure Level (PEL) 3 . Within this framework, and in an effort to reduce NIHL in CM operators and their helpers, NIOSH is currently conducting research to attenuate the sound radiated by a CM. Previous tests involved using a 1.92-m diameter, 42-microphone B&K phased array to identify noise sources on a Joy 14CM9 CM. Measurements along the sides, front, back, as well as from overhead of the CM were performed. The acoustic maps obtained from these measurements showed that the impacts from the conveyor chain onto the tail roller, upper deck and the side walls of the conveyor are the dominant noise sources at the tail section in the 1.0 kHz to 1.6 kHz frequency range 4 . To reduce the impacts from the conveyor chain onto the tail roller, a prototype coated roller was built. This prototype consisted of a standard steel roller coated with an 84shore A durometer urethane. The use of this prototype yielded a reduction in the total radiated sound power level of 3.6 dB(A) 5 .
The objectives of the work presented in this paper are: 1) To rank the noise radiated by the different sections of the conveyor, and 2) to determine the effect of a urethanecoated tail roller on the noise radiated by the tail-section. To this end, a 40-shore A durometer coated tail roller was built and tested using a microphone phased array.
2. Experimental Setup Acoustic measurements of a JOY 14CM9 CM were conducted in a Hemi-anechoic chamber at the Pittsburgh Research Laboratory (PRL), as shown in Figure 2. This chamber is 18.7-meter long, by 10.1-meter wide, by 7.0-meter high and meets the requirements of ISO 3744 down to 100 Hz. Figure 2 also shows the microphone phased array used to collect the data in the overhead configuration. Figure 2. CM in the Hemi-anechoic chamber. 2.1 Phased Array Measurements Measurements were performed using an AVEC beamforming system that consists of a 3.5-meter diameter, 121-microphone phased array arranged in a star configuration, instrumented with a 128-channel data acquisition system. This system was used to collect data simultaneously and continuously for all the microphones at a sampling frequency of 51.2 kHz. Sixteen seconds of data were collected, providing sufficient data for 100 averages of 8192 samples. Since the focus of the test was on the noise radiated by the conveyor of the CM, the phased array was set up at two different overhead positions: one position close to the middle of the conveyor and one position above the end of the tail section, as shown in Figure 3a and in Figure 3b, respectively.
(a)
(b)
Figure 3. Microphone phased array positions with respect to the CM: a) Array position 1, and b) array position 2.
2.2 Test Configurations Two different configurations were tested: 1) The CM provided with a standard steel tail roller, and 2) the CM with a prototype urethane-coated tail roller. Figure 4 shows the two tested tail rollers.
(a) Standard steel tail roller.
(b) Urethane coated tail roller.
Figure 4. Tested tail rollers. To simulate the damping effect of coal on the noise radiated by the conveyor during normal operation, a water flow at a constant rate of 4 gal/min was supplied at the midsection of the conveyor.
3. Results Based on the different noise sources identified along the conveyor path, the conveyor can be divided in three parts: Front, mid, and tail sections, shown in Figure 5. Tail Pivot
Front-section
Tail-section
Mid-section Figure 5. Conveyor sections as seen from overhead. 3.1 Tail Roller Noise The acoustic maps obtained from the CM with the standard steel tail roller are shown in Figure 6. These maps confirm that the conveyor chain/tail roller interaction is one of the dominant noise sources in the back of the CM. Other noise sources can be seen in the mid-section of the conveyor, in particular near the tail pivot, and further upstream in the conveyor. For all frequencies, multiple sources or a distributed source in the very end of the tail were identified. Figure 7 shows the acoustic maps obtained from the CM with the urethane-coated tail roller. On the one hand, this figure shows that the urethane-coated tail roller reduces the noise in the tail-section, i.e., there are no noise sources on the tail roller except at 1 kHz. On the other hand, this figure shows that the noise sources on the mid-section
and front-section of the conveyor remain unchanged, i.e., the urethane-coated tail roller has no effect on the noise radiated by these sections.
a) Standard tail roller at 1000 Hz.
a) Coated tail roller at 1000 Hz.
b) Standard tail roller at 1250 Hz.
b) Coated tail roller at 1250 Hz.
c) Standard tail roller at 1600 Hz.
c) Coated tail roller at 1600 Hz.
d) Standard tail roller at 2000 Hz.
d) Coated tail roller at 2000 Hz.
Figure 6. Standard steel tail roller.
Figure 7. Urethane-coated tail roller.
A quantification of the noise reduction achieved with the urethane-coated tail roller was obtained by analyzing the integrated spectra over the tail-section, as shown in Figure 8. The integration was performed by adding the levels of all the grid points inside the integration region and applying a normalization factor given by integration of the point spread function of the array in the region 6 . The cutoff for the integration was set to 5 dB from the peak level in the integrated region.
Figure 8 shows a significant reduction in Sound Pressure Level in the 1 kHz to 5 kHz frequency range. Such reduction varies from 2 to 8 dB. Between 250 Hz and 1 kHz, the reduction is not significant. It should be noted that below 630 Hz the roller is not the main noise source, and thus, the integrated spectra is most likely reflecting levels due to sidelobes of louder sources at such frequencies. 90
Figure 8. Integrated spectra over an area enclosing the tail roller. 3.2 Conveyor Noise This section “combines” the results obtained with the two array positions to identify and perform a relative comparison of noise sources in the mid-section and frontsection of the conveyor. To better compare the noise from different conveyor sections, the results obtained with the urethane-coated tail roller were used, assuming that the tail roller noise can be reduced with the urethane treatment. Figure 9 shows sample acoustic maps obtained with the array close to the center of the CM (Figure 3a). These maps show, on one hand, that the front-section of the conveyor contains dominant noise sources over the entire frequency range. Furthermore, no other sources are visible above 2 kHz in the mid-section, i.e., the conveyor front-section is at least 5 dB louder than any other source at such frequencies. On the other hand, the tail roller noise is not as significant as seen with the array above the tail-section (Figure 3b) due to the urethane-coated tail roller and the relative array position. Therefore, a direct comparison cannot be made between the noise levels on the front part of the conveyor and the noise levels on the tailsection. However, this comparison can be made from different array positions and different tail roller configurations using the integrated spectra.
(a) 250 Hz.
(b) 500 Hz.
(c) 800 Hz.
(d) 1600 Hz.
(e) 2000 Hz.
(f) 3150 Hz.
Figure 9. Noise sources identified with the array close to the center of the CM (array position 1). Conveyor with urethane-coated tail roller.
Acoustic maps obtained with the array above the tail-section (Figure 3b), show that the noise levels on the mid-section of the conveyor are slightly higher at some frequencies. Since both array positions cover one half of the mid-section, as shown in Figure 3, such louder levels corresponding to position 2 were used for the integrated spectra analysis. Thus, the noise from the front-section was obtained with the array closer to the center of the conveyor (Figure 3a) while the spectra for the mid-section and tail-section were obtained with the array closer to the end of the machine (Figure 3b). The integrated spectra results are shown in Figure 10. From this figure it can be seen that the front-section and mid-section contain the loudest sources. The levels for such regions are similar below 2.5 kHz. Above 2.5 kHz the front-section of the conveyor is the loudest source. Note also that the mid-section is louder than the tail-section at all frequencies except for the band with center frequency at 3.15 kHz. In the case of the urethane-coated tail roller, the treatment renders a reduction in noise levels that positions the tail-section as the quietest source on the conveyor. As explained before, this results in the noise from the tail-section being at least 5 dB quieter than the other sections for most frequencies and hence not “visible” in the previous maps where a cutoff of 5 dB from the peak levels was used.
From Figure 10 it can be seen that a treated tail roller per se will not yield a significant overall noise reduction. The sources in the front-section and in the mid-section of the conveyor need to be attenuated to have a positive impact on the CM operator’s noise exposure. Based on previous research conducted by NIOSH using a conveyor chain with urethane-coated flights 7, 8 , 9 , it is expected that a combination of the 40-shore A urethane-coated tail roller, and a conveyor chain with 84-shore A urethane-coated flights will yield a significant noise reduction in the overall Sound Power Level of at least 9 dB(A). To this end, future tests will be conducted to confirm this hypothesis. 90
Figure 10. Integrated spectra over conveyor sections.
4. Conclusions Phased array measurements were conducted at the Pittsburgh Research Laboratory. Measurements were performed using an AVEC 121-microphone, 3.5 meter diameter phased array in a hemi-anechoic chamber. Data was collected from two array positions over the CM. The main goals of these experiments were to determine the effect of a urethane-coated tail roller on the noise radiated by the tail-section, and to rank the noise radiated by the different sections of the conveyor. The urethanecoated tail roller was compared to an original steel tail roller. The results consisted of acoustic maps and integrated spectra over identified noise source regions in 1/3rd octave bands. The results indicate that the urethane treatment on the roller is effective in reducing the noise in the tail section between 1 kHz and 5 kHz (about 2-8 dB depending on the frequency band). With such treatment, the tail/roller noise is at least 5 dB below the maximum level on the acoustic maps. Unfortunately, the integrated spectra over the three conveyor sections show that the front-section and the mid-section contain the loudest sources. Above 2.5 kHz the dominant noise sources are in the front-section; below this frequency, the mid-section and the front-section radiate similar noise levels. Therefore, a combination of a urethane-coated tail roller and a chain with urethane-coated flights is required to attenuate the noise sources in the front, mid and tail sections of the conveyor in order to have a significant impact on the CM’s operator overall exposure.
Acknowledgements The authors would like to thank Lynn Alcorn, Pat McElhinney, and Nikolas Macko for their help and support during the test. References 1
Energy Information Administration website, Net Generation by Energy Source by Type of Producer: http://www.eia.doe.gov/cneaf/electricity/epa/epat1p1.html 2
Franks, J.R., “Analysis of Audiograms for a Large Cohort of Noise-Exposed Miners”, National Institute for Occupational Safety and Health, Internal report, Cincinnati, OH,1996. 3
MSHA [2008]. MSHA Standardized Information System, Number of Noise Samples @90PELDose(computed)>=100 by Machine Code, 2006. Denver, CO: U.S. Department of Labor, Mine Safety and Health Administration, Office of Injury and Employment Information. Date accessed: March 20, 2008. 4
Camargo, H.E.., Smith, A.K., Kovalchick, P.G., and Matetic, R.J., “Noise Source Identification on a Continuous Mining Machine”, Proceedings of NCAD 2008, Dearborn, Michigan, July 28-30, 2008. 5
Durr, M.T., Kovalchick, P.G., and Kwait, E., “Evaluation of Engineering Noise Controls for a CM Conveyor System”, Proceedings of NoiseCon2003, Cleveland, Ohio, June 2003. 6
Muller, T. (ed), Aeroacoustic Measurements, Springer 2002.
7
Kovalchik, P., Johnson, M., Burdisso, R., Duda, F., and Durr. M., “Noise Control for Continuous Miners”, Proceedings from the 10th International Meeting on Low Frequency Noise and Vibration and its Control, York, England, Sept. 11-13, 2002, PP. 299-306
8
Smith, A.K., Spencer, E.R., and Alcorn, L.A., “Underground Evaluation of Coated Flight Bars for a Continuous Mining Machine”, Proceedings of Inter-Noise 2006, Honolulu, Hawaii, USA, Dec. 3-6, 2006. 9
Smith, A.K., Peterson, J.S., and Kovalchik, P,G., “Continuous Mining Machine Conveyor System Sound Power Levels”, Proceedings of NoiseCon 2008, Dearborn, Michigan, July 2008.


![[PDF] Download Phased-Array Radar Design: Application of Radar ...](https://m.moam.info/img/260x300/pdf-download-phased-array-radar-design-application_6477d7f2097c4786708c28fc.jpg)