Mar 20, 2006 - λ â Î such that the error e = V â Ï(T,W; λ) is small. Here Ï is a ..... nition, speech recognition, bioinformatics, e-learning, and others. Compared to .... [8] W.M. Isbell, âShock Waves: Measuring the Dynamic Response of Materi-.
arXiv:cs/0603081v1 [cs.AI] 20 Mar 2006
Application of Support Vector Regression to Interpolation of Sparse Shock Physics Data Sets Nikita A. Sakhanenko1,2
George F. Luger
{sanik,luger}@cs.unm.edu 1
Computer Science Department, University of New Mexico
Hanna E. Makaruk
David B. Holtkamp
{hanna m,dholtkamp}@lanl.gov 2
Physics Division, Los Alamos National Laboratory
Abstract Shock physics experiments are often complicated and expensive. As a result, researchers are unable to conduct as many experiments as they would like – leading to sparse data sets. In this paper, Support Vector Machines for regression are applied to velocimetry data sets for shock damaged and melted tin metal. Some success at interpolating between data sets is achieved. Implications for future work are discussed.
1
Introduction
Experimental physics, along with many other fields in applied and basic research, uses experiments, physical tests, and observations to gain insight into various phenomena and to validate hypotheses and models. Shock physics is a field that explores the response of materials to the extremes of pressure, deformation, and temperature which are present when shock waves interact with those materials [17]. High explosive (HE) or propellant guns are often used to generate these strong shock waves. Many different diagnostic approaches have been used to probe these phenomena [8]. Because of the energetic nature of the shock wave drive, often a large amount of experimental equipment is destroyed during the test. Like many other applied sciences, the cost and complexity of repeating a significant number of experiments – or conducting a systematic study of some physical property as a function of another – are simply too costly to conduct to the degree of completeness and detail that a researcher might desire. Often a researcher is left with a sparse data set – one that numbers too few experiments or samples a systematic variation with too few points. The present work applies Support Vector Machine techniques to the analysis of surface velocimetry data taken from HE shocked tin samples using a laser 1
velocity interferometer called a VISAR [2, 3, 6]. These experiments have been described elsewhere in detail [7]. For the purposes of this paper, it is sufficient that the VISAR velocimetry data presented here describe the response of the free surface of the metal coupon to the shock loading and release from the HE generated shock wave. The time dependence of the magnitude of the velocity can be analyzed to provide information on the yield strength of the material, and the thickness of the leading damage layer that may separate from the bulk material during the shock/release of the sample. In section 2 we describe the problem and include more details on the VISAR system (section 2.2). In section 3 the Support Vector Machine technique is presented, and its applicability for our problem is discussed. In section 4 we evaluate the results achieved. Finally, the paper ends with a discussion of related work and conclusions.
2 2.1
Problem definition Metal melting on release
This paper is based on the data obtained from experiments when metal samples are damaged/melted after a high explosive detonation with a single point ignition. A schematic view of the experiment setup is shown in figure 1. A
Figure 1: Schematic representation of the experiment setup: (1) the axis of symmetry of an experiment, (2) VISAR probe, (3) a view area captured by PRAD imagery, (4) reflected laser light, (5) a metal coupon, (6) high explosive coupon, (7) detonator. cylindrically shaped metal coupon is positioned ontop of 0.5 inch thick high explosive (HE) disk. Both the metal and HE coupons are 2 inches in diameter. A point detonator is glued to the center of the HE disc in order to perform a single point ignition symmetrically. Note that all of the components of the experiment 2
setup have a common axis of symmetry. During an experiment a VISAR probe, located on the axis above the metal sample, transmits a laser beam, and the velocity of the top surface of the metal is infered from the Doppler shifted light reflected from the coupon (see section 2.2 for more details). The time series of the velocity measured through out an experiment constitutes the VISAR velocimetry. In the same experiment a proton beam is shot perpendicular to the experiment’s axis. By focussing the beam, a Proton Radiography (PRAD) image of the current experiment state is obtained. This is somewhat similar to X-ray imagery, although Proton Radiography can produce up to 20 or 30 images in a single experiment with an image exposure time of < 50ns. This paper is devoted to VISAR velocimetry data analysis, while discussion about Proton Radiography imagery analysis may be found elsewhere [7]. There are two parameters that vary between different experiments: the metal type of the sample and the thickness of the coupon. By changing the thickness of the metal coupon and the type of metal in the initial setup of an experiment, experimentalists attempt to see the changes in physical processes across the set of experiments. For simplicity, only the experiments on tin samples are described in this paper.
2.2
VISAR data
A Velocity Interferometer System for Any Reflector (VISAR) is a system designed to measure the Doppler shift of a laser beam reflected from the moving surface under consideration so as to capture changes of the velocity of the surface. The VISAR system is able to detect very small velocity changes (few meters per second). Moreover, it is able to measure even the velocity changes of a diffusely reflecting surface.
Figure 2: Schematic view of a VISAR system. A VISAR system consists of lasers, optical elements, detectors, and other components as shown in figure 2. The light is delivered from the laser via optical fiber to the probe and is focussed in such a way that some of the light reflects from the moving surface back to the probe. The reflected laser light is transmitted to the interferometer. Note that since the reflected light is Doppler 3
shifted, one can extract the velocity of the moving surface from the wavelength change of the light. The interferometer is able to identify the increase or decrease of the wavelength of a beam.
Figure 3: Schematic view of the VISAR interferometer. Note that two beams obtained after splitting the initial one travel different optical distances. The captured Doppler-shifted light, the frequency of which is different from that of the initial beam, is transmitted into the interferometer depicted in figure 3, where the beam is split into two. Using optics, two beams travel different optical distances. By adjusting the length of the paths of the beams, the beams are made to interfere with each other before reaching the photodetectors. Finally, the information is extracted from a VISAR system by measuring the intensity signals from the photodetectors. For more details on the VISAR system consult [2, 3, 6]. This method, widely used in the experiments similar to the one described in section 2.1, is reasonably reliable. For instance, the measurements obtained using a VISAR system are in agreement with the results obtained by Makaruk et al. [10] after positions of different fragments visible on a PRAD image were measured and their corresponding velocity was computed. Since this method of information extraction is independent of VISAR, it additionally validates VISAR results.
2.3
Filling gaps of VISAR data
The problem considered in this paper, given a limited number of experiments that are difficult and costly to perform, is to estimate the measurement values for the missing experiments, or the experiments, whose data recordings were not successful. This problem is also strongly related to the one of identifying “outlier” experiments, i.e., those experiments that for some reason went wrong. The data estimation methods can show which experimental data do not fit with 4
other “good” experiments. The task of increasing the informational output of VISAR data is important, due to the limited number of experiments, their difficult implementation, and high cost. Physicists, who attempt to explain all the phenomena of these experiments, can gain better physical insight from the combination of the VISAR data and the estimations than from the experimental data above. Another important application of velocity estimations is for comparison with various kinds of hydrocode models generated by large programs1 that simulate shock or other hard/impossible to perform experiments. The PRAD data, and the other type of information collected during these experiments, can also be supported and even improved by extending the velocity estimations.
3 3.1
Our approach Equivalent problem
Recall that each VISAR data point is a triple ht, w, vi, where t is the time when the measurement was recorded, w is the thickness of a sample, and v is a measured velocity. One can see that these data points lie on a 2-dimensional surface in the 3-dimensional space. Hence the problem identified in section 2.3 can be transformed into the task of reconstructing the 2-dimensional surface from the given VISAR data. In other words, the problem is to find a regression of velocity on the time and thickness of a sample. Formally, given three random variables that map a probability space (Ω, A, P ) into a measure space (Γ, S), velocity, time, and thickness V, T, W : (Ω, A, P ) → (Γ, S), the problem is to estimate coefficients λ ∈ Λ such that the error e = V − ρ(T, W ; λ) is small. Here ρ is a regression function that is ρ : Γ2 × Λ → Γ, where Λ ⊆ Γ is some set of coefficients. In the case of the problem considered in this article, Γ = R. Note that variables T and W are the two factors of a regression, and V is an observation.
3.2
Velocity surface reconstruction using Support Vector Regression
The Support Vector Machine (SVM) uses supervised learning to estimate a functional input/output relationship from a training data set. Formally, given the training data set of k points {hxi , yi i|xi ∈ X, yi ∈ Y, i = 1 . . . k}, that is independently and randomly generated by some unknown function f for each data point, the Support Vector Machine method finds an approximation of the 1 A hydrocode simulation of an experiment is based on a set of physical equations defining the relevant physical laws. The simulation starts from the same initial conditions as the real experiment. The simulations are performed in 2-dimensional or 3-dimensional space, depending on the type of a hydrocode. Note that these simulations are frequently called numerical experiments.
5
function assuming f is of the form f (x) = w · φ(x) + b,
(1)
where φ is a nonlinear mapping φ : X → H, b ∈ Y , w ∈ H. Here X ⊆ Rn is an input space, Y ⊆ R is an output space, and H is a high-dimensional feature space. The Pkcoefficients w and b are found by minimizing the regularized risk [11] R = i=1 Loss(f (xi ), yi ) + λ k w k2 that is an empirical risk, defined via a loss function, complemented with a regularization term. In this paper we use an ε-intensive Loss Function [16] defined as � |f (x) − y| − ε if |f (x) − y| ≥ ε Loss(f (x), y) = . 0 otherwise Note also that the Support Vector Machine is a method involving kernels. Recall that the kernel of an arbitrary function g : X → Y is an equivalence relation on X defined as ker(g) = {(x1 , x2 )|x1 , x2 ∈ X, g(x1 ) = g(x2 )} ⊆ X × X. Originally, the SVM technique was applied to classification problems, in which the algorithm finds the maximum-margin hyperplane in the transformed feature space H that separates the data into two classes. The result of an SVM used for regression estimation (Support Vector Regression, SVR) is a model that depends only on a subset of training data, because the loss function used during the modeling omits the training data points inside the ε-tube (points that are close to the model prediction). We selected the SVM approach for this problem because of the attractive features pointed out by Shawe-Taylor and Cristianini [12]. One of these features is the good generalization performance which an SVM achieves by using a unique principle of structural risk minimization [15]. In addition, SVM training is equivalent to solving a linearly constrained quadratic programming problem that has a unique and globally optimal solution, hence there is no need to worry about local minima. A solution found by SVM depends only on a subset of training data points, called support vectors, making the representation of the solution sparse. Finally, since the SVM method involves kernels, it allows us to deal with arbitrary large feature spaces without having to compute explicitly the mapping φ from the data space to the feature space, hence avoiding the need to compute the product w · φ(x) of (1). In other words, a linear algorithm that uses only dot products can be transformed by replacing dot products with a kernel function. The resulting algorithm becomes non-linear, although it is still linear in the range of the mapping φ. We do not need to compute φ explicitly, because of the application of kernels. This algorithm transformation from the linear to non-linear form is known as a so-called kernel trick [1]. On the other hand, since the available data are the VISAR measurements that capture some characteristics of the unknown function, and each data point 6
is represented by several features, the data is suitable for the application of supervised learning methods, such as SVR. A velocity of each data point is a target value for SVR, whereas the thickness and time are feature values.
Velocity (m/s) 1600 12.7
1400 1200
11.43
1000
10.16 8.89 0 5e-07
7.62
1e-06 1.5e-06
Sample thickness (mm)
6.35
2e-06 2.5e-06 3e-06
Time (s)
3.5e-06
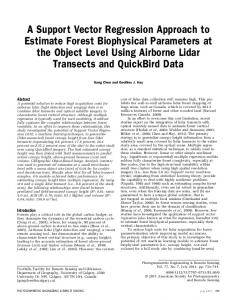
Figure 4: Available VISAR data set In figure 4 the VISAR data set is depicted. It is important to note that the data is significantly stretched along the time dimension. This happens, because the whole dataset is comprised of a number of time series corresponding to a set of measured experiments. During each experiment, the VISAR readings were recorded every 2ns for as long as 6000 time steps. However, for some of the experiments the VISAR system finished recording useful information earlier than for others. The data were cut by the shortest sequence (1656 time steps), since it has been identified experimentally that SVM performs better on the aligned data. On the other hand, if we consider VISAR measurements across the thickness dimension, the data covers the thicknesses starting from 0.25 inch up to 0.5 inch with 0.0625 inch increase. In total 5 time sequences of 1656 points comprise the data used by the SVM method. Figure 5 presents the complete data set projected on the T ime × V elocity plane. The original data is represented by dotted lines, and its smoothed with a sliding triangular window version is depicted with solid lines. Note that the amount of the time steps, where each step is equal to 2ns, is shown on the abscissa. In order to identify the best application of the SVM method to the VISAR data, we use standard k-fold cross-validation. The data is divided into k parts, out of which k − 1 parts are used for training the learning machine, and the last part is used for its validation. The process is repeated k times using each part of the partitioning precisely once for validation.
7
1700 Original data Smoothed data 1600
1500
6.35 mm
Velocity
1400 7.94 mm
1300
1200
9.53 mm
1100
11.11 mm
1000 12.7 mm 900
800 0
200
400
600
800
1000
1200
1400
1600
1800
Time
Figure 5: The projection of the VISAR data set and its smoothed version
4
Evaluation/Results
There are several factors affecting the quality of the resulting regression. The error of VISAR data and the errors occurring during the data preprocessing affect the accuracy of the reconstructed surface the most. It is generally agreed that a VISAR system measures the velocity values with an absolute accuracy of 3-5%. This is an approximate error calculated from differences between repeated experiments. Although the number of repeated experiments was too small to allow a more robust statistical analysis, this level of uncertainty is in the range of values generally agreed on by VISAR experimenters [2, 3, 6]. This error together with the noise transfers into the regression result. In addition, since the ignition time (the start of the experiment) was different for different experiments, the data has to be time-aligned so as to make each time series start exactly from the moment of the detonation. This introduces another potential error into the regression. The accuracy of the reconstructed surface is also affected by the specific features of VISAR data. The length of each of the time series produced by the VISAR system during different experiments always differs. We have observed that the SVM performs better on the data combined from the time series of the same length than from those of different length. Hence, the length of the data was aligned. In addition, each data point of three elements (velocity, time, and thickness) has order 103 , 10−6 , and 1. This is why it is important to scale the data to improve the performance of the SVM. Unfortunately, the application of SVR directly to the set of smoothed and 8
aligned data yields overfitted results, because the data step in the time direction is much smaller than the step in the other directions, and hence for any chosen data range there are more data points along the time axis than along the thickness axis. The overfitting problem is solved by scaling the data in such a way that the distance between two neighbor points along any axis is equal to 1. Using nonlinear kernels achieves better performance, when the dynamics of an experiment are non-linear. It is known that Gaussian Radial Basis Function (RBF) kernels perform well under general smoothness assumption [13], hence a Gaussian RBF 2 k(x, y) = e−γkx−yk has been chosen as a kernel for the reconstruction. Additionally, it has been experimentally determined that SVM techniques with simpler kernels, such as polynomial, take longer time to train and return non-satisfactory results. The performance of the SVR with RBF kernel is directly affected by three parameters, the radius γ of RBF, the upper bound C on the Lagrangian multipliers (also called a regularization constant or a capacity factor), and the size ε of the ε-tube (also called an error-insensitive zone or an ε-margin). Note that ε determines the accuracy of the regression, namely the amount by which a point from a training set is allowed to diverge from the regression. k-fold crossvalidation is performed in order to determine the optimal parameters’ values under which SVR produces the best approximation of the surface. An l2 error is computed for each parameter instantiation after finishing the cross-validation. Figure 6 demonstrates how the error changes depending on the values of the SVR 0.18 Error change for C=0.25 Error change for C=0.5 Error change for C=0.75 Error change for C=1.0 Error change for C=1.25
0.16
ε=0.01
Total error estimation
0.14 ε=0.005 0.12
ε=0.001
0.1
0.08
0.06
0.04
0.02 0.1
0.15
0.2
0.25
0.3
Radial Basis Function radius ( γ )
0.35
0.4
Figure 6: Error changes depending on different model parameters parameters. 9
It can be seen in figure 6 that the error increases as the radius γ goes up. The error also increases when ε becomes bigger. One can also see that the change of C affects the error the most when γ is the smallest, and the influence of C on the error decreases as γ goes up, becoming insignificant when γ exceeds 0.3. In the same time, given a small γ, parameter C affects the error more as the ε decreases. The error analysis suggests that when the tuple hγ, C, εi is around h0.1, 0.75 − 1.0, 0.001i, the error is the smallest. This error analysis produces a range of suboptimal values for the parameters. The expert knowledge is used in order to identify the final model that returns the most accurate velocity surface, shown in figure 7. 1.8 Experimentally produced data Predicted data 1.7
1.6
Velocity (m/s)
1.5
1.4
1.3
1.2
1.1
1
0.9 0
200
400
600
800
1000
1200
1400
1600
1800
Time steps (1 step = 2 ns)
Figure 7: SVM prediction results: dotted lines represent the prediction of the time series for the thicknesses between those that are produced experimentally (the solid lines). Once the surface is found, it is possible to obtain a velocity value for any htime, thicknessi pair. Assuming the surface is accurate enough, the failed VISAR data that deviates considerably from the surface can be identified. The surface provides significantly more information about velocity changes across the thickness dimension than VISAR readings alone. It can also provide velocity time series for an experiment, in which only PRAD data were measured successfully, improving the quality of the analysis for this experiment, and, consequently, increasing the understanding of the whole physical system. It should be noted that in this paper we used an implementation of the SVM technique called SVM-light. For more information about its implementation details see [9].
10
5
Related Work
Even though one can encounter many different applications of SVM in various fields, most of them are used for classification. Support vector classification methods are successfully used in fields such as image analysis and pattern recognition, speech recognition, bioinformatics, e-learning, and others. Compared to the classification case, support vector regression as a variation of the SVM technique has not been used in many problems outside AI. Hence, it is not a surprise that SVM methods were never before applied to VISAR data, nor in a broader sence, to experimental physics environments. Vannerem et al. in [14] attempted to test SVM in this environment by using support vector classifiers in the analysis of simulated high energy physics data. In [4] Cai et al. presents another example of SVM application in the analysis of physics data. In that paper the support vector machine is used to classify sonar signals. As noted above, SVM for regression (as opposed to SVM classification) is rarely applied in physics. There are, however, several successful examples of the support vector regression application. In [5] Dibike et al. introduced the regression type of the SVM technique to the civil engineering community and showed that SVM can be successfully applied to the problem of stream flow data estimation based on records of rainfall and other climatic data. By using three types of kernels, Polynomial, RBF, and Neural Network, and choosing the best values for SVM free parameters via trial and error, the authors point out that the SVM with the RBF kernel performs the best. Finally, this research is the first attempt to apply support vector regression in data analysis of VISAR measurements obtained from experiments on shock melted and damaged metal.
6
Conclusions and Future Work
In this paper we described the problem of VISAR data analysis in which we attempted to estimate the data between the points measured by VISAR. The Support Vector Regression method was used to reconstruct a 2-dimensional velocity surface in T ime×T hickness×V elocity data space resulting in a successful estimation. The SVR free parameters were obtained from a grid search as well as using the expert knowledge. The velocity surface provides considerably more information about the velocity behavior as a function of time and thickness than experimentally produced VISAR measurements alone. This may significantly improve the scientific value of VISAR data into other areas of analysis of shock physics experiments, such as PRAD imagery analysis and hydrocode simulations. On the other hand, support vector regression does not require a vast amount of data for producing good velocity estimations. This is very helpful because of the high cost and complexity of experiments, and limited amount of available data. In addition, the estimated velocity surface can help to identify experimentsoutliers: those experiments that for some reason went wrong. The data obtained
11
from these experiments will be significantly different than those suggested by the velocity surface. There are several directions in which this work might advance. One of these is to investigate the possibility of using a custom kernel instead of a standard Gaussian. Intuitively, an elliptical kernel that accounts for high density of the data in one direction and sparsity in all other directions may improve the results of support vector regression. During regression performed by the support vector machine method, we need to identify optimal values for SVM free parameters. In this paper a grid search and the expert knowledge are used (see section 4), essentially leading to suboptimal parameter values. Investigation of deriving an online learning algorithm for SVM parameter fitting specific to the VISAR data might be another direction of further research. In addition, note that an SVM system used for regression outputs a point estimate. However, most of the time we wish to capture uncertainty in the prediction, hence estimating the conditional distribution of the target values given feature values is more attractive. There is a number of different extensions to the SVM technique and hybrids of SVM with Bayesian methods, such as relevance vector machines and Bayesian SVM, that use probabilistic approaches. Exploring these methods could give significantly more information about the underlying data.
7
Acknowledgements
The authors are thankful to Joysree Aubrey for the numerous long and thoughtprovoking discussions. Special thanks to Brendt Wohlberg for providing ideas about SVM applications. This work was supported by the Department of Energy under the ADAPT program.
References [1] M. Aizerman, E. Braverman, and L. Rozonoer, “Theoretical foundations of the potential function method in pattern recognition learning,” Automation and Remote Control, Vol. 25, pp.821–837, 1964. [2] L.M. Barker and R.E. Hollenback, “Laser Interferometer for Measuring High Velocities of any Reflecting Surface,” Journal of Applied Physics, Vol. 43, pp.4669–4675, 1972. [3] L.M. Barker and K.W. Schuler, “Correction to the Velocity-per-Fringe Relationship for the VISAR Interferometer,” Journal of Applied Physics, Vol. 45, pp.3692–3693, 1974. [4] C.-Z. Cai, W.-L. Wang, and Y.-Z. Chen, “Support Vector Machine classification of physical and biological datasets,” International Journal of Modern Physics C, Vol. 14, No. 5, pp.575–585, 2003. 12
[5] Y.B. Dibike, S. Velickov, D. Solomatine, and M.B. Abbott, “Model induction with Support Vector Machines: introduction and applications,” Journal of Computing in Civil Engineering, Vol. 15, No. 3, pp.208–216, July 2001. [6] W.F. Hemsing, “Velocity Sensing Interferometer (VISAR) Modification,” Rev. Sci. Instrum., Vol. 50, pp.73–78, 1979. [7] D.B. Holtkamp and et al., “A Survey of High Explosive-Induced Damage and Spall in Selected Materials Using Proton Radiography,” In Shock Compression of Condensed Matter, ed. M.D. Furnish and et al., AIP Conference Proceedings 706, pp.477–482, 2003. [8] W.M. Isbell, “Shock Waves: Measuring the Dynamic Response of Materials,” Imperial College Press, London, 2005 [9] T. Joachims, “Making large-Scale SVM Learning Practical,” In Advances in Kernel Methods - Support Vector Learning, ed. B. Sch¨ olkopf and et al., MIT Press, 1999. [10] H.E. Makaruk, N.A. Sakhanenko, and D. Holtkamp, “Analysis of Proton Radiography Images of Shock Melted/Damaged Tin,” Tech. Report LAUR-06-107, Los Alamos National Laboratory, 2006. [11] B. Sch¨ olkopf and A. Smola, “Learning with Kernels. Support Vector Machines, Regularization, Optimization, and Beyond,” MIT Press, 2001. [12] J. Shawe-Taylor and N. Cristianini, “Kernel Methods for Pattern Analysis,” Cambridge University Press, 2004. [13] A. Smola, B. Sch¨ olkopf, and K.-R. M¨ uller, “The connection between regularization operators and support vector kernels,” In Neural Networks, 11: 637-649, 1998. [14] P. Vannerem, K.-R. M¨ uller, B. Sch¨ olkopf, A. Smola, S. S¨ oldner-Rembold, “Classifying LEP data with Support Vector algorithms,” To be published in the proceedings of 6th International Workshop on New Computing Techniques in Physics Research (AIHENP 99), Apr 1999. [15] V. Vapnik, “Estimation of dependences based on empirical data,” Nauka, Moscow, 1979 (Springer Verlag, New York, 1982). [16] V. Vapnik, “The Nature of Statistical Learning Theory,” Springer, 1999. [17] Ya.B. Zel’dovich, “Physics of Shock Waves and High-Temperature Hydrodynamic Phenomena,” Mineola, NY: Dover Publications, 2002
13