Journal of Physics: Conference Series
PAPER • OPEN ACCESS
Support Vector Regression Algorithm Modeling to Predict the Availability of Foodstuff in Indonesia to Face the Demographic Bonus To cite this article: Sari Devia Agustina et al 2018 J. Phys.: Conf. Ser. 1028 012240
View the article online for updates and enhancements.
This content was downloaded from IP address 181.214.176.68 on 14/06/2018 at 13:23
2nd International Conference on Statistics, Mathematics, Teaching, and Research IOP Publishing IOP Conf. Series: Journal of Physics: Conf. Series 1028 (2018) 1234567890 ‘’“” 012240 doi:10.1088/1742-6596/1028/1/012240
Support Vector Regression Algorithm Modeling to Predict the Availability of Foodstuff in Indonesia to Face the Demographic Bonus Sari Devia Agustina1,4*, Mustakim2,4, Okfalisa3, Celsa Bella1,4, Muhammad Anang Ramadhan1,5 1
Departemen of Information System, UIN Sultan Syarif Kasim Riau, Pekanbaru 28293, Indonesia 2 Laboratory of Data Mining Departemen of Information System, UIN Sultan Syarif Kasim Riau, Pekanbaru 28293, Indonesia 3 Departemen of Informatic Engineering, UIN Sultan Syarif Kasim Riau, Pekanbaru 28293, Indonesia 4 Research Group of Puzzle Research Data Technology, Faculty of Science and Technology, UIN Sultan Syarif Kasim Riau, Pekanbaru 28293, Indonesia *
[email protected] Abstract. The demographic bonus becomes a valuable phenomenon for Indonesian. One of the positive effects of this phenomenon is the increase of productive age proclaimed which will be the future of Indonesian economy. The agricultural sector plays an important role of the overall national economy which is indicated by an increase from year to year. However, the level of nutritional adequacy declined by a few percent each year due to an increase in the number of people who are not balanced by increased demand for food. In this case the government is expected to determine the policy priorities related to Demographic Bonus issues by predicting the future. Computing and data mining technologies play an important role in prediction cases by drawing conclusions based on regression lines. The technique is called Support Vector Regression, which is able to handle some cases of statistical data. Three determinant attributes used in this research are (1) Harvest Area; (2) Number of Harvest Production; and (3) Food Productivity, become the main reference for 714 data from 1998-2015 in 34 Provinces in Indonesia containing 7 types of crops. Three distribution data experiments conducted using KFold Cross Validation have the highest accuracy on Fold-1 with correlation coefficient value (R) of 92% with the smallest error value at fold-1 with MSE value of 14%. Predicted results show a decline in the number of food production in almost every province in Indonesia. From the experimental results, it is known that the biggest contributor of food products is Java Island, especially in East Java. Almost every kind of palawija plant, East Java plays an important role in the production of food needed in Indonesia.
1. Introduction The demographic bonus becomes a valuable phenomenon for Indonesian nation. One of the positive effects of this phenomenon is the increasing of productive age which is proclaimed to become the stakeholder of Indonesia's economy. With a good preparation and the right investment, demographic Content from this work may be used under the terms of the Creative Commons Attribution 3.0 licence. Any further distribution of this work must maintain attribution to the author(s) and the title of the work, journal citation and DOI. Published under licence by IOP Publishing Ltd 1
2nd International Conference on Statistics, Mathematics, Teaching, and Research IOP Publishing IOP Conf. Series: Journal of Physics: Conf. Series 1028 (2018) 1234567890 ‘’“” 012240 doi:10.1088/1742-6596/1028/1/012240
bonuses can change the future of Indonesia to be more prosperous and advanced. Nevertheless, according to data from Indonesian Central Bureau of Statistics (BPS) in 2010, Indonesia's population growth rate is still showing worrying sign because it reaches 1.49% or about 4.5 million. The Association of Indonesian Internet Service Providers (APJII) estimates that by 2019 the number of people will increase [1]. High population growth will also increase people's need for food. Therefore, one of the factors that should be the focus of development towards demographic bonus Indonesia is in terms of food security which is part of the agricultural sector [2]. The agricultural sector plays an important role for the overall national economy which can be demonstrated by the large number of people or workers who live or work in agricultural sector or from national products derived from agricultural sector [3]. One of agriculture sectors which become the main priority in National Medium-Term Development Plan (RPJMN) 2015-2019 is Food Security which focuses on increasing food availability, stabilizing food distribution, accelerating food diversification, and supervising fresh food safety. On the other hand, the development of food security is implemented in an effort to increase economic growth and reduce poverty as a manifestation of social, cultural and economic development as part of overall development [4]. The availability of food and employment is a factor which determines the welfare of Indonesian people. Sufficient food availability is influenced by the increase of employment, but the fact is that the number of agricultural workers has decreased [5]. Indonesia currently has 90 million farmers or about 45% of the population feeding the entire population (about 230 million people). It can be seen that the most of staple food comes from cereals consisting of rice, corn and flour and the largest staple food of the people is rice [6]. When calculated from the level of nutritional adequacy, the level of food security in Indonesia during the period 2009-2013 has decreased. In 2013 the number of population in the category of foodsecurity amounted to 116 million people or 47.09% of the population [7]. With the increasing number of population every year which is not matched by the increase of food demand, and the decrease of food security in Indonesia is also accompanied by the decline of labor in agriculture sector. This is a serious problem which is to be the focus of government. Especially in the face of demographic bonus in the year 2020-2030, at that time the population of Indonesia will reach 305 million. This means that the number of people who need food will be more or in other words, the national food needs will increase. The fulfillment of these food needs is absolutely supported by the agricultural sector [8]. Increasing the number of residents must be balanced with adequate food availability. Therefore, a strategic plan to realize the sufficient food availability is by doing the planning. The government is expected to make policy priorities related to food availability to face demographic bonus by making decisions both in the current and future periods in the form of predictions. The development of computational technology has generated many models of computational intelligence which can be applied to settle various cases such as prediction. Various research has been done by applying the Support Vector Regression (SVR) method to solve prediction cases with good accuracy compared to other methods. SVR is a method that can overcome the overfitting, resulting in an excellent performance [9], giving conclusions about the advantages and accuracy results [10] and can be applied to various cases with continuous data [11]. Previous research using SVR conducted by Mustakim, Agus Buono and Irman Hermandi in 2015 shows the accuracy in predicting the productivity of oil palm in Riau Province [12] [22]. The main objective of this research is to apply SVR to predict the amount of Indonesian food security to face the demographic bonus for the future. With some predictor parameters as well as using data of 10 years of food security. 2. Method and Materials The research data is obtained from the official website of Central Bureau of Statistics (BPS) www.bps.go.id [5]. Based on the data of food security in all provinces of Indonesia from 1998-2015 with 714 records. Food security itself is a condition of the food fulfillment for the household which is reflected from the availability of adequate food, both quantity and quality, safe, equitable and
2
2nd International Conference on Statistics, Mathematics, Teaching, and Research IOP Publishing IOP Conf. Series: Journal of Physics: Conf. Series 1028 (2018) 1234567890 ‘’“” 012240 doi:10.1088/1742-6596/1028/1/012240
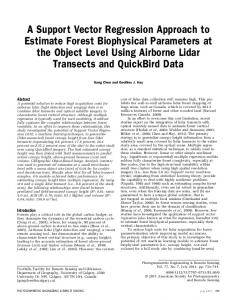
affordable (physical or economic). The types of food crops are (1) Rice, (2) Corn, (3) Cassava, (4) Sweet Potato, (5) Peanuts, (6) Green Beans and (7) Soybean. These types of food data includes of Harvested Area data, Total Production and Productivity on each type of food crop which is also part of the attribute. The data processing stage is divided into three stages: normalization for each target variable, dividing the training data and testing data from the whole data and the last stage is predictiing the pattern using SVR method. After normalization, the next step is to divide the data into two parts: training data set and testing data set. From the experiments conducted, the optimum result is obtained as training data and data testing that will be used to predict the food security using RBF carnel. Some steps in the prediction experiments using SVR in this case are shown in Figure 1. Identify Variables
Data Collection
Data
Data Distribution Data Training
Data Testing
Input Parameter
Loss Function (Kuadratik)
Upperbound (C dan ϒ)
Parameter Sensitivity (ε)
Kernel Function ( RBF )
Optimation (Grid search)
Testing
SVR Experiment
Result
Analysis and Evaluation (MSE and R)
Figure 1. Research Methodology 2.1. Demography Bonus The demographic bonus is the future in which the burden of dependence rate between the productive age population and the unproductive age population has decreased to a level below 50. In other words every working age population bears a little of the unproductive age population. To get the demographic bonus, the quality of human resources must be maximally enhanced through education, health services and the provision of employment. Population projection data shows that Demographic Bonus in Indonesia is estimated to occur in the period of 2020 to 2030 [13]. 2.2. Food Security The availability of adequate and distribution of food evenly is one of the pillars of the realization of sustained and sustainable food security (UU No. 7 of 1996 on food, and explanation of PP No. 68 of 2002). The objective of development in the field of food is to strengthen the food security whch is
3
2nd International Conference on Statistics, Mathematics, Teaching, and Research IOP Publishing IOP Conf. Series: Journal of Physics: Conf. Series 1028 (2018) 1234567890 ‘’“” 012240 doi:10.1088/1742-6596/1028/1/012240
characterized by the increase of food availability and increasing diversification of food consumption. In the session of FAO Food Security Committee in 1991 and the Law of Republic Indonesia Number 71 1996 on food, explained that the food securty is a condition of food fulfillment for the household which is reflected from the availability of adequate food, both quantity and quality, safe, equitable and affordable (physical or economic) [14]. 2.3. Support Vector Regression (SVR) SVR is an application of Support Vector Machine (SVM) for regression cases. SVR is a method which can overcome the overfitting, so it will produce a good performance [15]. Smola and Scholkopf (2003) described the SVR by assuming a condition whch has a set of λ training data, (xj, yj) with j = 1,2, ... λ with input x = {x1, x2, x3} ⊆ RN and the corresponding output y = {yi, ....., yλ} ⊆ RN. With SVR, we will find a function of f(x) having the largest deviation ε of the actual target for all training data. Then by using SVR, when the value of 𝜀 is equal to 0, perfect regression will be obtained. Based on the data, the SVR wants to find a function of f(x) that can approximate the output to an actual target, with a εtolerance error, and minimal complexity. The regression function of f(x) can be expressed by the following formula [15]: f x =wT φ x +b (1) Where φ(x) denotes a point in the higher-dimensional feature space, the mapping results of input vector x in input space which has lower dimension. The coefficients of w and b are estimated by minimizing the risk function defined in the equation: 1 1 min w 2 +C τi-1 Lϵ (yi ,f xi ) (2) 2
τ
Which fulfill: yi -wφ xi -b≤ε wφ xi -yi +b≤ε,i=1,2,…,τ
(3)
Where, Ls yi ,f xi
=
yi -f xi -ε yi -f xi ≥0 0,for others
(4)
2.4. Min-Max Normalization Data normalization is part of data transformation, which is the technique to convert data into a more easily understood [16]. The goal of data normalization is to obtain the same weight from all attributes of data and doesn't vary or the result of weighting has no dominant attribute or considered more important than the others [17]. 2.5. K-Fold Cross Falidation K-fold cross validation is performed to divide the data into training set and testing set [18]. The point of this type of validation is to divide the data randomly into desired subset of k. K-fold cross validation repeats k-times to split a set randomly into the most free set of section [19]. 2.6. Grid Search The Grid search method is one of the simplest methods to overcome the optimization problem [20]. This method involves of composing a suitable grid in a dimensional space, evaluating the objective function of the entire grid point, and finding the grid point corresponding to the objective function which has the optimum value [21].
4
2nd International Conference on Statistics, Mathematics, Teaching, and Research IOP Publishing IOP Conf. Series: Journal of Physics: Conf. Series 1028 (2018) 1234567890 ‘’“” 012240 doi:10.1088/1742-6596/1028/1/012240
3. Result and Discussions SVR requires parameters which match the kernel in training. To get the optimal kernel, optimization using grid search is done in training stage. There are 2 parameters which are optimized by grid search, they are parameter C and parameter γ. Parameter C is penalty value against SVR model error, while parameter γ is parameter used as input for kernel functions to be used. The best RBF kernel simulation results in SVM are shown in Table I below. Table 1. RBF kernel simulation in Fold 1 0.5
1
2
4
1
2
4
8
MSE
0.0020
0.0023
0.0034
0.0039
ϒ
C
0.5
1
0.25
2
0.125
4
0.0625
8
R
0.9251
0.8994
0.6512
0.501
MSE
0.0017
0.0020
0.0026
0.0022
R
0.9261
0.9210
0.8499
0.8716
MSE
0.0014
0.0015
0.0015
0.0016
R
0.7887
0.7861
0.7674
0.7532
MSE
0.0026
0.0026
0.0026
0.0024
R
0.5348
0.5329
0.5258
0.5783
From each experiment, two best simulations were obtained through the largest corelation coefficient (R) and the smallest Mean Squared Error (MSE) error, using the formula; 1
MSE= m
and
𝑅=
2 m (𝑦 -y ) i-1 i i
(5)
𝑥−𝑥 (𝑦−𝑦) (𝑥−𝑥 )2
(6)
(𝑦−𝑦 )2
The simulation results will be divided into two experiments, among them (1) Experiment 1, is the predicted result with the best simulation result through the smallest MSE value. (2) Experiment 2, is the result of prediction with the best simulation result through the biggest R value: Table 2. Result of modeling on Fold 1 ALT
ACTUAL
EXPERIMENT 1
EXPERIMENT 2
P-1
0.00314
-0.00032
-0.00015
P-2
0.02098
-0.00033
-0.00004
P-3
0.00435
-0.00042
-0.00029
P-4
0.00169
-0.00008
-0.00001
P-5
0.00097
0.00000
0.00003
P-6
0.00307
-0.00016
-0.00007
P-7
0.00245
-0.00014
-0.00005
P-8
0.03343
0.00164
0.00105
P-9
0.00398
0.00006
0.00006
P-10
0.0093
0.00006
0.00006
…
…
…
…
P-714
0.00001
0.00006
0.00006
Table 2 describes the result obtained from SVR modeling using fold-1. From the modeling we get the result of RBF kernel with MSE of 0.0014 R value of 0.7887 in experiment 1 and MSE 0.0017 R
5
2nd International Conference on Statistics, Mathematics, Teaching, and Research IOP Publishing IOP Conf. Series: Journal of Physics: Conf. Series 1028 (2018) 1234567890 ‘’“” 012240 doi:10.1088/1742-6596/1028/1/012240
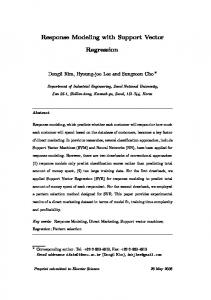
value of 0.9261 in experiment 2. The predicted result graph of fold-1 in each experiment can be seen in Figures 2 and 3. RESULT OF EXPERIMENT 1 SIMULATION 1,20 Food Production
1,00 0,80 0,60 0,40 0,20 P-1 P-18 P-35 P-52 P-69 P-86 P-103 P-120 P-137 P-154 P-171 P-188 P-205 P-222 P-239 P-256 P-273 P-290 P-307 P-324 P-341 P-358 P-375 P-392 P-409 P-426 P-443 P-460 P-477 P-494 P-511 P-528 P-545 P-562 P-579 P-596 P-613 P-630 P-647 P-664 P-681 P-698
0,00 -0,20
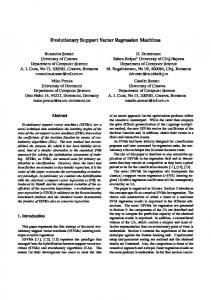
Figure 2. Predicted graph of first modeling results RESULT OF EXPERIMENT 2 SIMULATION 1,20000 Food Production
1,00000 0,80000 0,60000 0,40000 0,20000 P-1 P-18 P-35 P-52 P-69 P-86 P-103 P-120 P-137 P-154 P-171 P-188 P-205 P-222 P-239 P-256 P-273 P-290 P-307 P-324 P-341 P-358 P-375 P-392 P-409 P-426 P-443 P-460 P-477 P-494 P-511 P-528 P-545 P-562 P-579 P-596 P-613 P-630 P-647 P-664 P-681 P-698
0,00000 -0,20000
Figure 3. Predicted graph of second modeling results From figure 2 and 3 above can be known what is related to predict the next production, it obtained the best model on SVR kernel that the RBF with corelation coefficient (R) equal to 0,9261 and mean squared error (MSE) equal to 0,0014 is found in fold 1. Predicted results by comparing actual (prepredicted) with predictions on each food requirement were obtained by focusing on three provinces contributed to the highest production of foodstuffs that can be seen in Table 3. Table 3. Food demand predictions based on the largest contributors on production No
Food
1
Rice
2
Corn
3
Green beans
4
Peanuts
Province with the Most Contribution of Production West Java Central Java East Java East Java Central Java South Sulawesi Central Java East Java South Selatan East Java
The prediction results are based on the coefficient of R and MSE MSE R Actual Prediction Result Actual Prediction Result 0.98209 0.38951 Decrease 0.98209 0.40198 Decrease 0.8612 0.38951 Decrease 0.8612 0.40118 Decrease 0.95734 0.38951 Decrease 0.95734 0.40198 Decrease 0.43478 0.38916 Decrease 0.43478 0.31396 Decrease 0.21595 0.31417 Increase 0.21595 0.10455 Decrease 0.09282 0.07976 Decrease 0.09282 0.02201 Decrease 0.00784 -0.00061 Decrease 0.00784 -0.00052 Decrease 0.0075 -0.0004 Decrease 0.0075 -0.00022 Decrease 0.00312 -0.00004 Decrease 0.00312 -0.00009 Decrease 0.01864 -0.00053 Decrease 0.01864 -0.00022 Decrease
6
2nd International Conference on Statistics, Mathematics, Teaching, and Research IOP Publishing IOP Conf. Series: Journal of Physics: Conf. Series 1028 (2018) 1234567890 ‘’“” 012240 doi:10.1088/1742-6596/1028/1/012240
No
Food
5
Soybeans
6
Sweet potato
7
Cassava
Province with the Most Contribution of Production Central Java DI Yogyakarta East Java Central Java West Nusa Tenggara West Java Papua East Java Lampung Central Java East Java
The prediction results are based on the coefficient of R and MSE MSE R Actual Prediction Result Actual Prediction Result 0.01483 -0.00093 Decrease 0.01483 -0.00029 Decrease 0.00574 -0.00036 Decrease 0.00574 -0.00021 Decrease 0.03283 0.00078 Decrease 0.03283 0.00024 Decrease 0.01472 -0.00125 Decrease 0.01472 -0.00037 Decrease 0.00813 -0.00034 Decrease 0.00813 -0.00021 Decrease 0.0388 0.00301 Decrease 0.0388 0.00138 Decrease 0.0302 0.00168 Decrease 0.0302 0.00066 Decrease 0.02 0.00000 Decrease 0.02 -0.00011 Decrease 0.54583 0.38951 Decrease 0.54583 0.39621 Decrease 0.33278 0.36837 Increase 0.33278 0.17196 Decrease 0.35021 0.36865 Increase 0.35021 0.16762 Decrease
From Table 3 above, it is known that the biggest contributor of food products is Java Island, especially in East Java. Almost every type of food which exists, East Java plays an important role in the production of food needed in Indonesia. Almost every province of the largest food supply contributor in Indonesia experience the decreased in production. This decrease can be caused by several factors, such as the number of workers [4]. Therefore, with the decrease of food prediction results every year, and to face demographic bonus in the next few years, it is hoped that the government will prioritize the increase of productive labor force in agriculture sector. This is due to the decline in the number of workers of productive age, in 2010 to 2014 there was a decline in labor by 1.49%. The largest decrease in labor growth was in the group of youth, between the ages of 15 to 29 with an average reduction of 3.41% per year [4]. So to face the future demographic bonus the government should divert the productive workforce into agricultural sector. Because it corresponds to the introduction at the beginning of this study, the pertinent sector holds an important role in political, economic, social and cultural stability. 4. Conclusion From the results of analysis and exposure in this study, obtained some conclusions which are the best model obtained for prediction results using RBF carnel on SVR found on the fold-1 with the corelation coefficient (R) by 0,9261 are mean squared error of 0,0014. East Java, belong to the province that plays an important role in the production of food needed in Indonesia because almost every type of food, East Java is included in the provinces which produce the largest amount of food production. Overall predictions indicate a decrease in the amount of production in almost every province in Indonesia, even the provinces which contribute as the largest contributor of production in Indonesia also experienced a decrease in production followed by a decrease in harvested area. Acknowledgments A biggest thanks to Faculty of Science and Technology UIN Sultan Syarif Kasim Riau on the financial support for this research, the facilities and mental support from the leaders. And also thanks to Puzzle Reseach Data Technology (Predatech) Team Faculty of Science and Technology UIN Sultan Syarif Kasim Riau for their feedbacks, corrections and their assistance in implementing these activities so that research can be done well. References [1] Association of Indonesian Internet Service Providers 2017 Internet Survey APJII 2016 [Online] Available https://apjii.or.id/content/read/39/264/Survei-Internet-APJII- 2016, accessed July 5, 2017 In Indonesian.
7
2nd International Conference on Statistics, Mathematics, Teaching, and Research IOP Publishing IOP Conf. Series: Journal of Physics: Conf. Series 1028 (2018) 1234567890 ‘’“” 012240 doi:10.1088/1742-6596/1028/1/012240
[2] [3] [4] [5] [6] [7] [8] [9] [10] [11] [12] [13] [14] [15] [16] [17] [18] [19] [20] [21] [22]
Wibisono and Kunto 2016 Demographic Bonus as an Opportunity to Create Rice SelfSufficiency Through Tidal Land 09 June 2016 [Online] Available http://indonesiana.tempo.co, accessed July 10, 2017 In Indonesian Tunjung 2010 Efficiency Analysis of Soybean Raw Material Supply Management at Kecap Company Pt Lombok Gandaria Food Industry Palangkara Karanganyar [skripsi] (Faculty of Agriculture Sebelas Maret University of Surakarta) In Indonesian Ministry of Agriculture 2016 Annual Report of Food Security Agency 2015 Ministry of Agriculture In Indonesian Central Bureau of Statistics 2016 Population Census [Online] Available https://www.bps.go.id, accessed July 4, 2017 In Indonesian Prabowo R 2010 Government Policy in Achieving Food Resilience in Indonesia Journal of Agricultural Sciences 6(2) 62-73 Abidin M Z 2015 Impact of Rice Import Policy and Food Security in Social Welfare Perspective Sosio Informa 1(3) 213-230 Asmudddin 2016 Demographic Bonus: The Dilemma of Agriculture Sector 21 September 2016 [Online] Available http://kompasiana.com, accessed July 11, 2017 Piantari E 2011 Feature Selection Hiperspektral Data for Predicted Rice Productivity with Genetic Algorithm Support Vector Regression [Essay] Bogor (ID): Bogor Agricultural University Ibrahim N and Wibowo A 2014 Support Vector Regression with Missing Data Treatment Based Variables Selection for Water Level Prediction of Galas River in Kelantan Malaysia Wseas Transactions on Mathematics E-ISSN: 2224-2880 13(1) Paz J F 2010 A Support Vector Regression Approach to Predict Carbon Dioxide Exchange A P de Leon F de Carvalho (Eds.): Distrib. Computing & Artif. Intell AISC 79 157–164. Mustakim, Agus Buono, and Irman Hermadi 2015 Support Vector Regression for Predicted Palm Oil Productivity in Riau Province Journal of Science, Technology and Industry 12(2) 179 - 188 National Population and Family Planning Agency 2016 Demography bonus [Online] Available http://www.bkkbn.go.id, accessed July 10, 2017 In Indonesian Anwar S, Mukson and Rahmadi D 2017 Analysis of Potential and Food Availability in Relation with Food Security in Central Java Journal of Research and Development of Universitas Muhamrnadiyah Semarang 5-17 Smola A and Schölkopf B 2003 A Tutorial on Support Vector Regression Neuro COLT, Technical Report NC-TR-98-030 (Royal Holloway College, University of London, UK) Patel V R and Mehta R G 2011 Impact of Outlier Removal and Normalization Approach in Modified K-Means Clustering Algorithm IJCSI International Journal of Computer Science Issues 8(5) Jain Y K and Bhandare S K 2011 Min Max Normalization Based Data Perturbation Method for Privacy Protection International Journal of Computer & communication Technology 2(8) Agmalaro M A and Buono A 2011 Statistical Downscaling GCM Data Modeling Using Support Vector Regression to Predict Monthly Indramayu Rainfall [Thesis] (Bogor (ID): Bogor Agricultural University) Gunawan H 2012 Hyperspectral Band Selection Using Recursive Feature Elimination to Predict Rice Production with Support Vector Regression [Essay] (Bogor (ID): Bogor Agricultural University) Rao S S 2009 Engineering Optimization: Theory and Practice (John Wiley and Sons, Newyork) Hidayat R 2013 Prediction System of Nutritional Status of Toddlers by Using Support Vector Regression [Essay] (Bogor (ID): Bogor Agricultural University) Mustakim, Agus Buono, and Irman Hermadi 2016 Performance Comparison Between Support Vector Regression And Artificial Neural Network for Prediction of Oil Palm Production Jurnal Ilmu Komputer dan Informasi 9(1) 1 - 8
8