Keywords: sulphur and nitrogen oxide, AERMOD, air quality standards, South. Pars. .... primary source of SO2 is from the sulphur recovery units during normal.
First International Symposium on Urban Development: Koya as a Case Study
339
Application of the AERMOD modeling system for air pollution dispersion in the South Pars oilfield M. Rouhi1,2, H. Moradi1,2 &
M. Ghorbani 3
1
Department of Natural Resources, Isfahan University of Technology, Iran 2 Center for Natural Resources and Environment, Isfahan University of Technology, Iran 3 Faculty of Natural Resources, University of Tehran, Karaj, Iran
Abstract The research presented here represents a segment of a cumulative impact modeling of gas refineries in phases 9 and 10 of South Pars Gas Company (SPGC). It considers point and flare source emissions of sulphur and nitrogen oxides (SO2 and NOx respectively), over an area of about 410 km2. AERMOD ViewTM was used to estimate the maximum potential concentration of these pollutants over 1-h, 3-h, 8-h, 24-h, month and annual averaging periods. Results were compared with air quality standards to assess the potential cumulative effects of these pollutants. Finally, comparison with nearby monitoring data will indicate reasonability of predicted concentrations and usefulness of AERMOD as a tool for approaching the potential cumulative impacts of air pollution from multiple sources. The effects of predicted threshold violations on fragile ecosystems were discussed. The advantage of air pollution modeling is, moreover, when the industries are next to the cities. It makes it possible to know how much of the surface of the cities and how many people are affected by pollutant gases. Also, by overlaying the output maps, it can help us to find the cumulative impacts resulting from different pollution sources as well as synergetic impacts. Keywords: sulphur and nitrogen oxide, AERMOD, air quality standards, South Pars.
© 2013 WIT Press www.witpress.com doi:10.2495/ISUD130441
340 First International Symposium on Urban Development: Koya as a Case Study
1 Introduction The importance of air pollution prevention has been increasing in recent years, due to increasing knowledge of pollution sources and their pollution levels. National air quality standards have been established by the United States Clean Air Act to protect man and the environment from damage by air pollutants [5]. Chronic exposure to air pollutants is a worldwide problem. The World Health Organization (WHO) announced that every year approximately 2.7 million deaths can be attributed to air pollution [6]. Possible health effects from Gas and Petrochemical Complexes and related emissions have been a long-standing community concern, particularly when such industrial activities are located near together in a small area such as Assaluyeh. Dispersion is the process of air pollutants emitted from sources such as industrial plants and vehicular traffic dispersing in the ambient atmosphere [7]. An air quality dispersion model is a series of equations that mathematically describe the behavior of pollutants in the air. It provides a cause-effect link between the emissions into the air and the resulting air pollution concentrations. Dispersion models have been used in many different applications, but have traditionally been used for air quality assessments in support of decisions regarding approvals and permits for regulated sources [1]. A dispersion model is essentially a computational procedure for predicting concentrations downwind of a pollutant source, based on knowledge of the emissions characteristics (stack exit velocity, plume temperature, stack diameter, etc), terrain (surface roughness, local topography, nearby buildings) and state of the atmosphere (wind speed, stability, mixing height, etc). The model has to be able to predict rates of diffusion based on measurable meteorological variables such as wind speed, atmospheric turbulence, and thermodynamic effects. The algorithms at the core of air pollution models are based upon mathematical equations describing these various phenomena which, when combined with empirical (field) data, can be used to predict concentration distributions downwind of a source [4]. Currently used dispersion models, such as the AMS/EPA Regulatory Model (AERMOD), process routinely available meteorological observations to construct model inputs. Thus, model estimates of concentrations depend on the availability and quality of meteorological observations, as well as the specification of surface characteristics at the observing site [2]. AERMOD requires steady and horizontally homogeneous hourly surface and upper air meteorological observations [3]. As the AERMOD gives us maps compatible with ArcGIS software, it is possible to find how much urban areas are polluted by industries pollution as well as how many people are under exposure of air pollutant and under which concentration. The research presented here, represents a segment of a cumulative impact modeling of gas refineries (phases 9 and 10) of South Pars Gas and Petrochemical Complex. Many different industries and activities are going on in this complex where a huge amount of air pollutants are released to the atmosphere. The common gases will result in cumulative effects which will affect the natural and human environment severely. This study aims to: 1) model
© 2013 WIT Press www.witpress.com
First International Symposium on Urban Development: Koya as a Case Study
341
dispersion of NOx and SOx in phase 9 and 10 of SPGC; 2) compare the outputs with air quality standards to estimate the share of these sources in ambient air pollution; 3) do the comparison with nearby monitoring data will indicate reasonability of predicted concentrations and usefulness of AERMOD as a tool for approaching the potential cumulative impacts of air pollution from multiple sources; 4) overlay the outputs with a landuse map of the study area to realize which populations are affected and which concentrations they are exposed by; 5) overlay the outputs with ecosystems map of the study area to realize which ecosystems are affected and which concentrations they are exposed by. The effects of predicted threshold violations on fragile ecosystems will be discussed.
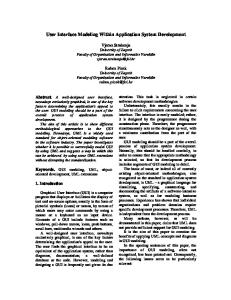
2 Methods 2.1 Study area In this study an area of 410 km2 of South Pars oilfield was chosen. South Pars oilfield was chosen because of (1) the high density of emission sources, (2) community concerns regarding poor air quality in this region, and (3) the proximity to Nayband gulf and national park as fragile ecosystems. The Iranian South Pars field is the largest discovered offshore gas field in the world, located 100 km offshore in the Persian Gulf. Reservoir fluids are transported to shore via two sea lines to the mainland (Assaluyeh) at a distance of approximately 105 km for further treatment. In this study SO2 and NOx sources in gas refineries phases 9 and 10 of SPGC was chosen for modeling (Fig. 1).
Figure 1: © 2013 WIT Press www.witpress.com
Location of gas refineries (phases 9 and 10) in SPGC.
342 First International Symposium on Urban Development: Koya as a Case Study 2.2 Dispersion modeling Lakes Environmental’s AERMOD View™ version 7.6.1 was used for modeling dispersion of SO2 and NOx. Sulfur dioxide (SO2) is the criteria pollutant that is the indicator of sulfur oxides concentrations in ambient air. SO2 dissolves in water vapor to form acid, and interacts with other gases and particles in the air to form sulfates and other products that can be harmful to human and their environment. The dispersion of pollutants released to the atmosphere is highly dependent on the meteorological conditions into which it is released. Meteorology was supplied by Lakes Environmental in SAMSON format for the Persian Gulf airport and Kangan-Jam station prior to processing with AERMET. The data for the years 2008 and 2009 was used for this purpose. AERMOD is a Gaussian plume model that uses a skewed bi-Gaussian probability density function under convective conditions when vertical plume dispersion is non-Gaussian. More information on AERMOD and AERMOD View™ 7.6.1 including algorithms and background science can be obtained from the US-EPA (http://www.epa.gov /scram001/dispersion_prefrec.htm) and from Lakes Environmental (http://www.weblakes.com). AERMAP is a terrain data preprocessor that incorporates complex terrain using USGS Digital Elevation Data (http://gdex.cr.usgs.gov/gdex/). In this study rural and elevated options were chosen for the uniform 40×40 Cartesian grid with 500m spacing and with a center reference point (UTM Zone 39 WGS 1984, North: 3042640 m and East: 661529 m). The emissions to air consider SO2 and NOX. As all the combustion units burn sweet fuel gas with less than 2 ppm of sulphur containing compounds, the primary source of SO2 is from the sulphur recovery units during normal operation. The major NOX emission sources include gas turbines and steam boilers during normal operation. Stacks and flares with emission rates over than 1g/s were chosen for modeling. Therefore 4 sources (2 stacks and 2 flares) were used for SO2 dispersion modeling and 12 sources (12 stacks) were used for NOX dispersion modeling. Stack and flare parameters assigned to point and flare sources used in AERMOD View are given in table 1.
3 Results 3.1 Predicted concentrations This study considers point and flare source emissions of sulphur and nitrogen oxides (SO2 and NOx respectively), over an about 410 km2 area. The time period from 11/1/2008 to 10/31/2009 was chosen for modeling. Model outputs were averaged over 1-h, 3-h, 8-h, 24-h, monthly and annual periods for both SO2 and NOx. Maximum predicted value concentrations for specified AERMOD averaging times occurred in mountains and elevated area near emission sources. These values are given in table 2, Fig. 2(a) and (b) and Fig. 3.
© 2013 WIT Press www.witpress.com
343
First International Symposium on Urban Development: Koya as a Case Study
Table 1:
Stack and flare parameters used in AERMOD View.
Sources
Stack
Flue Gas
Height m Temp. °K
Flue Gas
SO2 NOX
Velocity m/s
g/s
g/s
Steam boiler
43
458
12.24
-
7
Steam boiler
43
458
12.24
-
7
Steam boiler
43
458
12.24
-
7
Steam boiler
43
458
12.24
-
7
Steam boiler
43
458
12.24
-
7
Steam boiler
43
458
12.24
-
7
Compressor gas turbine
30
776
10.99
-
22.67
Compressor gas turbine
30
776
10.99
-
22.67
Compressor gas turbine
30
776
10.99
-
22.67
Compressor gas turbine
30
776
10.99
-
22.67
SRU tail gas incinerator
95
625
5.43
330.3
4.8
95
625
5.43
330.3
4.8
LP flare (normal)
25
317
1.5
1.36
-
LP flare (normal)
25
317
1.5
1.36
-
(SRU trip case) SRU tail gas incinerator (SRU trip case)
Table 2:
AERMOD View predicted maximum concentrations over various averaging times.
Concentrations are in μg/m3 Pollutant
1h
3h
8h
24 h
Month
Annual
SO2
16518.89
5544.78
2117.37
918.548
207.16
132.46
NOX
1896.619
839.917
368.813
197.805
81.7
68.322
© 2013 WIT Press www.witpress.com
344 First International Symposium on Urban Development: Koya as a Case Study
(a) Figure 2:
(b)
Maximum predicted value concentrations for specified AERMOD averaging times (Annual) for NOx (a) and SO2 (b).
Predicted maximum concentrations exceeded all the sulphur dioxide threshold limits (Tables 2 and 3). Predicted maximum NOx concentrations exceeded daily standards but they did not exceed annual standards (Tables 2 and 3). Table 3:
Project Air Quality Standards for South Pars [9]. Standards during normal operation
Pollutant
Sulphur Dioxide (SO2) Oxides of Nitrogen NOx (such as NO2)
Project Standards (µg/m³)
50
Iranian Petroleum Standards (1) (µg/m³) 80
125(3)
365(2)
24 hour average
40
100
Annual Mean
150
-
24 hour average
Averaging period
Annual Mean
Remarks: (1) Iranian Petroleum Standard IPS –E-SF-860. (2) Not to be exceeded more than once a year. (3) 98th percentile of all daily values taken throughout the year; should not be exceeded more than 7 days a year.
© 2013 WIT Press www.witpress.com
First International Symposium on Urban Development: Koya as a Case Study
345
4 Discussion There are 28 gas refinery plants in South Pars Gas Field. Although, we are sure that the general concentrations of studied gases are the commutation of all the emission sources in the studied area, but we modeled the concentration of the gases as a pilot study for two gas plants. Background concentrations of SO2 and NOx were taken for this purpose. Based on the previous studies, background concentration values used for SO2 and NOx were 22 and 55 ppb respectively. However, the purpose of this study was to apply AERMOD software as a tool for approaching the potential cumulative impacts of air pollution from multiple sources in gas refineries, phases 9 and 10 of South Pars Gas Company. The results indicate that we have the most dispersion of both gases in the Northwest of the studied area on the mountains (as shown in Fig. 3). So, we conclude that it might be as the effect of the wind direction which is coming from the southeast. Also elevated area can cause plume impaction and increasing ground level concentration. In short average times (1-h, 3-h, 8-h and 24-h) maximum predicted concentrations were exceeded the standards by both SO2 and NOx. It was represent the potential short term impacts of these pollutants on human health and fragile ecosystems. The maximum predicted concentration in annual average time of SO2 was exceeded standards and it can be concluded the potential long term impacts of SO2 maximum concentrations. But maximum predicted concentration in annual average time of NOx did not exceed the standards, it can be concluded that maximum NOx concentrations in long periods of time cannot have considerable potential impacts. It should be noted that our discussion was based on maximum concentrations that occurs in limited area. As shown in figure 2, in most areas, simulated concentrations are under standard values. Generally the main objective of this kind of study is to determine high risk areas (hot spots) for further study. Figures 2 and 3 show areas that should pay special attention.
(a) Figure 3:
(b)
Maximum concentration contours for specified AERMOD averaging times (Annual) for NOx (a) and SO2 (b) overlaid on Google Earth.
© 2013 WIT Press www.witpress.com
346 First International Symposium on Urban Development: Koya as a Case Study
5 Conclusions The isolation of facilities and events for current atmospheric release permits (and traditional environmental impacts assessments) ignores the potential cumulative impacts of multiple emission sources (or activities) in shared space and time. While individual plants and small emission sources may appear benign, when considered cumulatively, even over a relatively small study area, their plumes have the potential to intersect and exceedance of ambient air concentration standards for SO2 and NOx are likely to occur. Episodically high concentrations occur under conditions of a stable boundary layer with light winds and little convective or turbulent mixing. As the map show, a big part of urban places such as Assaluyeh are under exposure of high concentration of both NOx and SO2. If the study could go further and deeper we could find how many of personnel, workers, and local people are under high concentration of air pollution.
References [1] British Columbia: http://www.env.gov.bc.ca/epd/bcairquality/assessment /dispersion-modelling.html [2] Isakov, Vlad, et al., “Evaluating the use of outputs from comprehensive meteorological models in air quality modeling applications”, Atmospheric Environment, 41, pp. 1689–1705, 2007 [3] Kesarkar, Amit P., M. Dalvi, A. Kaginalkar, A. Ojha, “Coupling of the Weather Research and Forecasting Model with AERMOD for pollutant dispersion modeling. A case study for PM10 dispersion over Pune, India”, Atmospheric Environment, 41, pp. 1976–1988, 2007 [4] Macdonald, Robert, “Theory and Objectives of Air Dispersion Modeling”, Modeling Air Emissions for Compliance, MME 474A Wind Engineering, 2003 [5] Maynard, E. S., “Review of the attributes and performance of 10 rural diffusion models”, American Meteorological Society, 65(6), pp. 554–558, 1984 [6] Seangkiatiyuth, K., V. Surapipith, K. Tantrakarnapa, A. W. Lothongkum, “Application of the AERMOD modeling system for environmental impact assessment of NO 2 emissions from a cement complex”, Journal of Environmental Sciences, 23(6), pp. 931–940, 2011 [7] National Iranian Oil Company, Air Dispersion Modeling Report of NIOC, 2008. [8] Perry, S. G., Paine, R. F., Cimorelli, A. J., Venkatram, A., Lee, R. J., Weil, J. C. (1994). AERMOD: A dispersion model for industrial source applications. Air and Water Management Association. 94-TA23.04, For Presentation at the 87th Annual Meeting and Exhibition, Cincinnati, Ohio. June 19–24, 1994.
© 2013 WIT Press www.witpress.com