Proceedings of the International Conference on Man-Machine Systems (ICoMMS) 11 – 13 October 2009, Batu Ferringhi, Penang, MALAYSIA
Application of Thresholding Technique in Determining Ratio of Blood Cells for Leukemia Detection Abdul Nasir, A. S.1, Mustafa, N.2, Mohd Nasir, N. F.3 1,2,3
School of Mechatronic Engineering, Universiti Malaysia Perlis, 02600 Jejawi, Arau, Perlis, MALAYSIA E-mail:
[email protected]
Abstract- Fast and cost-effective production of blood cell count reports are of paramount importance in the healthcare industry. The traditional method of manual counting under a microscope yields inaccurate results and put an intolerable amount of stress to medical laboratory technicians. Due to high vulnerability in human error and large time consumption, better and more effective image processing software is needed. As a solution to this problem, this paper proposed an image processing technique for counting the number of blood cells. The number of counted blood cells will then be used to calculate the ratio of blood cells for leukemia detection. For this purpose, few pre-processing and post-processing techniques have been implemented on blood cells image in order to provide a much clearer and cleaner image for blood cells ratio calculation. The results show that the ratio of blood cells which have been calculated using the proposed image processing techniques are able to differentiate between normal and abnormal blood cell image for leukemia detection. Keywords- Leukemia, image processing, thresholding technique, blood cells image, blood cells ratio calculation.
I. INTRODUCTION Medical imaging refers to the techniques and processes used to create images of the human body for clinical purposes such as medical procedures for diagnosing or examining disease and also for medical science which include the study of normal anatomy and physiology [1]. The importance of medical analysis and visualization can be recognized from the recent works in the medical imaging technologies like segmentation of kidney from ultrasound images, segmentation of brain images [2], locating of tumors and other pathologies [3]. Nowadays, there is a rapid detection of leukemia cells by using a complement-mediated cytolytic reaction and an imaging sensor system [4]. Leukemia is a disease that affects blood forming cells in the body. Its cancerous condition is characterized by an abundance of abnormal white blood cells in the body. Based on the research by M. D. Anderson Cancer Center, leukemia begins in the bone marrow and spreads to the other parts of the body [5]. In a healthy body, bone marrow makes white blood cells to help the body fight an infection. When a person has leukemia, the bone marrow starts to build a lot of abnormal
white blood cells called leukemia cells. They grow faster than normal cells and they do not stop growing when they should. The four main types of leukemia are Acute Lymphoblastic Leukemia (ALL), Acute Myelogenous Leukemia (AML), Chronic Lymphocytic Leukemia (CLL) and Chronic Myelogenous Leukemia (CML) [4]. According to Hany Ariffin, there are several types of leukemia, but the most commonly detected from the patients are Acute Lymphoblastic Leukemia (ALL) which involves 70% of the leukemia cases each year [6]. In 2009, it is estimated that approximately 31,490 individuals will be diagnosed with leukemia and 44,510 individuals will die of the disease in the United States [7]. In Malaysia, a total of 21,773 cancer cases were diagnosed among Malaysians in Peninsular Malaysia in 2006 and registered in the National Cancer Registry. Out of this value, 3.6% of male and 1.9% of female were diagnosed with leukemia [8]. Based on the high number of leukemia cases, the requirement for fast and cost-effective production of blood cell count reports is of paramount importance in the healthcare industry. Conventionally, manual counting under the microscope is one of the methods being used for blood cell counting. However, if the counting process is interrupted, it has to be started all over again from the beginning. Although machine such as the Automated Haematology Counter has been developed to automate the counting process, certain developing countries are not able to deploy such an expensive machine in every hospital laboratory in the country [9]. This paper proposes an alternative solution to this problem through cost-effective and efficient application in recognizing and analyzing blood cells. This study involves the application of thresholding technique in determining ratio of blood cells for leukemia detection. The most important step in blood cell image processing is the cytological image segmentation and automatic counting. There are several general-purpose algorithms and techniques that have been developed for blood cells image segmentation [3]. By combining mathematical theories and computer vision, a much greater progress has been achieved in image segmentation. However, some algorithms for segmentation have their own drawbacks [10].
2A2-1
Proceedings of the International Conference on Man-Machine Systems (ICoMMS) 11 – 13 October 2009, Batu Ferringhi, Penang, MALAYSIA
As for the blood cell images, due to the cells’ complex nature and overlapping between them, it is still a challenging task to segment and count them [4]. These are two critical issues in image segmentation where the common segmentation algorithms are not able to solve the problem. Due to the blood cells’ complex texture and unevenness of the gray level intensity, it is quite difficult to count and segment cell from its background automatically [4]. However, this can be done by thresholding technique. In this study, a new method of segmentation and ratio calculation of blood cells image is proposed.
original blood cell image will firstly be converted into grayscale image. Then, based on the grayscale image, the threshold values for the WBC and RBC will be determined manually. These threshold values will be used to segment area of WBC and RBC by using the thresholding values. The image obtained from the segmentation process will be converted into binary image. If the result of these preprocessing techniques is satisfied, the binary image will be implemented with image enhancement techniques to produce cleaner and clearer image to ease blood cells ratio calculation.
II. METHODOLOGY
Start
The main objective of this study is to design and develop an image processing system for blood cell counting. Normally, the number of white blood cell in patients with positive cases of leukemia will increase. The increasing number of white blood cell will increase the ratio of white blood cell (WBC) to red blood cell (RBC). Thus, it is important to have a costeffective image processing system which will assist haematologists to determine the ratio of white blood cells to red blood cells for leukemia detection. The methodology used to develop the image processing system is described in the following sections.
Original blood cell image
Convert to grayscale image
Develop a histogram to obtain threshold value, T
A. Image Acquisition A total of 91 data (each data/image consists of blood cells) were collected from the Hospital Universiti Sains Malaysia (HUSM). The images of blood cell have been captured using computerised microscope. The captured images were revised by the haematologist to determine the appropriateness and type of the blood cell. The image analysis includes 14 images of Acute Lmphoblastic Leukemia (ALL), 43 images of Acute Melogenous Leukemia (AML) and 34 images of normal blood cells. B. Development of Image Processing System for Ratio Calculation Matlab 7.0 software has been used in this study to develop a system for blood cell ratio calculation. The main objective of using Matlab for this project is to provide a software solution which is cost effective as well as efficient for countries like Malaysia to be widely utilized in the healthcare industry. The development of this system involved several stages. These include image pre-processing techniques which were conducted before the calculation on the blood cells ratio could be implemented on the blood cells image. Examples of image pre-processing techniques include grayscale image, binary image and image contrast enhancement. In this project, the method used to determine the ratio of blood cells is by counting the number of white blood cell (WBC) to red blood cell (RBC). In this study, image processing system for blood cells calculation has been developed using two methods. The first method is shown in Fig. 1. By referring to this flow chart, the
Segment RBC or WBC NO
Convert to binary image YES Image enhancement
Ratio calculation of blood
End
Fig. 1. Flow chart of the image processing system
The second proposed method is shown in Fig. 2. Based on the flow chart, the image enhancement will be implemented during the first stage before it can be converted into grayscale image. The purpose for enhancing the image is the same as in the first method that is to provide cleaner and clearer image. Then, the rest of the steps are the same as in the first method.
2A2-2
Proceedings of the International Conference on Man-Machine Systems (ICoMMS) 11 – 13 October 2009, Batu Ferringhi, Penang, MALAYSIA
the gray level histogram is important to distinguish between RBC, WBC and background areas. A threshold value in an image normally lies in the valley between the two peaks. In Matlab 7.0, the development of the histogram can be done by using the IMHIST function. Fig. 3(c) shows an example of gray level histogram for a blood cells image. The histogram is divided into 3 separate regions which include the WBC, RBC and the background indicated by (a), (b) and (c) respectively. Therefore, the valley value between peaks in region (a) and (b) is the threshold value in distinguishing between RBC and WBC while the valley value between peaks in region (b) and (c) is the threshold value in distinguishing between RBC and background region. These two threshold values will be used to segment region of interest (RBC or WBC) in the blood cell images. Thresholding is a method of converting a grayscale image to a binary image so that the objects (WBC and RBC) are separated from the background [11]. Threshold value is applied on each image in order to obtain image with either RBC or WBC. Based on Fig. 3(c), we set the threshold into 3 regions; i) pixels value in the range of 0 to 89 were converted to 255 which represents the WBC, ii) pixels value in the range of 90 to 170 were converted to 255 which represents the RBC and iii) pixels value in the range of 171 to 255 were converted to 0 which represents the background.
Start
Original blood cell image
Image enhancement
Convert to grayscale image
Develop a histogram to obtain threshold value, T NO
Segment RBC or WBC
Convert to binary image
YES Ratio calculation of blood
End Fig. 2: Flow chart of the image processing system
C. Image Pre-processing Grayscale image, binary image and image contrast enhancement are among the pre-processing techniques involved in the development of this image processing system. D. Grayscale Image Original blood cells images are in colour. To ease the process of ratio determination, the original images will be converted into grayscale colour. Grayscale represents the intensity of the image. In Matlab 7.0, this can be done by using RGB2GRAY function. The RGB2GRAY converts RGB image to grayscale by eliminating the hue and saturation information while retaining the luminance. E. Histogram and Thresholding After the original image of blood cells has been converted into grayscale, the intensity distribution of that image can be presented through the gray level histogram. The frequencies of all the intensity levels can be seen, and the image can be analysed based on the gray level histogram [11]. In this study,
F. Binary Image Binary images are images containing only two colours, black (0) and white (1 or 255). Binary images are formed by thresholding a grayscale or color image to segment region of interest of an object from unwanted areas [11]. In this study, the thresholding technique was implemented on the grayscale image to obtain binary image of WBC (WBC will be white in colour while RBC and background areas will be black) and RBC (RBC will be white in colour while WBC and background areas will be black). If the results were not satisfied, the pre-processing techniques will be repeated by determining the new threshold values as mentioned in section E. G. Image Enhancement In the first method, image enhancement technique will be applied after the blood cell image has been converted into binary image. Normally, the original binary image consists of small spots within the image. These small spots are assumed as noise and need to be removed from the image. Hence, we proposed two image enhancement methods to remove the noise; i) removing pixels technique and ii) Gaussian filter. By using the removing pixels technique, every object in an image which contains less than 100 pixels will be eliminated. This is the best value that can be used because it does eliminate only the unwanted noise in the image. In Matlab 7.0, this can be done by using BWAREAOPEN function. Besides that, Gaussian filter was also applied on the binary image of the blood cell. Gaussian filter removes noise by smoothing but
2A2-3
Proceedings of the International Conference on Man-Machine Systems (ICoMMS) 11 – 13 October 2009, Batu Ferringhi, Penang, MALAYSIA
also blurs the image. Gaussian provides gentler smoothing and preserves edges better than a similarly sized mean filter. In the second method of image processing, the image enhancement technique was applied on the original image. For this method, only Gaussian filter was implemented on the original image. H. Calculation of Ratio After the blood cell image has been implemented with image pre-processing techniques as mentioned above, the number of WBC and RBC from the samples will be counted. This step is important in obtaining the ratio of WBC to RBC. First, the WBC number was determined and continued with the RBC number. The segmented blood cell image as in Fig. 3(d) and the function BWLABEL of Matlab 7.0 were used to count the number of cells automatically: [L, NUM]=BWLABEL (SEGMCELLS, 8)
(b) Grayscale image
(2.1)
The BWLABEL function labels blood cell in binary image as shown in Fig. 3(d) and returns the number of components found from the image in the output value, numObjects. Due to the irregular shape of cell, n was selected as 8 which mean that any 8-connected object (such as blood cell) in the image SEGMCELLS will be counted. The pixels were labeled 0 for the background. The pixels labeled 1 made up of one object, while the pixels labeled 2 made up of a second object, and so on. The WBC to RBC ratio can be calculated whenever the RBC and WBC numbers were obtained from the blood cell image. Finally, the number of blood cells NUM in image as shown in Fig. 3(a), is determined by using the Matlab 7.0.
(c) Gray level histogram
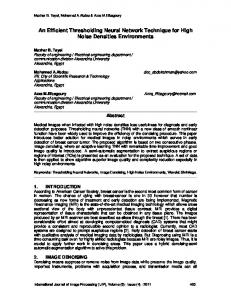
(d) Result of WBC in binary image Fig. 3. Application of image processing system to Acute Lmphoblastic Leukemia (ALL) image.
(a) Original image
2A2-4
Proceedings of the International Conference on Man-Machine Systems (ICoMMS) 11 – 13 October 2009, Batu Ferringhi, Penang, MALAYSIA
B. Ratio Determination of Blood Cell Images Fig. 4, 5, 6 and 7 show the results for all 91 images. For each figure, the 3 types of image (normal, ALL and AML) is shown by lines of yellow, blue and pink respectively. Fig. 4 shows the ratio of WBC to RBC which has been determined without applying the image enhancement techniques. This result was then compared with the two proposed methods discussed in Section 2. Fig. 5 and 6 show the results of ratio calculation using the first proposed method while Fig. 7 shows the results of ratio calculation using the second proposed method. The graph of WBC to RBC ratio for Acute Lmphoblastic Leukemia (ALL), Acute Melogenous Leukemia (AML) and normal blood cells are shown in Fig. 4, 5, 6 and 7. Fig. 5 shows the results of ratio calculation by using the first proposed method. Image enhancement technique used in this method was removing pixels. Fig. 6 also shows the first proposed method but for this the Gaussian filter was used for image enhancement. The second proposed method is shown in Fig. 7 where Gaussian filter was chosen to enhance the original image of blood cell. The blood cells image processing
Ratio of WBC to RBC 14 12 10 Ratio
A. Image Pre-processing on Blood Cell Images The two proposed method have been implemented on 91 blood cell images. From these 91 images, 34 images are normal blood cell and 57 images are abnormal blood cell (14 images of ALL and 43 images of AML). The results of the blood cells image pre-processing applied to the Acute Lmphoblastic Leukemia (ALL) image for blood cell counting are shown in Fig. 3. Fig. 3(a) shows the captured Acute Lmphoblastic Leukemia (ALL) image at a resolution of 600 x 400. The grayscale image of ALL blood cell is shown in Fig. 3(b). Fig. 3(c) shows the gray level histogram. Based on Fig. 3(c), the histogram indicates sharp accent at certain points when traversing the histogram from left to right. Since the blood cell slides were stained with chemicals to enable the nucleolus of the white blood cells to take a unique color, the gray level intensity in WBC is darker compared to the RBC. The histogram is divided into 3 separate regions which include the WBC, RBC and the background indicated by (a), (b) and (c) respectively. The threshold value was selected manually and used to segment the WBC or RBC from the image background. After applying the thresholding method, the binary images of WBC and RBC for each blood cell images were obtained as shown in Fig. 3(d). Object pixels (WBC and RBC) will have the value of 1 and the background pixels will have the value of 0. Based from these binary images, there are small spots of object appearing in the WBC background images. This noise was removed to enhance the quality of the images in order to obtain the accurate number of WBC and RBC in blood cell counting. The blood plasma and dust particles in WBC images were cleaned by removing all object containing fewer than 100 pixels and applying the Gaussian filter.
by applying Gaussian filter on the binary image (as in the first proposed method) will be the best method among the other methods to produce the blood cell ratio calculation. Overall the results show that the proposed methods are able to calculate the blood cell ratio. In each figure (Fig. 4, 5, 6 and 7), it is clearly seen that the ratio of WBC to RBC for normal image (shown by yellow line) and abnormal image (shown by blue line for ALL and pink line for AML) have difference range of ratio. For the normal images, it can clearly be seen that ratio range for normal images is 0 to 0.1. This shows that the number of WBC is less than RBC. For abnormal images, the ratio range is 0.2 to 2.5 for ALL and 0 to 14 for AML. These results show that the ratios for abnormal images (AML and ALL) are obviously higher than the ratios for normal blood cells images. The results also show that the ratio of WBC and RBC is suitable and able to be used in leukemia detection.
8 6 4 2 0 1 3 5
7 9 11 13 15 17 19 21 23 25 27 29 31 33 35 37 39 41 43 Image
ALL AML Normal Image
Fig. 4. The ratio of WBC to RBC for unfiltered image
Ratio of WBC to RBC 14 12 10 Ratio
III. RESULTS AND DISCUSSION
8 6 4 2 0 1 3 5 7 9 11 13 15 17 19 21 23 25 27 29 31 33 35 37 39 41 43 Image
Fig. 5. The ratio of WBC to RBC for filtered image by using removing pixels
2A2-5
Proceedings of the International Conference on Man-Machine Systems (ICoMMS) 11 – 13 October 2009, Batu Ferringhi, Penang, MALAYSIA
REFERENCES Ratio of WBC to RBC
[1]
R. M. Rangayyan, Biomedical Image Analysis. Florida, USA: CRC Press LLC, 2005. [2] R. Rajesh, M.R. Kaimal and K. Srinivasan, “A Note on Medical Image Analysis and Visualization using Matlab,” in GVIP 05 Conference, CICC, Cairo, Egypt, 2005. [3] R. Adollah, M.Y. Mashor, N.F. M. Nasir, H. Rosline, H. Mahsin, and H. Adilah, “Blood Cell Image Segmentation,” in IFMBE. vol. 21, 2008, pp. 141–144. [4] S. Mao-jun, W. Zhao-bin, Z. Hong-juan, and M. Yi-de, “A New Method for Blood Cell Image Segmentation and Counting Based on PCNN and Autowave,” in ISCCSP 2008 Malta, 2008. [5] The University of Texas M. D. Anderson Cancer Center (2001). Living with Leukemia. [6] Wan Muhammad Zulhusni bin Abdul Halim, (2006). Chemotherapy For Leukemia, http://www.imamrsc.com/v1/index.php?option=com_content&task=vie w&id=17&Itemid=34, 2009. [7] A. Jemal, R. Siegel, E. Ward, Y. Hao, J. Xu, and M. J. Thun, "Cancer statistics, 2009," CA: A Cancer Journal for Clinicians, 2009. [8] National Cancer Registry, Malaysia (2006). Malaysian Cancer Statistics: Data and Figure Peninsular Malaysia 2006. [9] G.P.M Priyankara, O.W Seneviratne, R.K.O.H Silva, W.V.D Soysa and C.R. De Silva, “An Extensible Computer Vision Application for Blood Cell Recognition and Analysis”, 2006. [10] T. Bergen, D. Steckhan, T. Wittenberg, and T. Zerfaß, “Segmentation of Leukocytes and Erythrocytes in Blood Smear Images,” in 30th Annual International IEEE EMBS Conference Vancouver, British Columbia, Canada, 2008. [11] R. Jain, R. Kasturi and B. G. Schunck, Machine Vision. International Edition 1995, McGraw Hill, Inc, 1995.
3.5 3 2.5 Ratio
2 1.5 1 0.5 0 1 3 5
7 9 11 13 15 17 19 21 23 25 27 29 31 33 35 37 39 41 43 Image
Fig. 6. The ratio of WBC to RBC for filtered image by applying Gaussian filter on the binary image
Ratio of WBC to RBC 12 10
Ratio
8 6 4 2 0 1 3
5 7 9 11 13 15 17 19 21 23 25 27 29 31 33 35 37 39 41 43 Image
Fig. 7. The ratio of WBC to RBC for filtered image by applying Gaussian filter on the original image IV. CONCLUSION
With the increasing number of leukemia cases in Malaysia and worldwide, there is a need for fast and cost-effective production of blood cell count reports. This paper proposed an image processing system utilising Matlab software for blood cells counting for leukemia detection. The image processing system includes an effective and efficient method in recognizing and counting blood cells as a practical alternative to the manual blood cell counting. The blood cell ratios obtained are based on the image enhancement methods applied during the blood cells image pre-processing. The blood ratios calculation yields promising results in determining types of images (normal and abnormal blood cell images). Since this paper is based on an ongoing study, more enhancement and improvement could be done in the future works. ACKNOWLEDGMENT The authors would like to thank the team members of acute leukemia research of UNIMAP and Hospital Universiti Sains Malaysia (HUSM) for their help and guidance.
2A2-6