Applying Neural Networks and Geographical Information Systems to Airport Noise Evaluation Yingjie Yang1 , David Gillingwater2, and Chris Hinde3 1
Centre for Computational Intelligence, De Montfort University, The Gateway, Leicester, LE1 9BH, UK
[email protected] 2 Transport Studies Group, Department of Civil and Building Engineering, Loughborough University, Loughborough, LE11 3TU, UK
[email protected] 3 Department of Computer Science, Loughborough University, Loughborough, LE11 3TU, UK
[email protected]
Abstract. The assessment of aircraft noise is becoming an increasingly important task in ensuring sustainable airport development. Aircraft noise is influenced by many complex factors and traditional laboratory models are not sufficient to assess the exposure to noisy flights of specific local communities in proximity to an airport. In this paper neural network and fuzzy set methods have been integrated with Geographical Information Systems to provide an alternative method to evaluate airport noise.
1 Introduction In airport operations, identifying and monitoring noise disturbance caused by a specific aircraft movement at a specific airport on a specific local community is very important when considering financial penalties, compensation claims and social costs [1]. The standard methodologies available follow one of two classes: (i) the ‘laboratory model’ - based on laboratory-type experiments and standardized in-situ tests undertaken in given conditions; or (ii) the ‘replication/simulation model’ based primarily on in-situ test data. However, in practice it is not feasible to monitor each impacted locality around an airport and the interactions between the key factors are too complicated to enable reliable mathematical models to be developed. As a result, laboratory models are in fact the dominant models in use. For instance, aircraft noise calculations around airports are dominated by calibrated models based on standard condition tests and aircraft engine manufacturers' data, such as the US FAA integrated noise model, the INM [2]. These standard models are very useful in simulation analysis at a general level, but they do not have the capacity to incorporate specific local conditions; thus the reliability of their results are subject to standardised assumptions regarding, for example, aircraft engine power settings, geographical factors and weather conditions. From this point of view, a location-specific model
established with data from that site is likely to yield more realistic results although its generalizability is likely to be poor when compared with the laboratory model. As part of our work on devising a decision support system for planning sustainable airport development [3], [4], we applied neural networks [5] and fuzzy sets [6] as a mapping tool to establish the impact of aircraft noise on localities around an airport in a Geographical Information System [7] environment.
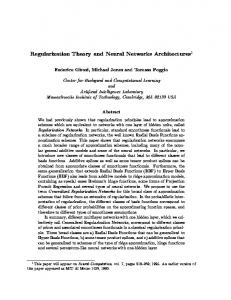
2 System framework A neural network excels at learning from data and does not require the prior specification of a mathematical model. This feature makes it an ideal candidate in environmental analysis where a large amount of monitoring data exists but where the interactive mechanisms are too complicated or little understood to specify an accurate mathematical model. As a spatial analysis tool, GIS is ideal in dealing with environmental simulation and analysis. Hence, it is a logical step to integrate both into one system. Neural networks have mainly been applied to spatial interpolation [8], spatial attribute mapping [9], [11], [12] and error simulation [13]. In airport operations, however, a clearly defined result or numerical value is often required as an understandable output, and a map generated from a GIS may provide only distributional information rather than a clear conclusion such as the number of disturbed people or affected properties. To overcome this problem, we propose to adopt fuzzy sets incorporated with neural networks. The general structure of this integration is shown in Figure 1. Data Storage
Data Input
GIS Analysis
Neural networks
User Interface
Fuzzy Sets
Fig. 1. A framework for linking neural networks and fuzzy sets with GIS
Here neural networks and fuzzy sets provide a powerful function to GIS, but it is embedded within the functionality of a GIS system - there is no perceived difference to the users of GIS from the point of view of operation as long as a trained neural network is already installed. The system only calls a neural network and its associated fuzzy logic operation when no other method can meet a requirement or where the user selects the involvement of a neural network. The data required as inputs to the neural networks are fed from the GIS operation, from which neural networks map out an intuitive solution [9 ], [10], [11], [12]; these results are then considered as
fuzzy sets and a fuzzy analysis is carried out to generate outputs as attributes and images as well as corresponding numerical values. These results can then be fed into the map algebra function together with other maps to produce synthesised results or provide direct results to assist the final decision making process. In the process overall, neural networks play an advanced function to solve those otherwise difficult mapping problems.
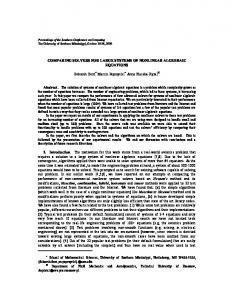
3 The role of neural networks and fuzzy sets Considering the spatial and temporal distribution of aircraft noise, all locations in proximity to the same airport experience similar weather conditions and the same noise sources; their spatial difference is the main factor in determining the distribution of aircraft noise impacts. Therefore, we establish a set of neural networks using distance to consider the macro spatial relationships between aircraft noise and its distribution. If the input noise level disturbs a local community, then the output frequency of the neural networks can be taken as an indicator for the disturbance caused by its corresponding noise level. If we consider this local community as a fuzzy subset, the normalised frequency value could be considered as the fuzzy membership of those properties or persons disturbed by the corresponding aircraft type. In this way, the output of a neural network becomes a set of fuzzy subsets. Their members are the properties or people in the corresponding locality, and their memberships are the normalised frequencies. Unlike other approaches [14], here we do not consider the shape as fuzzy, and we can calculate the corresponding number of disturbed properties or people based on a fuzzy area [15]. A simplified diagram is shown in Figure 2. Distance Wind speed Wind direction Surface temperature Operation mode Aircraft type Noise level
Neural Networks
Noisy frequency
Fuzzy Sets
Fuzzy Area
Fig. 2. Neural network inputs and outputs
For the sake of simplicity, fine grain spatial details have not been included in our model since, following trial tests, we found that aircraft noise data are sufficiently complicated when considering only one aircraft type (e.g., Boeing 747-400). It is difficult to establish a satisfactory neural network with the inclusion of different aircraft types, hence we keep it separate from the input factors and establish an embedded network when considering aircraft types. The output is based on the frequency of aircraft noise rather than absolute noise levels. For example, flights regarded as ‘really noisy’ are those departures or arrivals with a noise level higher than some threshold. In this sense, the same aircraft may not necessarily be as noisy for
each of its operations, since its noise output will depend on many other complex interactions within the system. It is very difficult to monitor all factors which influence aircraft noise levels, but it is relatively apposite to test the probability of an aircraft event being noisy for each kind of aircraft during its operation at the same airport. By the probability of an aircraft event being noisy, we mean the probability for the aircraft noise level to go beyond some given threshold for a specific geographical location at the airport. Given the noise monitoring level {L1(x), L2(x), L3(x), …, Ln(x)} when the distance between an aircraft flight trajectory and the location under scrutiny is within [d 1,d 2] for the same aircraft in the same operation mode under similar weather conditions, the 'noisy probability' p(x,t) is calculated as
p (x , t) =
| {Li ( x ) : Li ( x) > t } | n
(1)
Here, x is the specified location and n is the cardinality of the data monitored for that location with distance in [d 1,d 2]. Note that [d 1,d 2] is a 'grey number' [16] and its degree of greyness determines the resolution of the noisy probability. Lt is the threshold for the 'noisy' noise level. However, a lower degree of greyness has less data available, hence it has to be balanced between the high resolution and reliable probability. With noisy probability, the noisy frequency F(x,t) is easy to derive:
F ( x, t ) = p( x, t ) × N f
(2)
where Nf is the number of flights operated at the airport during the given time interval. It is clear that p(x,t) is in fact the normalised frequency, and therefore it can serve as the fuzzy membership. The notion of the area (AR) of a fuzzy set can now be introduced (15). For a fuzzy set E, formed by discrete pixels referenced by a coordinate pair (x, y) with area A(x, y),
AR( E ) = ∑∑ µ E ( x , y ) A( x, y ) x
(3)
y
Each locality can be considered as a fuzzy entity consisting of properties or people. We consider the area here as the number of properties or people in a given area, hence the area of the entity could be approached using a series of tiny grids. The fuzzy membership of properties or people in each tiny grid is considered to be the same. Note that if we divide the entity using large grids, then the influence of the fuzzy boundary could be neglected. Therefore, Equation (3) could be adapted to calculate the number of properties or people who suffer a disturbance.
N E ( x, t ) = ∑ pE ( x, t , i ) N E ( i )
(4)
i
Here, NE(x,t) is the equivalent number of disturbed properties or people in the corresponding locality, p E(x,t,i) is the fuzzy membership of grid i, and NE(i) is the number of properties or people in grid i. For simplicity, we consider each flight takes a similar amount of time to take-off from or approach the airport. Hence each flight can be counted only once in the frequency calculation. For the situation where we have more than one trajectory, the probabil-
ity is calculated separately for each trajectory. In the final analysis, a general probability is then calculated according to their weight in terms of number of operations.
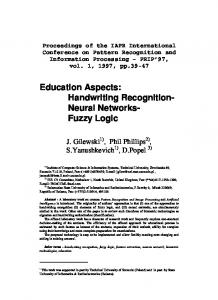
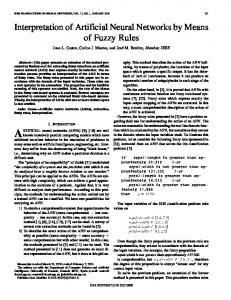
4 Example output maps The training of a neural network is often a difficult task, especially for problems like noise where the data have such large fluctuations. Partly in response to such problems, we have undertaken extensive work in improving the quality of training using different methods and analysing the different impacts of input factors [17], [18], [19]. For a trained neural network with data from a single aircraft type, output based on a number of virtual flight tracks is shown in Figure 3. The network was trained using aircraft noise monitoring data from a large UK international airport for a single aircraft type – the Boeing 757. The figure to the right highlights those localities and their populations subject to noise disturbance by this aircraft type’s movements.
runway track road locality
Fig. 3.
runway track road locality
Noisy frequency distribution derived from neural networks
5 Conclusions Artificial neural networks and fuzzy sets are typically two mainstream applications currently in use to overcome the uncertainty and complex interactions associated with solving real world problems. With the increasing awareness among airport operators of the need to ensure the sustainable development of their airports, ever more monitoring data are being recorded around the major airports of the world. This has laid a solid foundation for neural networks to be applied to the environmental evaluation of airport operations where huge uncertainties and complex interactions exist. The interpretation of the results from these neural networks could however be further enhanced using fuzzy sets. In this paper, we have demonstrated a system that integrates both neural networks and fuzzy sets with Geographical Information Systems as a method to assess the exposure to noisy flights of specific local communities in proximity to an airport. Our results show that their integration can provide an alternative to existing modelling methods.
References 1. Morrell, P., Lu, C.H.: Aircraft noise social cost and charge mechanisms - a case study of Amsterdam Airport Schiphol. Transportation Research, Part D: Transport and Environment. 5 (2000) 305-320 2. Connor, T.S.: Integrated Noise Model - The Federal Aviation Administration's Computer Program for Predicting Noise Exposure Around an Airport. Proceedings of the International Conference on Noise Engineering. INTER-NOISE80. (1980) 127-130 3. Yang, Y., Gillingwater, D., Hinde, C.: An intelligent system for the sustainable development of airports. Proceedings of the 9th World Conference on Transportation Research (WCTR). (2001b) F5-02 4. Yang, Y., Gillingwater, D., Hinde, C., Upham, P.: A scaled approach to developing a decision support system for sustainable airport development. Proceedings of the UK Sustainable Cities and Aviation Network (SCAN-UK) Conference, Manchester (2001d) 5. Hechi-Nielson, R.: Neurocomputing. Addison-Welsley, Reading MA (1990) 6. .Zadeh, L.: Fuzzy sets. Information and Control, 8 (1965) 338–353 7. Burrough, P.A., McDonnell, A.M.: Principles of Geographical Information Systems. Oxford University Press, Oxford (1998) 8. Rigol, J.P., Jarvis, C.H., Stuart, N.: Artificial neural networks as a spatial interpolation. International Journal of Geographical Information Science. 15 (2001) 323-343 9. Yang, Y., Rosenbaum, M.: Spatial data analysis with ANN: Modelling to manage geoenvironmental problems caused by harbour siltation. Proceedings of International Symposium on Spatial Data Quality (ISSDQ’99). (1999) 534-541 10.Yang, Y., Rosenbaum, M.: Artificial neural networks linked to GIS for determining sedimentology in harbours. Journal of Petroleum Science and Engineering. 29 (2001) 213-220 11.Yang, Y., Rosenbaum, M.: Artificial neural networks linked to GIS. In: Nikravesh, M., Aminzadeh, F., Zadeh, L.A. (Eds.): Developments in Petroleum Science, 51: Soft Computing and Intelligent Data Analysis in Oil Exploration. Elsevier Science. (2002) 12.Yang, Y., Rosenbaum, M., Burton, C.: An intelligent database for managing geoenvironmental change within harbours. Environmental Geology. 40 (2001c) 1224-1231. 13.Brunsdon, C., Openshaw, S.: Error simulation in vector GIS using neural computing methods. In: Worboys, M.F. (eds): Innovation in GIS. Taylor & Francis, London (1994) 14.Fonte, C., Lodwick, W.: Areas of fuzzy geographical entities, International Journal of Geographical Information Science. 18 (2004) 127–150 15.Rosenfeld, A.: The diameter of a fuzzy set. Fuzzy Sets and Systems. 13 (1984) 241–246 16.Liu, S., Guo, T., Dang, Y.: Grey system theory and its application. The Science Press of China, Beijing (2000) 17.Yang, Y., Hinde, C., Gillingwater, D.: A new method to evaluate a trained artificial neural network. Proceedings of the International Joint Conference on Neural Networks 2001 (IJCNN’01). (2001a) 2620-2625 18.Yang, Y., Hinde, C., Gillingwater, D.: A new method in explaining neural network reasoning. Proceedings of the International Joint Conference on Neural Networks 2003 (IJCNN’03). (2003) 3256-3260