for each protein. Te green dot indicates the average from Table . (bottom). Te black dots are the performance measures of each individual protein of the Keskin.
Graphical Models for Protein-Protein Interaction Interface Prediction
Inauguraldissertation zur Erlangung des akademischen Grades eines Doktors der Naturwissenschaften (Dr. rer. nat.) der Mathematisch-Naturwissenschaftlichen Fakult¨at der Ernst-Moritz-Arndt-Universit¨at Greifswald
vorgelegt von
Torsten Wierschin geboren am 28. September 1973 in Bautzen Greifswald, September 2014
Dekan: Prof. Dr. Klaus Fesser
1. Gutachter: Dr. Mario Stanke, Universit¨at Greifswald
2. Gutachter: Prof. Dr. Tom´aˇs Vinaˇr, Comenius University Bratislava
Tag der Promotion: 19. M¨arz 2015
ii
Contents Page 1
Introduction 1.1 Biological foundations . . . . . . . . . . . . . . . . . . . . . . . . . . 1.2 Predicting the protein-protein interaction interface . . . . . . . . .
2
Interface site prediction using conditional random fields 2.1 Terms and definitions . . . . . . . . . . . . . . . . . . . 2.2 Change in free energy (∆F) . . . . . . . . . . . . . . . 2.3 Relative solvent-accessible surface area (RASA) . . . 2.4 Feature “Regensburg” (rg) . . . . . . . . . . . . . . . .
3
. . . .
. . . .
. . . .
. . . .
. . . .
. . . .
. . . .
. . . .
Inference 3.1 Exact inference of labeling problems . . . . . . . . . . . . . . . . . . 3.1.1 Tractable partition sum for a restricted labeling class . . . 3.1.2 Tractable partition sums for complete graphs . . . . . . . . 3.1.3 Decidability of the maximum marginal probability problem 3.1.4 The relaxation labeling algorithm . . . . . . . . . . . . . . . 3.1.5 Mapping n-ary feature functions . . . . . . . . . . . . . . . 3.1.6 The application of MinCut algorithms . . . . . . . . . . . . 3.1.7 Exact solution of the MinCost problem on partial m−trees 3.2 Approximate inference of labeling problems . . . . . . . . . . . . . 3.2.1 Belief Propagation . . . . . . . . . . . . . . . . . . . . . . . . 3.2.2 The α−expansion move algorithm . . . . . . . . . . . . . . 3.3 Complexity considerations . . . . . . . . . . . . . . . . . . . . . . . . 3.3.1 The complexity of inference in CRFs . . . . . . . . . . . . . 3.3.2 The complexity of the consistent labeling problem . . . . .
iii
3 3 5 9 10 16 19 22 25 25 25 29 31 34 36 37 49 51 52 53 59 59 60
CONTENTS 4 Parameter training 4.1 Supervised training using Maximum-Likelihood principle 4.1.1 Training weights using gradient-descent search . . 4.1.2 Initializing training algorithms . . . . . . . . . . . 4.2 Supervised training using Large-Margin principle . . . . . 5
. . . .
63 63 64 68 71
Results 5.1 Comparison to linear-chain CRF using Keskin list . . . . . . . . . . 5.2 Comparison to PresCont using PlaneDimers . . . . . . . . . . . . . 5.3 Assessing the performance of feature combinations . . . . . . . . .
79 80 85 88
. . . .
. . . .
. . . .
. . . .
6 Conclusion and Discussion
93
Bibliography
95
1
CONTENTS
2
Chapter 1 Introduction In this chapter the basic biological terms which are used in the field of proteinprotein interaction interface predictions are introduced. In particular, the protein structures are described that are available as digital data in a computer-readable form and which are analyzed by the algorithmic methods presented in this thesis.
1.1
Biological foundations
Proteins are organic compounds which are built from twenty different amino acids. Together with their most interesting physical and chemical properties, they are shown in Figure 1.1. Amino acids share a common atomic structure which usually comprises one nitrogen and two carbon atoms. The common structure is bound to other molecules like hydrogen or oxygen while the central carbon atom is denoted as the C α −atom. The amino acids are put on a linear chain – the backbone of the protein – which in turn is folded into a three-dimensional object. As an example, consider the protein denoted by 2you in Figure 1.2. Its designation is in accordance with the nomenclature of the Protein Data Bank (Release July 07, 2011) which is available at www.pdb.org. This database is the exclusive source for the present work and contains more than 100 000 protein structures in the standardized pdb file format (wwPDB 2012). Proteins interact with each other to accomplish biological functions, and hence are involved in processes like - oxygen binding in human blood, - the intrusion of viruses into living cells or
3
1.1. BIOLOGICAL FOUNDATIONS
Figure 1.1: Basic building blocks of proteins: amino acids. Columns list letter codes together with chemical and physical properties for each amino acid. - catalyzing electron exchange in the presence of light as an essential biochemical activity during photosynthesis and many others. Essentially, they are part of any process in living cells. In order to do so, they form complexes as depicted in Figure 1.3. In the picture, the two interacting proteins are colored blue and green. The red balls indicate the amino acids (residues) of the blue protein partner, that constitute the so-called interaction interface. The interactions are caused by the conformation of protein complexes and can be transient or temporarily stable. The nature of the conformation heavily depends on molecular statistical properties such as surface shape and residue packaging, hydrophobicity, polarity as well as the amino acid sequence itself. The interactions can be realized by different protein constituents like the ribosome or the chaperonins. Further, the interactions are accomplished by protein complexes which are especially composed during enzyme catalysis and inhibition, and along the signal pathways. Decisive knowledge of protein interaction areas can help determining the functional scope. Furthermore, the understanding of protein-protein interac4
CHAPTER 1. INTRODUCTION
Figure 1.2: Protein 2you is shown such that each atom of a residue is equally colored, if the containing residue has the same amino acid type. tions which almost constitute every biological process is the essential basis for new therapeutic approaches to treat diseases, see e.g. (Sowa et al. 2001; Zhou 2004; Sugaya and Ikeda 2009; Sugaya et al. 2007). Interaction interface residues play a particular role e.g. in protein mimetic engineering or molecular pathway exploration (Arkin and Wells 2004; Yin and Hamilton 2005). Additionally, it is assumed that detailed knowledge of the interface residues allows to build more elaborated structural models of protein complexes. Therefore determining the protein-protein interaction interfaces given the spatial structure of only one of the interacting partners is an important practical question in the life sciences.
1.2
Predicting the protein-protein interaction interface
The amount of information which can be generated from structure and sequence, the ongoing growth in computational resources as well as the development of new prediction methods have accompanied the expansion of computing methods for 5
1.2. PREDICTING THE PROTEIN-PROTEIN INTERACTION INTERFACE
Figure 1.3: Blue and green balls are residues of two separate proteins. Red balls are residues of the blue protein partner, that interact with the green protein. prediction of protein-protein interaction interfaces. Starting with the work of Jones et al. (Jones and Thornton 1996) and their effort to classify surface patches that overlap with interaction interfaces, several contributions presenting different approaches have been published. The introduced methods can be put into the following classes. At first, methods have been proposed which are only based on sequence information (Gallet et al. 2000; Ofran and Rost 2003; Reˇs, Mihalek, and Lichtarge 2005). Further, approaches like (Yan, Dobbs, and Honavar 2004a; Li et al. 2006) exploit the protein structure to prepare sequence sets which are then applied to derive a predictor. The methods of the last category only use the spatial structure or combine spatial structure and the sequence (Aytuna, Gursoy, and Keskin 2005; Burgoyne and Jackson 2006; Neuvirth, Raz, and Schreiber 2004). The used machine learning method also differs among the prediction tools: scoring functions (Burgoyne and Jackson 2006), SVM (support vector machines) with radial kernel (Koike and Takagi 2004; Bradford and Westhead 2005; Yan, Dobbs, and Honavar 2004b) and neural networks (Ofran and Rost 2007; Zhou and Qin 2007) have been adapted. In the present thesis a conditional random field (CRF) approach and its imple-
6
CHAPTER 1. INTRODUCTION mentation is presented – which is called ∆F-CRF – to predict the interaction sites of protein homo- and heterodimers using the spatial structure of one protein partner from a complex. The method includes a substantially simple edge feature model. A novel node feature class is introduced that is called “change in free energy” (∆F). The Online Large-Margin (OLM) algorithm of Crammer et al. (Crammer, Mcdonald, and Pereira 2005) is adapted in order to train the model parameters given a classified reference set of proteins. A significantly higher prediction accuracy is achieved by combining our new node feature class with the standard node feature class relative accessible surface area (RASA). The quality of the predictions is measured by computing the area under (AUC) the receiver operating characteristic (ROC). The comparison of the prediction accuracy from various approaches is still complicated, since neither a standardized benchmark is available, which e.g. comprises an acknowledged reference set of proteins nor exist generally accepted performance measures. However, the proposed CRF-framework generates significantly higher AUC values than the PresCont method (Zellner et al. 2011). These results are achieved on a set of 128 homodimers compiled by Zellner et al. (Zellner et al. 2011). These proteins exhibit flat interaction interface areas. Hence, the authors call this two-chain protein list PlaneDimers. Furthermore, the shown approach outperforms the method by Li et al. (Li et al. 2007) in terms of sensitivity and specificity. The comparison to this latter method is accomplished with a data set containing 1276 protein chains published by Keskin et al. (Keskin et al. 2004) and used by Li et al. . This diverse, structurally non-redundant data set includes proteins with a broad functional scope like toxins or enzymes/inhibitors and immunoglobulins. From the results presented, it can be deduced that the proposed CRF approach and the combination of the node feature classes RASA and ∆F, yields a significant improvement in interface prediction accuracy over the two other methods.
7
1.2. PREDICTING THE PROTEIN-PROTEIN INTERACTION INTERFACE
8
Chapter 2 Interface site prediction using conditional random fields The set of residues of one protein that is in contact with residues of another protein is called the interaction interface whereas a residue alone, being part of the interface, is called a binding site. It is still not clear by these notions if a residue contributes to the interface because of its binding capabilities, i.e. forming or stabilizing a protein complex, or its indispensability in a biological process, which is the result of the compounding of several proteins into a protein complex. It is obvious that this distinction is valid, but in most of the current research activities and in the present work it is neglected and both aspects of interface interactions are considered the same. It is implied that both or all proteins involved in the interaction belong to the same protein complex. The residues in the interaction interface are assumed to be geometrically close to each other on the protein surface. In this thesis, the problem of predicting the interaction sites is transferred to the computational task of assigning each residue a label from the set L = {I, N } given some observational data. The labels I and N distinguish between residues contained in the interaction interface (I) from these being not in the interface (N ). The observational data comprises the structure of a single protein, but not the structure of the whole complex. Examples for protein characteristics integrated as hints in the implementation are the relative accessible surface area (RASA) and the change in free energy (∆F) associated with each residue. It is acknowledged in the model that such observations may possibly be highly correlated. The random vector Y represents this observational data.
9
2.1. TERMS AND DEFINITIONS
2.1
Terms and definitions
In this section the formalism of conditional random fields in accordance with Lafferty et al. (Lafferty, McCallum, and Pereira 2001) is introduced and is applied to the protein-protein interaction interface prediction problem. In order to do so, definitions are given here that are used throughout the thesis and which are according to Diestel (Diestel 1996). Denote by N the positive integers, denote by R the real numbers. Let A be a set. Let [A]k denote the set of all k-sized subsets of A with k ∈ N. This notion is distinct from the notion of the Cartesian product Ak = A × A × ⋯ × A, ´¹¹ ¹ ¹ ¹ ¹ ¹ ¹ ¹ ¹ ¹ ¹ ¹ ¹ ¹ ¹ ¹ ¸¹ ¹ ¹ ¹ ¹ ¹ ¹ ¹ ¹ ¹ ¹ ¹ ¹ ¹ ¹ ¹ ¹¶ k times
since the latter denotes the set of all k-tuples of elements of A. Let us consider the k-tuple (a1 , a2 , . . . , a k ) such that a i ∈ A for each 1 ≤ i ≤ k. In contrast to a set of k elements, in a k-tuple the order of the elements is relevant. We call the object at the ith position – e.g. a i – the ith component of the tuple. The shown k-tuple is equivalently written as (a i )ni=1 . Let Γ = (Y1 , Y2 , . . . , Yk ), Γ ∈ Ak denote a k-tuple of variables where each Yi takes values from the set A. Γ is also written as (Yi )ki=1 . Definition (Undirected graph). A graph is a pair H = (χ, K) of disjunctive sets with K ⊆ [χ]2 . This means the elements of K are subsets of χ, each of which has size 2. The elements of χ are called nodes, the elements of K are called edges. A graph is called undirected, because there is no distinction between the two nodes belonging to an edge. Generally, χ ⊂ N. A graph can be drawn in such a way that nodes are points and two points are connected by a line if and only if these two points are an edge. Nevertheless, whatever the drawing of graph is alike, the formal definition of a graph is independent from such drawings. Definition (Path). A path P is a graph H = (χ, K) which has the form χ = {1, 2, . . . , n},
K = {{1, 2}, {2, 3}, . . . , {n − 1, n}}.
10
CHAPTER 2. INTERFACE SITE PREDICTION USING CONDITIONAL RANDOM FIELDS It is assumed, that the nodes of P are pairwise distinct. The nodes 1 and n are called the endpoints of P and these are connected by P. The subset of nodes {2, . . . , n − 1} are called inner nodes of P. Definition (a − b - path). Let a graph H = (χ, K) be defined. Let P ⊆ χ denote a subset of nodes from χ. P is a path in H if it meets the nodes a and b of H and these two nodes are distinct. Furthermore, if the inner nodes of P are pairwise distinct then P is called nontrivial. Definition (Connected graph). A graph H = (χ, K) is connected if it contains for each two distinct nodes i, j ∈ χ an non-trivial i − j - path. Sometimes the notation G(V , E) for a graph G with nodes V and edges E is used instead of H = (χ, K). Definition (Neighborhood of a node). The set of neighbors of a node i is denoted by Γ(i) or equivalently Γi such that each node j, (i < j) with {i, j} an edge in K is contained in Γ(i) ⊆ χ, i.e. j ∈ Γ(i). Definition (Completeness, clique). Two nodes i, j ∈ χ are called neighbors or adjacent in H if {i, j} ∈ K that is there is an edge between them. Two edges {i, j}, {k, l} ∈ K are called neighbors if and only if ∣{i, j} ∩ {k, l}∣ = 1. If this is the case for each pair of edges in H then the graph H is called complete. If this is true for subsets of edges in H then these edge subsets are called cliques in the graph. Some presentations in the thesis require a further structures. Definition (Directed graph, multi-edge, parallel edges, loop). A directed graph is a pair H = (χ, K) of disjunctive sets with K ⊆ χ2 together with two mappings init ∶ K ↦ χ and ter ∶ K ↦ χ which associate to each edge (i, j) ∈ K the starting node init(i, j) and the ending node ter(i, j). The edge (i, j) is called directed from node init(i, j) to node ter(i, j). Multiple edges between i and j are allowed and called multi-edges. Multi-edges with the same direction are called parallel. If init(i, j) = ter(i, j) then the edge is called a loop.
11
2.1. TERMS AND DEFINITIONS Let H = (χ, K) be an undirected graph with nodes χ = {1, 2, . . . , n} and edges K. Each residue of the protein is identified with a node i in the graph and hence, n is the number of residues of the protein. Each edge {i, j} ∈ K, (i < j) represents a relation between the nodes i and j. It depicts the neighborly arrangement of two residues in the protein. For the problem of protein interaction side prediction, the set K is defined as K = {{i, j} ∣ d(i, j) ≤ δ, 1 ≤ i < j ≤ n},
(2.1)
where δ is called the edge inclusion radius. According to Keskin et al. (Keskin et al. 2004), the distance of two residues is defined as the distance of their C α −atoms. δ is taken large enough, so that the residue pairs of the protein backbone are contained in K. All backbone residue pairs, which are neighbors on the amino acid sequence ˚ Nevertheless more edges are level, are usually collected in K defined by a δ ≥ 3.5A. included when δ is increased. By a rule of thumb, the number of included edges grows cubically when increasing the inclusion radius threshold. The dependency of the prediction performance on δ is outlined in Section 5. A random variable X i with values from L is associated to each node i. This association is given by a mapping i ↦ Xi . Let the labels
ξi ∈ L
be realizations of the random variables X i . In the following, for each protein a conditional distribution on the random vector X = (X1 , . . . , X n ) is defined. The vector
ξ = (ξ1 , ξ2 . . . , ξ n )
is a realization of X and is called a labeling of the residues χ. For each node a set of B different functions is defined. These functions are 2 called node feature functions or node features. For each edge a set of ∣L∣ different functions is defined. These functions are called edge feature functions or edge
12
CHAPTER 2. INTERFACE SITE PREDICTION USING CONDITIONAL RANDOM FIELDS features. These feature functions are included in the following set f ∶= { f i,ν,ξ (X i , y)}
∪ { f{i, j},(ξ,ξ′ ) (X i , X j , y)}
1≤ν≤B ξ∈L i∈χ
The node features
(ξ, ξ′ ) ∈ L2 {i, j} ∈ K i < j.
f i,ν,ξ (X i , y)
are mappings from protein properties to real values given fixed data Y = y and label ξ for the node i, where y is an instance of a data vector, i.e y = (y i )ni=1 . It should be clear from contexts that only a component of the data vector is used for node feature functions, hence the index is sometimes omitted which should not confuse the presentation. The edge features f{i, j},(ξ,ξ′ ) (X i , X j , y) are mappings from protein properties to real values given fixed data Y = y and labels (ξ, ξ′ ) for the edge {i, j}, (i < j). Instead of working with raw values of the protein properties, indicator functions as feature functions are applied. Furthermore, in this thesis the edge feature functions are chosen to depend neither on the data nor on the particular edge they are belonging to: f{i, j},(ξ,ξ′ ) (X i , X j ) = 1{X i = ξ, X j = ξ′ },
(2.2)
where 1 is the indicator function. Another way to think of this is as parameter tying for all these edge features. Given this, potentials are defined for each edge {i, j} ∈ K, (i < j) and each node i ∈ χ as B
fi (X i , y) = ∑ ∑ wν,ξ ⋅ f i,ν,ξ (X i , y)
(2.3a)
ξ∈L ν=1
f{i, j} (X i , X j ) =
∑
(ξ,ξ′ )∈L2
w(ξ,ξ′ ) ⋅ f{i, j},(ξ,ξ′ ) (X i , X j ).
(2.3b)
The real numbers w(ξ,ξ′ ) , wν,ξ will be referred to as weights. We also introduce an alternative form for these weights that is more convenient for training, i.e. the estimation of the weights which is described in Section 4. For this, fix an arbitrary 13
2.1. TERMS AND DEFINITIONS ordering of the features. The feature set f can then be interpreted as a column vector of functions. This is denoted by f(ξ, y) which indicates the dependency from a given labeling ξ and data y. Let w be the column vector of the corresponding weights as used in (2.3b,2.3a). Note that, because of parameter tying, some weights in the parameter set wK = (wI,I , wI,N , wN ,I , wN ,N ) w χ,I = (w1,I , . . . , wB,I ) w χ,N = (w1,N , . . . , wB,N ) w χ = (w χ,I , w χ,N ) w = (wK , w χ )
(2.4)
occur multiple times in w. Further, let us introduce for later reference the functions Ψ i (X i , y) = exp fi (X i , y)
and
Φ{i, j} (X i , X j ) = exp f{i, j} (X i , X j ), (2.5)
that can be easier handled under some circumstances. For node features according to the right hand side of Equation (2.3a) a binning approach is used that is defined as follows. Consider as an example the node feature class RASA as shown in Section 2.3. The observed data at node i is denoted by RASA(i, y). The range of this protein property is divided into τ ≥ 2 intervals (bins) with boundaries −∞ =∶ b0 < b1 < b2 < . . . < b τ−1 < b τ ∶= ∞. As bν the ν/τ-quantile of the empirical distribution of RASA-values for non-interface residues such that RASA(i, y) ∈ [b0 , b τ ] are chosen. For each node i ∈ χ, 2τ feature functions are defined that are linked to the protein property RASA by the formula f i,ν,ξ (X i , y) = 1{X i = ξ, RASA(i, y) ∈ [bν , bν+1 )}
(ν = 0, 1, . . . , τ − 1). (2.6)
Based on this binning technique, further node features classes are easily integrated. The score of a labeling ξ is defined as the sum of all potentials: E y (ξ, w) = ∑ fi (X i , y) + ∑ f{i, j} (X i , X j ). {i, j}∈K
i∈χ
(2.7)
Using Equation (2.4), the score of ξ can then also be written as E y (ξ, w) = wT f(ξ, y). 14
(2.8)
CHAPTER 2. INTERFACE SITE PREDICTION USING CONDITIONAL RANDOM FIELDS Based on the scores for any labeling ξ ∈ Ln we define the conditional log-linear distribution 1 e E y (ξ,w) , (2.9) P(X = ξ ∣ y) = Z(y) which we call the conditional random field with respect to the graph H(χ, K). Since H only contains nodes and edge, the CRF is called pairwise. Pairwise CRFs keep the computational burden manageable but the reader is referred to Section 3.1.5 for a general treatment of models that have not this restriction. In Equation (2.9), Z(y) is the data-dependent normalization constant – which is called partition sum – defined by ′
Z(y) = ∑ e E y (ξ ,w) , ξ′ ∈L n
(2.10)
and that is required to assign a probability to each labeling ξ of nodes in χ. The proposed pairwise CRF-model accounts for the observation that the correlation between labels along the protein chain is only slightly higher compared to the correlation of residue labels in spatial proximity. This is consistent with the observation that amino acids, constituting the interface, are spatially close to each other, or form clusters. So it is reasonable explicitly incorporating this information into the algorithmic structure. In this chapter the node feature functions are discussed that were computed using the atomic description of the proteins or the sequences of the amino acids. The node features capture e.g. the local geometry of the protein or the spatial arrangement of the biochemical components and were either extracted using available software packages or, in some cases, were prepared by other researches and only incorporated in the present work. In either case, the features are calculated given raw values of protein properties which are reasonably considered to carry useful information to locate the binding sites of the protein that constitute the interface between the interacting protein partners. Nevertheless, the usage of each certain node feature remains a working hypothesis whose value for the present work shall carefully evaluated within intensive experiments. To make the applicability of each feature useful, these were computed in monomer form which is the application targeted by the present work.
15
2.2. CHANGE IN FREE ENERGY (∆F)
2.2
Change in free energy (∆F)
The molecular interactions of a protein are characterized by the free energy. These interactions strongly depend on the spatial arrangement of the atoms and the respective residue types within the protein complex. Let P(c) ∝ e Ic denote the probability of a certain molecular configuration c of a given protein. Let the internal energy of c be Ic . According to Yedidia et al. (Yedidia, Freeman, and Weiss 2005), the free energy F is defined as F = H + S, the sum of the protein enthalpy H and its entropy S at fixed temperature. The enthalpy of the protein is the expected internal energy H = ∑ P(c) ⋅ Ic . c∈C
On the other hand, the entropy is defined as the negative expected ln-probability summed over each complex configuration S = − ∑ P(c) ⋅ ln P(c) c∈C
at a fixed temperature. The following algebraic manipulation yields the form F = ln Z: H + S = ∑ P(c) ⋅ Ic − ∑ P(c) ⋅ ln P(c) c∈C
c∈C
= ∑ P(c) ⋅ Ic − ∑ P(c) ⋅ {Ic − ln Z} c∈C
c∈C
= ∑ P(c) ⋅ Ic − ∑ P(c) ⋅ Ic + ∑ P(c) ⋅ ln Z c∈C
c∈C
c∈C
= ln Z ⋅ ∑ P(c) c∈C
H + S = ln Z Here, Z is the normalization constant that is required to assign a probability to c and is defined as Z = ∑ e Ic . c∈C
Generally, the exact computation of Z is intractable. However, the software package Rosetta (and the many derivatives thereof) published by Rohl et al. (Rohl et al. 2004) deploys among others Belief Propagation yielding reasonable estimates of
16
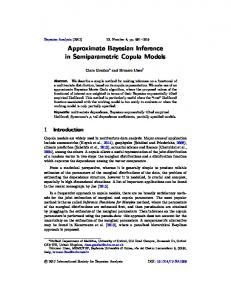
CHAPTER 2. INTERFACE SITE PREDICTION USING CONDITIONAL RANDOM FIELDS the free energy. According to (Kortemme and Baker 2002), the binding free energy of two proteins A and B can be written as ∆FAB = FAB − (FA + FB ). Our idea to use the change in free energy as a new class of node feature functions originates from this equation. Since stable protein complexes are considered to have low binding free energies, we argue that an artificial perturbation of the original protein structure might cause an informative change in free energy. In order to show this effect, we conduct the following procedure using the protein list PlaneDoriginal imers1 (Zellner et al. 2011). Let FA denote the free energy of the unbounded i structure A. Further, let FA (t) be the free energy of A wherein the node i is in silico assigned to a new amino acid t. The change in free energy is then deduced according to the equation i i ∆FA = max ( FA (t) − FA
original
t
)
in which the maximization varies over the remaining 19 amino acids for each amino acid (or node) i of the considered protein. The probabilities of ∆F-values at noninterface residues are plotted against the respective probabilities at interface residues in Figure 2.1. 1
This data set is publicly available at http://www-bioinf.uni-regensburg.de.
17
2.2. CHANGE IN FREE ENERGY (∆F)
0.6
Change in free energy
0.3 0 0. 04 7 0. 09 4 0. 14 1 0. 18 8 0. 23 4 0. 28 9 0. 34 0. 38 7 0. 43 4 0. 48 0. 52 7 0. 57 4 0. 62 1 0. 66 8 0. 71 5 0. 76 6 0. 81 6 0. 87 5 0. 94 5
0.0
0.1
0.2
probability
0.4
0.5
interface non−interface
∆F
Figure 2.1: Probabilities of ∆F-values at non-interface residues plotted against the probabilities at interface residues using the protein set PlaneDimers. The postulated effect can be seen in the interval ∆F ∈ [0.047, 0.094) and further explained in Section 4.1.2. In this interval only 7% of non-interface residues cause the respective change in free energy in comparison to 20% of interface residues. Thus, the change in free energy is higher for interface residues compared to noninterfaces. In contrast to this, at least 54% of the non-interfaces and 32% of the interfaces do not show any remarkable change in free energy. This in silico manipulation of proteins is a known approach as benchmark test for software packages in order to evaluate the accuracy of the free energy estimation for protein complexes (Lu et al. 2001). As opposed to these benchmarks we compute the ∆F-values for the unbounded structures only. For this feature class the number of bins is heuristically set to 20 for each label.
18
CHAPTER 2. INTERFACE SITE PREDICTION USING CONDITIONAL RANDOM FIELDS
2.3
Relative solvent-accessible surface area (RASA)
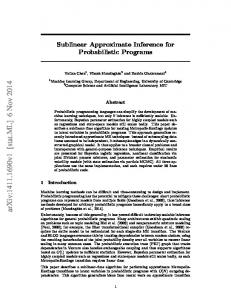
The idea of using the solvent-accessible surface area as a node feature within a CRF is based on the observation, that a residue with a high accessibility to surrounding solvents – e.g. hydrogen molecules – can be a candidate for being a binding site since it is localized at the protein surface. Equivalently, if it has a low accessible surface given a fixed protein compound, it might be buried inside the structure, and thus, does not come into question being part of the interface. Nevertheless, this approach takes certain residue configurations that can frequently be seen in protein-protein interaction scenarios not into account. To name just a few of these exceptions, consider buried residues which are at the bottom of surface caves. The caves can exhibit openings being to small to be completely packed with a hydrogen molecule, but allow e.g. the unhindered exchange of electrons between communicating protein partners. So, these residues can be part of the interface, though they would not being called binding sites. Another prominent example that cannot be captured by the present feature is the following. Consider residues that firstly become accessible to the surrounding in the presence of the partner protein since this initially provokes a certain geometrical change of their surfaces, and what then allows the shaping of an interacting complex. Furthermore and even harder to detect are so-called allosteric interactions where proteins use different interface residues depending on biological functionality. The node feature function RASA is defined as follows. Based on its spatial neighborhood in the 3D protein structure, for each node i the solvent accessible surface area SAS(i) was calculated using software library BALL (Hildebrandt et al. 2010). The deduced SAS-value is normalized with SAS-max(i), the maximum possible SAS of the observed type of amino acid at position i. Thus, given fix data y the RASA value at node i is defined as SAS(i) RASA(i, y) = SAS-max(i) having the range RASA(i, y) ∈ [0, 1] ⊆ R. for each node i. To make the applicability of the RASA values fbfbat all useful, these were computed in monomer form which is the application targeted by the present work. The value distribution estimated from the Keskin list 2 is plotted in 2
Keskin et al. 2004.
19
2.3. RELATIVE SOLVENT-ACCESSIBLE SURFACE AREA (RASA) Figure 2.2. In the proposed model the RASA feature class is modeled with τ = 32
0.20
relative accessible surface area
0.10 2. 7 5. 34 8 8. 59 12 98 4 . 15 10 9 18.23 4 21.35 9 24.48 4 27.60 9 30.73 4 33.85 9 37.98 4 40.10 9 43.23 4 46.35 9 49.48 4 52.60 9 55.73 4 58.85 9 . 62 98 4 65.10 9 68.23 4 71.35 9 74.48 4 77.60 9 80.73 4 83.85 9 87.98 4 90.10 9 93.23 4 96.35 9 99.48 .6 4 09
0.00
0.05
probability
0.15
interface non−interface
RASA
Figure 2.2: Probabilities of RASA-values at non-interface residues plotted against the probabilities at interface residues estimated from the Keskin list. bins for each label as defined in Equations (2.3a) and(2.6). In early approaches, the RASA values were calculated by rolling a 3D-sphere with diameter of a hydrogen molecule over the protein’s surface (Figure 2.3) and labeling stepwise in that way each residue as being in touch with this sphere or not. Afterward, each residue in the protein gets its RASA value assigned by averaging over the number of tracked contacts in which the maximal size of each residue type is taken into account. The maximal values in Table 2.1 published by Zellner et al. (Zellner et al. 2011) are used in the implementation although other specifications are possible.
20
CHAPTER 2. INTERFACE SITE PREDICTION USING CONDITIONAL RANDOM FIELDS
Figure 2.3: Computing RASA values, Callenberg (2010). The pictured van der Waals surface is the abstract surface of the union of spherical atom surfaces defined by the so-called van der Waals radius of each atom in the molecule.
amino acid SAS-max ALA 113 CYS 140 THR 146 ASN 158 LEU 180 GLU 183 HIS 194 LYS 211 TYR 229 TRP 259
Amino acid SAS-max GLY 85.0 SER 122 PRO 143 ASP 151 VAL 168 ILE 182 GLN 189 MET 204 PHE 218 ARG 241
Table 2.1: Absolute values of surface areas for each amino acid used throughout the experiments (Zellner et al. 2011). However, varying these values as e.g. according to Miller (Miller 1989) showed no remarkable changes in the obtained results of our experiments. Nowadays, among other methods the RASA values are computed based on a Voronoi diagram of the 3D protein structure (Klenin et al. 2011). 21
2.4. FEATURE “REGENSBURG” (RG)
2.4
Feature “Regensburg” (rg)
The node feature class “Regensburg” was proposed by Zellner et al. (Zellner et al. 2011). The feature range is rg(i, y) ∈ [0, 1] ⊆ R for each amino acid i given fixed protein data y. A plot of the value distribution is given in Figure 2.4.
0.35
PresCont property (flat surfaces)
0.20 0.15
98
90 8
0.
83 6
0.
76 4
0.
0.
62
69 2 0.
54 8
0.
47 6
0.
40 4
0.
0.
26
33 2 0.
18 8
0.
11 6
0.
04 4
0.
0.
.0 −0
−0
.1
28
0.00
0.05
0.10
probability
0.25
0.30
interface non−interface
rg
Figure 2.4: Distributions of rg values. The bin corresponding to rg ∈ [−0.1, −0.028) for non-interfaces and the bin for the interval rg ∈ [0.764, 0.836) for interfaces contain probability peaks. This gave rise to the idea of Zellner et al. using a straightforward threshold strategy to put the residues into the classes {N , I}. This protein property is the basis for the support-vector-machine (SVN) method of Zellner et al. called PresCont and represents the following posterior probability rg(i, y) ∶= P(X i = I ∣ y) where the label I for interface residue is meant. The values were “deduced from the distance between the feature set of i and the hyperplane separating surface (residues 22
CHAPTER 2. INTERFACE SITE PREDICTION USING CONDITIONAL RANDOM FIELDS labeled N ) and interface residues (residues labeled I) in feature space” 3 . The following residue oriented protein properties were incorporated into the feature rg: 1. RASA values as defined in Section 2.3 2. QUITE scores4 that determine hydrophobic patches on the protein surface and whose computation is based on RASA values but now accounting for small groups of neighboring residues and their group like accessibility to water rather than a residue alone 3. conservation scores from multiple sequence alignments 4. scores derived directly from frequencies of amino acid type combinations within a local neighborhood where the size of the neighborhood is trained, that is the distance between residues having the same label Each feature function is normalized to the interval [0, 1] ⊆ R after averaging the values over small geometrical neighborhoods. The distance cut-off, that is the distance between residues which then defines the neighborhood between residues, was determined by stepwise varying, in order to increase the prediction result on a given training set. Similar experiments were conducted by the author but with less success. The usage of conservation values showed no improvement of the prediction performance in experiments since values from the HSSP database are publicly available and were tested5 . Further, combinations of amino acid types in different geometrical configurations were tried to be exploited but showed no significant improvement (data not shown). As a similar example, consider Figure 2.5 that shows results of the following ˚ the pairwise distance distributions between experiment. Within a distance of 15A residues in the interface (red) and outside of the interface (green) were plotted. The data was estimated from the Keskin list. As it can be deduced from the plot, geometrically there is almost no difference perceivable between these two structural neighborhoods, i.e. from a statistical-geometry-point-of-view the protein “looks almost the same” whatever the labeling is of a considered region within a given distance. 3
Zellner et al. page 12, preprint version; author comments in brackets Lijnzaad, Berendsen, and Argos 1996. 5 http://swift.cmbi.ru.nl/gv/hssp/
4
23
2.4. FEATURE “REGENSBURG” (RG)
0.20
distance distributions
0.10
20
19
18
16 17
15
13 14
12
9 10 11
8
7
5
6
3
4
2
0
1
0.00
0.05
probability
0.15
interface non−interface
distance [100 pm]
Figure 2.5: Distance distributions between pairs of residues having the same label in the reference labelings, estimated from proteins of the Keskin list within a fixed ˚ distance of 15A. The same picture shows up if at different distances the amino acid type frequencies are plotted (data not shown). Almost no significant signal can be visually extracted.
24
Chapter 3 Inference Inference is crucial for the prediction of protein-protein interaction interface sites, which is true for other prediction problems modeled by conditional random fields (CRF). However, since we can not expect for every CRF-structure to be able to efficiently compute an exact solution (for general complexity considerations of the labeling problem specified as a CRF see Section 3.3), problem subsets allowing such a solution are interesting on its own. Therefore, several fast prediction algorithms for specially structured labeling problems given as a CRF together with their application cases are described in the following.
3.1
Exact inference of labeling problems
If otherwise not stated, a mapping i ↦ X i from nodes of a graph H(χ, K) to variables X = (X i )ni=1 is meant where χ = {1, 2, . . . , n}. However, the reader is referred to Section 2.1 for the complete set of terms and definitions that are utilized for the description of a CRF.
3.1.1
Tractable partition sum for a restricted labeling class
In this section, a novel and unpublished idea is specified for the computation of the partition sum Z at the two-dimensional lattice that uses the so-called transfermatrix method introduced by Baxter (Baxter 1982). So far, the algorithm has no direct application in the area of bioinformatics, but it may become helpful for predicting interface residues of protein-protein interactions if e.g. particular feature functions as described in Section 2.2 are further developed or if mappings of inter25
3.1. EXACT INFERENCE OF LABELING PROBLEMS esting protein parts into the plane are considered. Let the label set L = { , } be given, where the coloured notation is used to facilitate understanding. Let a (b × b) grid graph H(χ, K) be given with n = b 2 and WLOG b even. For H a transfer-matrix M is constructed by using the following steps: 1. Let us consider the kth partial structure of H with width b defined by Figure 3.1. An entry of a matrix Mk is defined as the product ωsk ⋅ s Υ k+1 t such that ωsk ∶= E y (ξs , w) is a score defined according to Equation (2.7) but k k only for a chain labeling ξs ∈ Lb . ξs is assigned to the (k) chain of nodes χ k ⊂ χ with ∣χ k ∣ = b. k
The factor s Υ k+1 is defined as the sum of labeling scores at the (k + 1) chain t k χ k+1 ⊂ χ depending on fixed labeling ξs ∈ Lb at chain (k), and on fixed k+2 labeling ξ t ∈ Lb at the (k + 2) chain χ k+2 ⊂ χ. Again, ∣χ k+1 ∣ = ∣χ k+2 ∣ = b. k
k+2
The dependency on labelings ξs , ξ t is further specified here:
is indicated by subscripts s and t and
k+2
ω k+2 t
k+1
k+1 s Υt
ωsk
k
Figure 3.1: Definition of matrix Mk for the kth partial structure with width b of the b × b grid H(χ, K). The symbols ωsk , ω k+2 denote fixed scores of two labelings t of chains χ k , χ k+2 . The sum of labeling scores assigned to the (k + 1) chain χ k+1 is denoted by s Υ tk+1 . In Figure 3.1 the symbols vertices for summation and vertices with fixed labels
26
CHAPTER 3. INFERENCE are used. Using R = ∣L∣ , a matrix Mk for the kth partial structure of Figure 3.1 is defined by b
k+1 k ω1k ⋅ 1 Υ2k+1 ⎛ ω1 ⋅ 1 Υ1 ⎜ ω k ⋅ Υ k+1 ω k ⋅ Υ k+1 2 1 2 2 2 Mk ∶= ⎜ ⎜ 2 ⎜ ... ... ⎝ω k ⋅ R Υ k+1 ω k ⋅ R Υ k+1 1 2 R R
ω1k ⋅ 1 Υ Rk+1 ⎞ . . . ω2k ⋅ 2 Υ Rk+1 ⎟ ⎟. ⎟ ⎟ ... k+1 ⎠ k . . . ωR ⋅ R ΥR ...
(3.1)
Refraining from vertical edge potentials in the grid H, it is apparent that the k score ωsk of labeling ξs at chain nodes χ k is constant concerning the sumk mation s Υ k+1 t . That is, the score ω s is independent of the sum of labeling k+1 scores s Υ t at the (k + 1) chain, apart from vertical edge potentials connecting chains (k) and (k + 1). 2. Vertical edge potentials between the chain labelings are rearranged according to Figure 3.2. Here, a fixed label ξ c at node c ∈ χ k in the lower chain is assumed. b
fb (Xb , y)
b
fb (Xb , y) + f{b,c} (Xb , ξ c )
f{b,c} (Xb , X c ) c
c
Figure 3.2: Reassignment of vertical edge potentials because of the independence of the edge potential f{b,c} (Xb , X c ) given a fixed label X c = ξ c
This reassignment does not change the distribution P according to Equation (2.9). However, it changes each node potential in the sum s Υ tk+1 . In order to explicitly indicate this dependency on fixed labelings at parallel grid chains, the subscripts s and t are included in the notation. 3. It is generally known, that partition sums for labeling problems defined on chains are computed in linear time in the chain size. It is clear, that after applying the so far stated manipulations the factors s Υ kt are particularly these partition chain sums, for each k and size b.
27
3.1. EXACT INFERENCE OF LABELING PROBLEMS 4. Assume a grid consisting of b/2 components according to Figure 3.1. The transfer-matrix approach computes the partition sum according to the equations M ∶= M1 ⊙ M3 ⋅ ⋅ ⋅ ⊙ Mb−1 ´¹¹ ¹ ¹ ¹ ¹ ¹ ¹ ¹ ¹ ¹ ¹ ¹ ¹ ¹ ¹ ¹ ¹ ¹ ¹ ¹ ¹ ¹ ¹ ¹ ¹ ¹ ¹ ¹ ¸¹ ¹ ¹ ¹ ¹ ¹ ¹ ¹ ¹ ¹ ¹ ¹ ¹ ¹ ¹ ¹ ¹ ¹ ¹ ¹ ¹ ¹ ¹ ¹ ¹ ¹ ¹ ¹ ¹ ¶ b/2 times
Z = e tr(M) where tr denotes matrix trace, ⊙ matrix multiplication, and b is even as assumed. M is referred to as transfer-matrix of the problem where M has size (R × R). Thus, the above formulas compute Z using basic matrix operations. 5. However, the size of M still prevents the specification of a polynomial algorithm caused by the exponential number R of chain labelings in H. To reduce R, the idea is to bound the dimension of M by restricting the labelings on each second chain to a predefined subset: at every second grid chain only labelings constituting a “ -connected component” (convex chain labelings) are permitted. This restriction plays a meaningful role in protein-protein interface predictions where connected surface patches are expected to contain the interface residues. k
ξ1
k
ξ2
...
...
k ξb k
ξb+1 k
ξb+2
...
k ξ R′
Figure 3.3: Permitted chain labelings of step 5. Figure 3.3 shows examples of permitted chain labelings for some chain (k). The number of these chain labelings is b ⋅ (b + 1) , 2 bounding the size of M, or equivalently the number of matrix entries based on labeling scores to O(n2 ). R′ ∶=
28
CHAPTER 3. INFERENCE It is now valid to establish the following theorem: Theorem 1. WLOG let b be even, such that n = b 2 where n is the number of nodes in a (b × b) grid graph H(χ, K). The partition sum Z of H with restricted chain labelings in accordance with steps 1.-5. is computed in time complexity O(n6 ). Proof. Confirm steps 1. − 5. above. The involved matrix multiplication can efficiently be implemented. That is, the naive factor O(n3 ), which accounts for the complexity of one required matrix multiplication, is currently improved by a fast algorithm up to O(n2.37 ) (Ambainis, Filmus, and Gall 2014). The shown approach can generally be utilized (Baxter 1982): Corollary 1. The transfer-matrix method can be applied if the underlying problem can regularly be divided into subproblems permitting exact computations of their respective partition sums provided these subproblems can be separated by fixing appropriate labelings as e.g. shown in step 5 above. Instances for this corollary are problems with bounded tree-width or seriesparallel graphs (proof not shown).
3.1.2
Tractable partition sums for complete graphs
In this section, another approach taken from (Flach 2013) is presented to exactly compute the partition sum at a complete graph H(χ, K) requiring equal functions at edges. The method assumes a distribution P according to (2.9) on binary labelings, i.e. the label set is L = {0, 1}. Edge functions are restricted to a common mapping defined (for this section) by Φ{i, j} = α ⋅ 1{X i ≠ X j } + 1{X i = X j }
{i, j} ∈ K, (i < j), α > 0
(3.2)
where the notation from Equation (2.5) is used. Using an appropriate manipulation, it is valid to initially write arbitrary node functions as Φ i (X i , y) = β i ⋅ 1{X i = 0} + 1{X i = 1}
i ∈ χ, β i > 0
(3.3)
without changing the probability distribution P and β i denotes a node dependent positive real number.
29
3.1. EXACT INFERENCE OF LABELING PROBLEMS The set of all labelings ξ = {0, 1}n of nodes in χ is divided into pairwise disjoint (0) (n) (k) subsets ξ , . . . , ξ ⊂ ξ such that ξ denotes the set ξ
(k)
n
= {(ξ1 , . . . , ξ n ) ∈ ξ ∣ ∑ ξ i = k} i=1
using ξ i ∈ {0, 1} and χ = {1, . . . , n}. Thus, partial partition sums can be stated accordingly Z k (y) =
∑
(ξ 1 ,...,ξ n )∈ξ
(k)
∏ Ψ i (X i , y) ⋅ ∏ Φ{i, j} (X i , X j ). {i, j}∈K
i∈χ
(3.4)
Using the assumption of equal edge functions according to Equation (3.2) and the fact that each subgraph of a completely connected graph is again completely connected, in (3.4) the product over pairwise edge functions is simplified to a common factor α k⋅(n−k) for every labeling in Z k (y). On the basis of Equation (3.3), for the contribution of node functions to Equation (3.4) the following numbers are introduced n H{1,...,n} (k) =
∑
(ξ 1 ,...,ξ n )∈ξ
∏ βi
1−ξ i
(k)
.
(3.5)
i=1
Hence, the partition sum can be written as follows n
n
k=0
k=0
Z(y) = ∑ Z k (y) = ∑ α k⋅(n−k) ⋅ H{1,...,n} (k). The function in (3.5) can be calculated recursively using again the inheritance of the completeness property of a graph to its subgraphs. To see this, the notation HU (k), k ∈ {1, . . . , ∣U∣} is used where U ⊆ χ is a complete subgraph induced by the node subset U. For some fixed node m ∈ χ the recurrence equation HU (k) = β m ⋅ HU∖{m} (k) + HU∖{m} (k − 1)
(3.6)
is valid and provides an algorithm that computes Z(y) on complete graphs in time complexity O(n2 ). The recurrence in (3.6) is further utilized to calculate posterior probabilities at each node in the graph. The numbers HU∖m (k) =
1 ⋅ {HU (k) − HU∖m (k − 1)} βm 30
(3.7)
CHAPTER 3. INFERENCE can be calculated in linear time from all numbers of the initially fully connected graph. Using (3.7) the posterior probabilities for node m are given by P(X m = 1 ∣ y) = ∑nk=1 H{1,...,n}∖{m} (k − 1) ⋅ α k⋅(n−k) , k⋅(n−k) P(X m = 0 ∣ y) = ∑n−1 k=0 H {1,...,n}∖{m} (k) ⋅ α which can be computed in quadratic time complexity depending on the size of the underlying graph (proof not shown).
3.1.3
Decidability of the maximum marginal probability problem
In this section an algorithm for the decidability of the problem of the maximum marginal probability for general graphs and binary labelings is presented. The method can easily be extended to larger sets of labels. The author of the thesis originally conceived the algorithm, but the basic idea was already known1 and published as the dead-end elimination (DEE) algorithm (Desmet et al. 1992). 1
Mario Stanke, personal communication, January 6, 2012
4 5
3
r
2 s
6
Figure 3.4: Neighborhood of the node r in graph H(χ, K). The partition sum is over each random variable associated to green nodes but not r itself and keeping the label at s fixed. Hence, potentials of r and {r, s} are not considered.
31
3.1. EXACT INFERENCE OF LABELING PROBLEMS Definition (Decidability of the maximum marginal probability problem). According to Equation (2.9), let a CRF be defined with respect to a graph H(χ, K). The problem of the maximum marginal probability is to find label ξ∗i at each node i such that the marginal probability of labels is maximum at ξ∗i : ξ∗i = argmax P(X i = ξ ∣ y)
i ∈ χ.
(3.8)
ξ∈L
Let the label set L = {I, N } be given. At each edge a potential is defined as f{i, j} (X i , X j ) = α ⋅ 1{X i = X j } + β ⋅ 1{X i ≠ X j }, with α, β ∈ R. Let Z(χ, K) denote the partition sum of the graph H(χ, K). Assume two distinct nodes r, s ∈ χ, {r, s} ∈ K, s ∈ Γ(r) (Section 2.1) and ∣Γ(r)∣ = 1 (Figure 3.4). With the symbol Z(X ∖{Γr ∪r} , ξs ) we denote the partition sum over all nodes in χ but not r itself and each labeling in the partition sum has label ξs ∈ L at s in common. Using this, it is valid to write for the example in Figure 3.4 ∑ Z(X ∖{Γr ∪r} , ξs ) = Z(χ ∖ {r}, K ∖ {{r, s}})
ξ s ∈L
with
{r, s} ∈ K ∀K′
Z(∅, K′ ) = 0
i.e. the partition sum of the subgraph H′ (χ ∖ {r}, K ∖ {{r, s}}) is computed using the introduced concepts. According to Equation (2.5), let the functions Ψ i (X i , y), Φ{i, j} be given. Let the decidability concept as defined here be identified with the prediction of proteinprotein interaction interface sites. The following is proposed: Theorem 2. A solution to the optimization problem in Equation (3.8) is computable in linear time in size of the graph H(χ, K). Proof. 1: Consider the case α > β. By induction on the number of edges of node r, i.e. ∣Γ(r)∣, the inequality P(Xr = I ∣ y) < P(Xr = N ∣ y)
(3.9)
is examined. It is clear, that the decidability of Inequality (3.9) is equivalent to the optimization in Equation (3.8). At first, consider the case ∣Γ(r)∣ = 1 as in Figure 3.4. It is valid to write Ψr (I, y) ⋅ e α ⋅ Z(X ∖{Γr ∪r} , I) + Ψr (I, y)⋅ e β ⋅ Z(X ∖{Γr ∪r} , N ) < Ψr (N , y) ⋅ e β ⋅ Z(X ∖{Γr ∪r} , I) + Ψr (N , y) ⋅ e α ⋅ Z(X ∖{Γr ∪r} , N ) . ´¹¹ ¹ ¹ ¹ ¹ ¹ ¹ ¹ ¹ ¹ ¹ ¹ ¹ ¹ ¹ ¹ ¸ ¹ ¹ ¹ ¹ ¹ ¹ ¹ ¹ ¹ ¹ ¹ ¹ ¹ ¹ ¹ ¹ ¹ ¶ ´¹¹ ¹ ¹ ¹ ¹ ¹ ¹ ¹ ¹ ¹ ¹ ¹ ¹ ¹ ¹ ¹ ¹ ¹ ¸¹¹ ¹ ¹ ¹ ¹ ¹ ¹ ¹ ¹ ¹ ¹ ¹ ¹ ¹ ¹ ¹ ¹ ¹ ¶ x1
x2
32
CHAPTER 3. INFERENCE
4 5
3
r
2 s
6
Figure 3.5: General neighborhood of node r in graph H(χ, K). As indicated by the variables x1 , x2 , the inequality above can be considered as the comparison of two hyperplanes in two-dimensional space. Thus, Inequality (3.9) holds if the inequalities x1 ∶
Ψr (I, y) ⋅ e α < Ψr (N , y) ⋅ e β
x2 ∶
Ψr (I, y) ⋅ e β < Ψr (N , y) ⋅ e α
are simultaneously fulfilled which happens if the node potentials satisfies the following Ψr (I, y) < min{e α−β , e β−α }. Ψr (N , y) With the requirement α > β and using the definition of Ψ in (2.5), it is valid to write fr (I, y) − fr (N , y) < β − α. Further, by induction on the number of edges, it can be concluded for ∣Γ(r) > 1∣ edges incident to node r (see Figure 3.5): fr (I, y) − fr (N , y) < ∣Γ(r)∣ ⋅ (β − α). 2: The case β > α is equivalently shown. 3: The trivial case α = β makes the decision independent from edge potentials. Hence, a simple constant-time-checkable condition for each node is derived and Theorem 2 follows. 33
3.1. EXACT INFERENCE OF LABELING PROBLEMS
3.1.4
The relaxation labeling algorithm
One of the first papers treating labelings is Rosenfeld et al. (Rosenfeld, Hummel, and Zucker 1976). The authors considered another formulation of the labeling problem where each variable X i associated with nodes of the underlying graph G(V , E) can be assigned a subset of a label set, Λ = {λ1 , . . . , λ m }. The feature functions are defined as boolean in terms of these variables. It is further supposed, that for each node i ∈ V a subset of compatible (allowed) labels from Λ is given, Λ i ⊆ Λ. Further, at each edge {i, j} ∈ E, (i < j) a subset of compatible pairs of labels is defined, Λ{i, j} ⊆ Λ i × Λ j . This relation is understood to be symmetric, i.e. Λ{i, j} = Λ{ j,i} . By a labeling L = (L i )ni=1 an assignment of subsets of labels to each variable is meant. That is for each node i ∈ V a subset of labels L i ⊆ Λ is assigned to the associated variable X i . Define L{i, j} ∶= L i × L j and X{i, j} ∶= X i × X j for each edge {i, j} ∈ E, (i < j). The feature functions2 are formalized accordingly fi (X i ) = 1{X i = L i , L i ⊆ Λ i } f{i, j} (X i , X j ) = 1{X{i, j} = L{i, j} , L{i, j} ⊆ Λ{i, j} }
i∈V
(3.10a)
{i, j} ∈ E, (i < j).
(3.10b)
Furthermore, union, intersection and containment of two labelings L, L′ are defined with the help of the common set operations but applied componentwise, that is the union L ∪ L′ is defined as (L i ∪ L′i )ni=1 , the intersection L ∩ L′ as (L i ∩ L′i )ni=1 and containment L ⊆ L′ is understood as (L i ⊆ L′i )ni=1 . The main concepts introduced by the authors is the notion of consistency of a labeling L with respect to the graph structure G(V , E) and the feature functions. This notion is defined as the requirement to compute the value accordingly ⋁
(λ 1 ,...,λ n )∈Λ n
[ ⋀ fi (λ i ) ∧ ⋀ f{i, j} (λ i , λ j ) ]. {i, j}∈E
i∈V
(3.11)
Furthermore, if Equation (3.11) yields 1, then such a labeling L∗ = (λ∗1 , . . . , λ∗n ) shall be computed which fulfills the following condition [ ⋀ fi (λ∗i ) ∧ ⋀ f{i, j} (λ∗i , λ∗j ) ] = 1. i∈V
{i, j}∈E
(3.12)
This is called the Consistent labeling problem. 2
See Section 3.1.5 for further explanations and a general study of the problem where even higher arity feature functions are involved.
34
CHAPTER 3. INFERENCE To solve it, the authors propose the relaxation labeling algorithm. It works iteratively. Initially, there is the trivial labeling L0 = (Λ i )ni=1 such that for each i ∈ V the set of labels at i is compatible according to the node feature in Equation (3.10a). Let Lt be the resulting labeling of the tth step of the algorithm. To get the labeling Lt+1 , any label λ ∈ Λ at node i is kept if and only if it is compatible to constraints along each existing edge {i, j} according to Equation (3.10b). This is summarized by the equations t L t+1 i ∶= L i ∩ ⋂ ( {i, j}∈E
⋃
(λ, µ)∈L t {i , j} Lt ⊆Λ {i , j} {i , j}
{λ})
t+1 t+1 t+1 t L{i, j} ∶= L i × L j ∩ L{i, j}
i∈V
(3.13a)
{i, j} ∈ E, (i < j).
(3.13b)
The following propositions concerning this algorithmic schema are proved in the cited paper. Proposition There is a most comprehensive consistent labeling L∞ such that for any consistent labeling L it holds that L ⊆ L∞ . Proposition Lt+1 ⊆ Lt for t = 0, 1, 2, . . . i.e. the cardinality of each set L ti is never increasing. Proposition L∞ ⊆ . . . Lt+1 ⊆ Lt ⊆ ⋅ ⋅ ⋅ ⊆ L0 . With the help of these propositions, the authors conclude the following. Theorem If the underlying graph structure is connected, then there exists some t such that Lt+1 = Lt and the labeling Lt fulfills Equation (3.12). This theorem and the above mentioned propositions should guarantee that the algorithm described by Equations (3.13a,3.13b) converges and outputs a consistent labeling L. However, as Flach (Flach 2002) points out, it is not at clear if the relaxation labeling algorithm is able to deliver such a labeling in any case since it can generally be shown that the consistent labeling problem is N P-complete (confirm Section 3.3.2).
35
3.1. EXACT INFERENCE OF LABELING PROBLEMS Nevertheless, Schlesinger et al. (Schlesinger and Flach 2000) show that the relaxation labeling algorithm finds a consistent labeling if and only if the edge feature functions according to Equation (3.10b) fulfill the following property. Let the set of labels from Λ be partially ordered that is, let for any 4-tuple of labels λ i , λ j , λ k , λ l ∈ Λ be that λ i ≥ λ j and λ k ≥ λ l . The relaxation labeling algorithm calculates an consistent labeling if and only if f{i, j} (λ j , λ k ) ∧ f{i, j} (λ i , λ l ) ≤ f{i, j} (λ i , λ k ) ∧ f{i, j} (λ j , λ l )
3.1.5
{i, j} ∈ E.
Mapping n-ary feature functions
In this section, the question is answered whether the restriction to feature functions with at most two arguments – and that lead in its generality to the usage of pairwise CRFs as introduced in Section 2.1 – represents a limitation to the modeling strength and the variety of labelings that can be described by the model of Section 3.1.4. It is shown here, that this is not the case at least in the exemplified case of boolean feature functions. This is proved by giving a mapping from any nary feature function of binary variables to a set of 2-ary and 1-ary feature functions of binary variables. This mapping is according to Flach (Flach 2002). Let binary variables Γ = (Yt )m t=1 be given where each Yi takes values from L = {0, 1}. Let feature functions f i on an arbitrary set of k-tuples (1 ≤ k ≤ m) of variables from Γ be defined. Let this set of k-tuples be U = {S1 , S2 , . . . , S n } and define for every 1 ≤ i ≤ n f i ∶ S i ↦ {0, 1}. A labeling ρ = (ρ1 , ρ2 , . . . , ρ n ) of the tuples in U with variables from Γ is said to be consistent if and only if ⋀
ρ i ∶1≤i≤n
f i (ρ i ) = 1.
(3.14)
This definition of consistency is taken from Rosenfeld et al. (Rosenfeld, Hummel, and Zucker 1976). Now, a graph H(χ, K) is constructed as basis structure for a labeling problem that only contains 2-ary and 1-ary feature functions and which can then be regarded as a pairwise model. So, for each tuple S i there is a corresponding node i ∈ χ and an edge {i, j}, (i < j) is included in K if and only if S i ∩ S j ≠ ∅ which means that 36
CHAPTER 3. INFERENCE tuples S i and S j have variables from Γ in common. Further, binary variables (X i )ni=1 are assumed corresponding to nodes of χ according to the mapping i ↦ X i . The following new feature functions are defined: fi (X i ) = 1{ f i (ρ i ) = 1} f{i, j} (X i , X j ) = 1{ f i (ρ i ∣U{i , j} ) = 1, f j (ρ j ∣U{i , j} ) = 1}
1≤i≤n {i, j} ∈ K, U{i, j} = S i ∩ S j ,
such that ρ = (ρ1 , ρ2 , . . . , ρ n ) is a labeling of the original problem. The notation f i (ρ i ∣U{i , j} ) indicates the restriction of the original feature function f i to the subset U{i, j} of variables in S i ∩ S j being labeled with ρ i . ∗ It can be observed, that the best labeling ξ ∈ Ln of χ given according to the following optimization problem ξ∗ = argmax ∑ fi (ξ i ) + ∑ f{i, j} (ξ i , ξ j ) ξ∈Ln
{i, j}∈K
i∈χ
corresponds to a consistent labeling of U that satisfies Equation (3.14). The value of ∗ ξ is then n + ∣K∣. The shown mapping is computable in polynomial time in size of the original problem if the cardinality of U and the arity of the original feature functions are bounded.
3.1.6
The application of MinCut algorithms
The motivation to describe a class of labeling problems specified by CRFs which can be solved by so-called MinCut algorithms arose from the observation, that automatically trained3 edge weights wK according to Equation (2.4) always fulfilled a condition which characterizes that certain class of labeling problems. Hence, the trained edge weights structured the CRFs as amenable to certain fast algorithms solving the associated labeling problem and thus, accomplishing efficient inference. Throughout this work, tied edge features are used according to Equation (2.2). Furthermore, two edge weights are only specified in the implementation to represent the edge potential according to Equation (2.3b) and which is defined by: f{i, j} (X i , X j ) ∶= w1 ⋅ 1{X i = X j } + w2 ⋅ 1{X i ≠ X j }.
(3.15)
The differences of the edge weights w1 − w2 as a result of different training setups is shown in Figure 3.6 and which was always non-negative. 3
The training approaches are explained in Section 4.
37
3.1. EXACT INFERENCE OF LABELING PROBLEMS
Figure 3.6: Edge weight differences according to Equation (3.15). Each green bar indicates a training result belonging to a different training set up in terms of e.g. used feature functions, parameter assignments, edge inclusion radii δ and others.
This defines the edge feature functions as regular. This property is used to show that inference in CRFs having regular edge feature functions is efficient in terms of allowing algorithms with a polynomial computation time. Regular edge feature functions In contrast to the presentation discussed in section 2 Equations (2.8),(2.9) the search for the labeling with minimal cost is considered in this paragraph. We denote this problem as a MinCost labeling problem. The feature functions of nodes and edges are understood as costs. The algorithm described here is based on a condition of the edge feature functions. This condition emerges as biconcavity in the literature (Schlesinger and Flach 2000). Other names are regularity or monotonicity property. Here, the term regular feature function is used and the presentation follows Kolmogorov et al. (Kolmogorov and Zabih 2004). These authors have proven, that for nodes i, j ∈ χ having binary random variables X i and X j associated to, the problem of energy minimization is polynomial time solvable, if the edge feature functions fulfill the condition E{i, j} (0, 0)+E{i, j} (1, 1) < E{i, j} (1, 0)+E{i, j} (0, 1)
{i, j} ∈ K, {0, 1} = L. (3.16)
with mappings E{i, j} ∶ L × L ↦ R. The functions E{i, j} are then called regular.
38
CHAPTER 3. INFERENCE MinCost problem in canonical form Essentially, the efficient solution of the MinCost labeling problem stirs from an unambiguous mapping to the MinCut problem. The MinCut problem is the task of finding a cut of minimum edge capacity within a directed graph. This mapping can be established in polynomial time if and only if each edge capacity is non-negative. In this case the associated optimization problem, which is basically a piecewise linear optimization problem, is convex. For the convex MinCut problem the dual problem can be specified which in turn can be solved efficiently with the “MaxFlow” algorithm. This result is the consequence of the famous “MinCut-MaxFlow” theorem by (Ford and Fulkerson 1962). The below shown approach is based and generalized by Schlesinger et al. (Schlesinger and Flach 2006) to MinCost labeling problems with an arbitrary number of labels. In addition, the presentation is based on Mario Stanke, personal communication, January 4, 2014. Let a binary MinCost labeling problem be given which contains the following elements: • the connected undirected graph H = (χ, K) with nodes and edges as in Section 2 • the node feature functions f i (X i , y i )
Xi ∈ χ
(3.17)
• the edge feature functions ⎧ A i, j ⎪ ⎪ ⎪ ⎪ ⎪ ⎪ ⎪B i, j f{i, j} (X i , X j ) = ⎨ ⎪ C i, j ⎪ ⎪ ⎪ ⎪ ⎪ ⎪ ⎩ D i, j
if X i if X i if X i if X i
= Xj = 0 = 0, X j = 1 = 1, X j = 0 = Xj = 1
{i, j} ∈ K, (i < j)
(3.18)
such that A i, j , B i, j , C i, j , D i, j ∈ R and the regularity condition from Equation (3.16) applies • and the definition of a cost function C(χ) = ∑ f i (X i , y i ) + i∈V
39
∑
{i, j}∈E,(i< j)
f{i, j} (X i , X j ).
(3.19)
3.1. EXACT INFERENCE OF LABELING PROBLEMS • The MinCost problem is then defined as the problem to compute a labeling of minimum cost, which is to say ∗
ξ = argmin C(ξ).
(3.20)
ξ∈L n
Xj
Xi D i, j
f i (1, y i )
Ci ,
B i, j f i (0, y i )
f j (1, y j )
j f j (0, y j )
A i, j
Figure 3.7: Schema for a MinCost problem for nodes i and j with {i, j} ∈ K, (i < j). Definitions according to Equations (3.17) and (3.18) are used. We represent the given quantities by means of the schema in Figure 3.7, that was introduced by Rosenfeld et al. (Rosenfeld, Hummel, and Zucker 1976). By applying equivalent transformations4 to this schema, we obtain another representation of the same MinCost problem as depicted in Figure 3.8. There α i, j is given by A i, j + Xj
Xi α i, j
f i (1, y i ) + C i, j − β i, j
0
0 f i (0, y i ) + β i, j
f j (1, y j ) + B i, j − β i, j
0
f j (0, y j ) + β i, j
Figure 3.8: Schema after equivalent transformations. D i, j − B i, j − C i, j , which is strictly negative if and only if the condition in Equation (3.16) applies. Further, 2β i, j = A i, j is assumed. The obtained schema can further be modified as shown in Figure 3.9. 4
An algebraic manipulation of the input problem is said to be equivalent if it does not change the cost of each labeling.
40
CHAPTER 3. INFERENCE Xj
Xi ̂ f i (1, y i )
α ′′
′
α i, j ̂ f i (0, y i )
̂ f j (1, y j ) +
0
Ki
i, j
0
min{ f i (1, y i ) + C i, j − β i, j , f i (0, y i ) + β i, j } ´¹¹ ¹ ¹ ¹ ¹ ¹ ¹ ¹ ¹ ¹ ¹ ¹ ¹ ¹ ¹ ¹ ¹ ¹ ¹ ¹ ¹ ¹ ¹ ¹ ¹ ¹ ¹ ¹ ¹ ¹ ¹ ¹ ¹ ¹ ¹ ¹ ¹ ¹ ¹ ¹ ¹ ¹ ¹ ¹ ¹ ¹ ¹ ¹ ¹ ¹ ¹ ¹ ¹ ¹ ¹ ¹ ¹ ¹ ¹ ¹ ¹ ¹ ¹ ¹ ¹ ¸ ¹ ¹ ¹ ¹ ¹ ¹ ¹ ¹ ¹ ¹ ¹ ¹ ¹ ¹ ¹ ¹ ¹ ¹ ¹ ¹ ¹ ¹ ¹ ¹ ¹ ¹ ¹ ¹ ¹ ¹ ¹ ¹ ¹ ¹ ¹ ¹ ¹ ¹ ¹ ¹ ¹ ¹ ¹ ¹ ¹ ¹ ¹ ¹ ¹ ¹ ¹ ¹ ¹ ¹ ¹ ¹ ¹ ¹ ¹ ¹ ¹ ¹ ¹ ¹ ¹ ¹¶ + min { f j (1, y j ) + B i, j − β i, j , f j (0, y j ) + β i, j } ´¹¹ ¹ ¹ ¹ ¹ ¹ ¹ ¹ ¹ ¹ ¹ ¹ ¹ ¹ ¹ ¹ ¹ ¹ ¹ ¹ ¹ ¹ ¹ ¹ ¹ ¹ ¹ ¹ ¹ ¹ ¹ ¹ ¹ ¹ ¹ ¹ ¹ ¹ ¹ ¹ ¹ ¹ ¹ ¹ ¹ ¹ ¹ ¹ ¹ ¹ ¹ ¹ ¹ ¹ ¹ ¹ ¹ ¹ ¹ ¹ ¹ ¹ ¹ ¹ ¹ ¹ ¹ ¹ ¹ ¹ ¸¹ ¹ ¹ ¹ ¹ ¹ ¹ ¹ ¹ ¹ ¹ ¹ ¹ ¹ ¹ ¹ ¹ ¹ ¹ ¹ ¹ ¹ ¹ ¹ ¹ ¹ ¹ ¹ ¹ ¹ ¹ ¹ ¹ ¹ ¹ ¹ ¹ ¹ ¹ ¹ ¹ ¹ ¹ ¹ ¹ ¹ ¹ ¹ ¹ ¹ ¹ ¹ ¹ ¹ ¹ ¹ ¹ ¹ ¹ ¹ ¹ ¹ ¹ ¹ ¹ ¹ ¹ ¹ ¹ ¹ ¹ 
̂ f j (0, y j )
Kj
Figure 3.9: MinCost problem in appropriate form as input for a MinCut solver. K i , K j are added to the overall minimization problem. Both are constant, and thus omitted. The real numbers α ′i, j , α ′′i, j fulfill the condition α ′i, j +α ′′i, j = −α i, j . Additionally, the expressions for the respective node costs were aptly summarized by the notation ̂ f such that ̂ f i (1, y i ) = max { f i (1, y i ) − f j (0, y j ) + C i, j − A i, j − α ′′i, j , 0}, ̂ f i (0, y i ) = max { f i (0, y i ) − f i (1, y i ) + A i, j − C i, j + α ′′ , 0}, i, j
̂ f j (1, y j ) = max { f j (1, y j ) − f j (0, y j ) + B i, j − A i, j − α ′i, j , 0}, ̂ f j (0, y j ) = max { f j (0, y j ) − f j (1, y j ) + A i, j − B i, j + α ′ , 0}. i, j
The real valued constants K i , K j on the right hand side of Figure 3.9 are independent from the MinCost optimization and can be omitted. Nevertheless, each value involved in the representation of the regular MinCost is now strictly non-negative. Mapping regular MinCost to MinCut and the exact solution of MinCut Firstly, the task of finding a cut of minimum capacity within a directed graph is reviewed. Let a directed5 graph G(V{s,t} , E) with two distinct nodes (source s and sink t) contained in V{s,t} be given. We call the structure N (V{s,t} , E, c(i, j)) the flow network with nodes V{s,t} and edges E. Any edge (i, j) ∈ E is assigned a real valued capacity which is equivalently called the cost of the edge c(i, j) (Figure 3.10) if and only if each edge cost is non-negative, c(i, j) ≥ 0. Otherwise the MinCut problem becomes intractable. If c(i, j) = 0 then (i, j) ∉ E and vice versa. An s ↝ t separating cut C in the flow network N is an edge subset, such that in the network 5
Confirm Section 2.1 for definitions.
41
3.1. EXACT INFERENCE OF LABELING PROBLEMS N (V{s,t} , E ∖ C, c(i, j)) there exists no directed path from s to t. This edge subset is required to be minimal in the sense that no other cut C ′ exists that is a strict subset of C. To put it into other words, if an edge would be removed from C then a path connecting s and t would again exist. The cost of C is the sum of the capacities of edges that pass the cut C in the direction from s to t. In Figure 3.10 an example of a cut is shown.
4
10
3
9
s
12
1
16
T→ 20
7
←S
13
t 4
2
4 14
Figure 3.10: Flow network N (V{s,t} , E, c(i, j)) with non-negative edge capacities (numbers above edges) and a cut C(S, T). The cut is indicated by the vertical orange dashed line. The capacity sum of edges passing the cut in the direction from s to t is 26. Consider node 1 (blue circle) in Figure 3.10. There exists a path from the source s to 1 and another path from 1 to the sink t. Let a minimal cut C be given. Within the flow network N (V{s,t} , E ∖C, c(i, j)) only one of the directed paths can exist, either s ↝ 1 or 1 ↝ t. Otherwise, this would contradict the assumption of a valid cut C. Additionally, if both paths are contained in the cut, C is not minimal contradicting the minimality property. Based on these observations, we can define a cut as a decomposition of V{s,t} into two disjoint node subsets S and T such that s ∈ S and t ∈ T . Furthermore, for each node i ∈ S there exists either a directed path s ↝ i or, for each node j ∈ T there exists a directed path j ↝ t. The problem of finding the
42
CHAPTER 3. INFERENCE minimum capacity cut C + (S, T ) is then formalized with the equation C + (S, T ) = argmin ∑ ∑ c(i, j) C(S,T )
(i, j) ∈ E.
(3.21)
i∈S j∈T
In order to show the bijection between instances of regular MinCost problems and these of MinCut, it is convenient to make the dependency of the cost more explicit by rewriting Equation (3.21) as a sum of three terms C + (S, T ) = argmin { ∑ c(i, t) + ∑ C(S,T )
i∈S∖{s}
j∈T ∖{t}
c(s, j) + ∑
∑
i∈S∖{s} j∈T ∖{t}
c(i, j)}. (3.22)
To establish the equivalence between MinCut and MinCost instances, each binary labeling ξ ∈ {0, 1}∣V ∣ is identified with the partition of the nodes of the underlying graph G induced by a cut C(S, T ) of G. It is ξv = 1 if and only if v ∈ S ∖ {s} and ξv = 0 if and only if v ∈ T ∖ {t} for each node v ∈ V{s,t} . The optimal labeling of a MinCost instance arises according to its representation in Figure 3.9 to ∗ α i, j } f i (1, y i ) + ∑ ∑ ̃ f i (0, y i ) + ∑ ̂ ξ = argmin{ ∑ ̂ ξ∈{0,1}∣V ∣
i∈V ξ i =0
i∈V ξ i =1
i∈V ξ i ∈ξ
(3.23)
j∈V
ξ j ∈ξ
+ ∑ Ki i∈V
such that ̃ α i, j = α ′′i, j ⋅ 1{(ξ i ,ξ j ) = (1, 0)} + α ′i, j ⋅ 1{(ξ i , ξ j ) = (0, 1)} (i, j) ∈ E. By comparing Equation (3.22) with Equation (3.23) it can be seen, that within the three sums the same terms of nodes and edges are involved. Apart from notations and the optimization independent constant on the right hand side of Equation (3.23), both equations are ultimately equal. The schema to translate a MinCost instance H(χ, K) to its corresponding MinCut instance N (V{s,t} , E, c(i, j)) can be summarized as follows: • The set of nodes of the MinCut instance is the set of nodes of the MinCost instance with two additional nodes, source s and sink t, V{s,t} ∶= χ ∪ {s, t}. • The set of MinCut edges are formed from the MinCost edges according to: 43
3.1. EXACT INFERENCE OF LABELING PROBLEMS 1. Each edge from the MinCost instance is included twice in the set of MinCut edges to encode two directed edges. For an edge {i, j} ∈ K, (i < j), that is (i, j) and ( j, i). 2. Each node i in the MinCut instance is connected to s by a directed edge (s, i), and is connected to t by a directed edge (i, t). This is formalized with E ∶= {(i, j) ∣ {i, j} ∈ K} ∪ {( j, i) ∣ {i, j} ∈ K} ∪ {(s, i) ∣ i ∈ χ} ∪ {(i, t) ∣ i ∈ χ},
(i < j).
• The MinCut edge capacities are constructed as c(s, i) = ̂ f i (1, y i ),
c(i, t) = ̂ f i (0, y i )
i∈χ
and c( j, i) = α ′′i, j
c(i, j) = α ′i, j ,
{i, j} ∈ K, (i < j)
where the notation from Figure 3.9 has been used. Computing the optimum cut A very simplifying idea computing the optimum of the MinCut problem is based on two ingredients: firstly, as already mentioned in the beginning of this section, a MinCut problem is dual to a MaxFlow problem if and only if the edge capacities in MaxFlow are equal to these in MinCut. The MaxFlow problem can be solved in polynomial time by a variety of algorithms (Ford and Fulkerson 1962). Secondly, these simple algorithms are based on the assumption6 , that the number of directed paths along the flow can be improved (socalled augmenting pathways) through a network is polynomial bounded in order to increase stepwise the flow along each of these paths, and hence, the flow through the overall network from the source to the sink can be traced. The MaxFlow problem is defined as follows. A flow through the network N (V{s,t} , E, c(i, j)) is a mapping f ∶ E ↦ R such that the conditions 0 ≤ f (i, j) ≤ c(i, j) ∑ f ( j, i) = ∑ f (i, j) j∈I i
(i, j) ∈ E i ∈ V{s,t} ∖ {s, t}
j∈O i
´¹¹ ¹ ¹ ¹ ¹ ¹ ¹ ¹ ¸+ ¹ ¹ ¹ ¹ ¹ ¹ ¹ ¹ ¹ ¶ ´¹¹ ¹ ¹ ¹ ¹ ¹ ¹ ¹ ¹ ¸− ¹ ¹ ¹ ¹ ¹ ¹ ¹ ¹ ¹ ¹ ¶ σ
6
σ
This is generally not true but is neglected here.
44
(3.24a) (3.24b)
CHAPTER 3. INFERENCE are fulfilled. There, O i ⊂ V{s,t} is the node subset of ending nodes of edges starting at node i, O i ∶= {ter(i, j) ∣ (i, j) ∈ E}. I i ⊂ V{s,t} is the node subset of starting nodes of edges ending in node i, I i ∶= {init(i, j) ∣ (i, j) ∈ E}. The condition (3.24a) ensures that a flow through an edge is non-negative and is bounded by the edge capacity.
3.2
3∣
2.1 ∣ 2
2
.9
.89
1.6 ∣ 1 8 2.1
4.1
78
4 . 21 ∣
3.78 ∣
i
.67
1. 9∣
.13
.2 ∣7
=
σ+
6.7
4 . 58
∣2
.1
σ−
Figure 3.11: Flow conservation at node i with total flow 9.11 which is the sum of the incoming respective outgoing flows along the incident edges. The drawing uses a convention to state current flows and capacities that is described in the text. Condition (3.24b) is also called flow conservation property and ensures that the sum of all flows going into a node equals the sum of the outgoing flows from that node (apart from {s, t}). Both conditions are depicted in Figure 3.11. The convenflow∣ capacity
is used in the picture. The MaxFlow problem is defined as the tion search for a maximum flow F ∗ from the source s to the sink t that can be brought through the network such that at each node (3.24a) and (3.24b) are fulfilled. This is computed as F∗ =
argmax
F=( f (s,i 1 ), f (s,i 2 ),... )
=
argmax
∑ f (s, i) i∈O s
F=( f ( j 1 ,t), f ( j 2 ,t),... )
∑ f ( j, t). j∈I t
One of the earliest algorithms to compute F ∗ is based on the notions of a flow improvement along an augmenting pathway P ∶ s ↝ t. An edge (i, j) is said to 45
3.1. EXACT INFERENCE OF LABELING PROBLEMS be unsaturated, if f (i, j) < c(i, j). Otherwise it is called saturated, that is the flow along the edge cannot be improved further. An augmenting pathway P consists of a sequence of edges P = {(s, i1 ), (i2 , i3 ) . . . (i m , t)} such that each edge (i, j) ∈ P is unsaturated. That means c(i, j) − f (i, j) > 0 and this difference is defined as the residual capacity of the edge and is usually denoted by r(i, j). This number in turn explains the flow improvement which still can be realized along the edge. Then, the maximum improvement of a flow along an augmenting pathway P coincides with the minimum residual capacity over each edge along P.
1 f1 = 10
c1 = 12
10
3
2
4
c2 = 13
⋯
c n−1 = 14
10
10
⋯
10
2
cn = 10
⋯
c 0 = 20
20
⋯
n f =0 ⋯
Figure 3.12: Residual network after augmenting the flow f1 = 10 along the path ⋯ ↝ 1 ↝ 2 ↝ n ↝ ⋯. Red edges indicate the edge directions within the flow network. Green numbers show the residual capacities in the direction of the flow network edge, blue numbers are the residual capacities in the opposite direction. As an example consider the edges (1, 2). It has capacities c(1, 2) = 12 and c(2, 1) = 0. After flow propagation, r(1, 2) = 2 and r(2, 1) = 10. The red thick edge in the upper right of the figure is saturated because c n − f1 = 0.
46
CHAPTER 3. INFERENCE
1 f1 = 10
c1 = 12
3
10
2
11
c2 = 13
⋯
c n−1 = 14
3
3
⋯
10
9
cn = 10
⋯
c 0 = 20
13
⋯
n f2 = 7 ⋯
Figure 3.13: Residual network after augmenting the flow f2 = 7 along the path ⋯ ↝ n ↝ 2 ↝ 1 ↝ ⋯. The colors are used as explained in Figure 3.12. The algorithm for solving the MaxFlow problem with the help of flow improvement along augmenting paths is given in Algorithm 3.1. It uses the residual network that is explained in Figure 3.12 as data structure. The algorithm uses the function FIND AUGMENTING PATH that determines an augmenting pathway P on the basis of a mechanism that is not further detailed here. After termination the value of the MinCut problem given in Equation (3.22) or equivalently, of the solution of the MinCost problem given in Equation (3.23) is available. It remains to construct the actual labeling. From the proof of the theorem by Ford and Fulkerson (Ford and Fulkerson 1962) and the explanations given at the beginning of this section it is known, that a minimum cut can only contain saturated edges. If the labeling is considered as a corresponding partition of the nodes, it can be defined based on paths that start at s or, at t and that contain only unsaturated edges. That is, if there exists a pathway P(s, i k ) = {(s, i1 ), (i1 , i2 ), ⋯, (i k−1 , i k )} such that each edge is unsaturated, then i k ∈ S or, if P(i k , t) = {(i k , i k−1 ), (i k−1 , i k−2 ), ⋯, (i1 , t)} such that each edge is unsaturated, then i k ∈ T. None of these pathways can connect s and t since then Algorithm 3.1 does not stop. From this point of view, the construction of the best labeling for the MinCost problem is finalized with the computation of two connected components within the directed graph N (V{s,t} , E, f ∗ (i, j)). Convex functions are regular Ishikawa et al. (Ishikawa and Geiger 1998) specify a polynomial time algorithm for the labeling problem for convex edge feature functions with a subset of integers as labels. Their edge feature functions only depend on the label differences, F(ξ1 − ξ2 ). Then, edge functions are convex if for any
47
3.1. EXACT INFERENCE OF LABELING PROBLEMS
Algorithm 3.1: Compute MaxFlow( N (V{s,t} , E, c(i, j)) ) # construct a residual network for each (i, j) ∈ E do r(i, j) ← c(i, j) for each (i, j) ∉ E do r(i, j) ← 0 # compute an augmenting pathway P P ← FIND AUGMENTING PATH( N (V{s,t} , E, c(i, j), r(i, j)) ) while P ≠ ∅ ⎧ # compute flow improvement based on P ⎪ ⎪ ⎪ ⎪ ⎪ f˜ ← min(i, j)∈P r(i, j) ⎪ ⎪ ⎪ ⎪ ⎪ ⎪ ⎪ ⎪ ⎪ ⎪ # increase flow along P ⎪ ⎪ ⎪ ⎪ ⎪for each (i, j) ∈ P do ⎨ ⎧ # update residual capacities (compare Figures 3.12 and 3.13) ⎪ ⎪ ⎪ ⎪ ⎪ ⎪ ⎪ ⎪ do ⎨r(i, j) ← r(i, j) − f˜ ⎪ ⎪ ⎪ ⎪ ⎪ ⎪ ˜ ⎪ ⎪ ⎪ ⎩r( j, i) ← r( j, i) + f ⎪ ⎪ ⎪ ⎪ ⎪ ⎪ ⎪ ⎪ ⎪ ⎩P ← FIND AUGMENTING PATH( N (V{s,t} , E, c(i, j), r(i, j)) ) # each edge is saturated → compute maximum flow f∗ ← 0 for each (i, j) ∈ E f ∗ (i, j) ← c(i, j) − r(i, j) do { ∗ f ← f ∗ + f ∗ (i, j) return ( f ∗ , f ∗ (i, j))
triplet of labels ξ1 < ξ2 < ξ3 : F(ξ2 ) ⋅ (ξ3 − ξ1 ) < F(ξ1 ) ⋅ (ξ3 − ξ2 ) + F(ξ3 ) ⋅ (ξ2 − ξ1 ).
48
CHAPTER 3. INFERENCE For such function F the Equation (3.16) holds, too. To see this, let L′ {−1, 0, 1} and ˆ ξˆ′ ) where E{i, j} are edge functions of the binary define F{i, j} ( ξˆ − ξˆ′ ) ∶= E{i, j} ( ξ, ˆ ξˆ′ ∈ {0, 1}. Hence MinCost-problem, i.e. ξ, 2 ⋅ F{i, j} (0) is compared with F{i, j} (1) + F{i, j} (−1). Since F{i, j} is convex, it follows that the left hand side is smaller then the right hand side. Or, convex edge feature functions are regular. The reverse statement is not always true, since regular functions can be defined which either not depend on the label difference or are not convex.
3.1.7
Exact solution of the MinCost problem on partial m−trees
It is known that many N P-hard problems become polynomially time solvable if the underlying graph structure is restricted to trees or more generally to partial m−trees (Koller and Friedman 2009). This is particularly true for the MinCost problem shown here for the class of partial m−trees. The latter are defined with the help of a tree decomposition of a graph. A dynamic-programming-like algorithm is presented here, since in the experiments of this thesis it was observed that a few CRF-instances encoding a labeling problem in order to predict proteinprotein interaction sites allowed its application for inference. This was valid for ˚ causing inclusions of smaller numbers of edges into edge inclusion radii δ < 6A the model graph. Hence, in the implementation depending on the problem size an appropriate inference algorithm is chosen. The implementation of this algorithm is available in the software package libDAI published by Mooij (Mooij 2010) and has been used in the present thesis. Definition 1 (tree decomposition). Let G(V , E) be an undirected graph. A tree decomposition of G is a tree T (B, R) with nodes B = {1, . . . , t} where each I ∈ B is a subset of nodes from V 7 . The construction of T (B, R) fulfills the following properties: t 1. ⋃I=1 I=V
2. For each edge {i, j} ∈ E, (i < j) there exists a node K ∈ B such that i, j ∈ K. 3. If two nodes I, J ∈ B contain a node v ∈ V , then each node K ∈ B in the path between I and J contains that node v, i.e. v ∈ I ∩ J ⊂ K. Equivalently, the tree nodes containing v constitute a connected subtree of T . 8 7 8
The nodes of T are sometimes called bags. This is the so-called running intersection property of T .
49
3.1. EXACT INFERENCE OF LABELING PROBLEMS The width of a tree decomposition is the number m = maxI∈B ∣I∣ − 1, briefly considering I as subsets of V in this notation, I ⊆ V . The treewidth tw(G) of a graph G is the minimum number m over all possible tree decompositions of G. In this definition, the size of the largest set is decremented in order to have an unified 1-treewidth for trees. When m is fixed, then the graphs with treewidth m can be recognized, and a tree decomposition of width m can be computed in linear time (Bodlaender 1996). An m−tree T ′ fulfills Definition 1, but has nodes B such that all nodes v ∈ V contained in any node I ∈ B form a clique of size m + 1 in V . Thus, T is called a partial m−tree, if it is a subgraph of T ′ . Now, the mapping from a binary MinCost problem on a general graph to an equivalent tree decomposition is shown. Let an undirected connected graph G(V , E) be given. Let the cost function of the binary MinCost problem be defined accord∣V ∣ ing to Equation (3.20) with label set L = {0, 1} and random variables X = (X i )i=1 . Let further a tree decomposition T (B, R) of G be given with treewidth m. By definition of a tree decomposition, each node I ∈ B contains at most m + 1 nodes from V . Thus, for each subset I there exists at most 2m+1 labelings. The new label set L′ contains these labelings, L′ = Lm+1 . For each node I ∈ B and each new label ξ′I ∈ L′ the node feature functions fI,ξ′I are defined as fI,ξ′I (B I ) = ∑ f k,ξ′I ∣k (B I ∣k , y k ) + k∈I
∑
{k, l }∈E ,(k ∑ ∑ Pw∗ (ξ ∣ y(i) ). i=1 ξ≠ξ(i)
Further, using the definition of the log-linear distribution P in Equation (2.9) and a similar hyperplane argument as given in Section 3.1.3, a linear optimization probn lem can be stated that contains ρ ⋅ (∣L∣ − 1) inequalities compute: such that:
w (i) E y(i) (ξ , w) > η(D) ⋅ E y(i) (ξ, w)
(i)
(ξ , y (i) ) ∈ D (i) ξ ≠ ξ , η(D) 0. Among all new weight vectors that margin w′ is chosen which minimizes the Euclidean distance to the old weight vector w. The problem (4.18) is solved either by means of Lagrangian multipliers or based on geometrical considerations regarding the involved affine subspaces and has solution (i)
∗
w′ = w + F(ξ , ξ , w)
(4.19)
with (i)
∗
∆ = E y(i) (ξ , w) − E y(i) (ξ , w), ∗
(i)
L(ξ , ξ ) − ∆ ∂∆ . ⋅ F(ξ , ξ , w) = dw ∥ d∂∆w ∥2 (i)
∗
This formula is applied in Algorithm 4.1 enriched with a real parameter τ ≥ 0 – inspired by the perceptron – the so-called learning rate and so that w′ = w + τ ⋅ (i) ∗ F(ξ , ξ , w). The algorithm is initialized with the weight vector w(0) as specified in Section 4.1.2 based on reasonable feature functions used in the experiments.
74
CHAPTER 4. PARAMETER TRAINING
Algorithm 4.1: OLM(M, w(0) ) # The training data M and the vector w(0) are parameters of the algorithm. initialize: v ← 0, w ← w(0) (i) for each (ξ , y (i) ) ∈ M, i = 1, 2, . . . , ∣M∣ ∗ ⎧ ξ ← argmax Pw (ξ ∣ y (i) ) ⎪ ⎪ ⎪ ⎪ ξ ⎪ ⎪ ⎪ ⎪ ∗ (i) ⎪ ⎪ if ξ ≠ ξ ⎪ ⎪ ⎪ do ⎨ ⎪ ⎪ ⎧ ⎪ use Equation (4.19) to obtain w′ using L ∶= max {α ⋅ FP + FN, 0} ⎪ ⎪ ⎪ ⎪ ⎪ ⎪ ⎪ ⎪ then ⎨v ← v + w′ ⎪ ⎪ ⎪ ⎪ ⎪ ⎪ ′ ⎪ ⎪ ⎩w ← w ⎩ w ← v/ρ return (w)
The notation Pw in Algorithm 4.1 explicitly shows the dependency of the conditional probability Pw (ξ ∣ y (i) ) on the model parameters w. Specifically, the implemented loss function L has the specified form where FP is the number of false positives (residues incorrectly labeled as interfaces) and FN is number of false negatives (residues incorrectly labeled as non-interfaces). The scalar α fine-tunes the adaptation of the model parameters. Several “weighted versions” of Algorithm 4.1 are conceivable, that is in advance each training instance is assigned to a particular weight. The weight embodies the importance of each instance within the search for the optimum parameter vector. The implemented weighting according to Algorithm 4.2 gave the best results. It assigns highest priority to training instances leading to misclassifications.
75
4.2. SUPERVISED TRAINING USING LARGE-MARGIN PRINCIPLE
Algorithm 4.2: weighted OLM(M, w0 ) initialize: v ← 0, w ← w0 , k ← 0 (i) for each (ξ , y (i) ) ∈ M, i = 1, 2, . . . , ∣M∣ ∗ ⎧ ξ ← argmax Pw (ξ ∣ y(i) ) ⎪ ⎪ ⎪ ⎪ ξ ⎪ ⎪ ⎪ ⎪ ∗ (i) ⎪ ⎪ if ξ ≠ ξ ⎪ ⎪ ⎪ ⎪ ⎪ do ⎨ ⎧ use Equation (4.19) to obtain w′ . ⎪ ⎪ ⎪ ⎪ ⎪ ⎪ ⎪ ⎪ ⎪ ⎪v ← v + w ′ ⎪ ⎪ ⎪ then ⎨ ⎪ ⎪ w ← w′ ⎪ ⎪ ⎪ ⎪ ⎪ ⎪ ⎪ ⎪ ⎪ ⎪ ⎩k ← k + 1 ⎩ if k > 0 then w ← v/k return (w)
In accordance with Zellner et al. (Zellner et al. 2011) and Li et al. (Li et al. 2007), for training a 2-fold cross-validation is applied, but in contrast to these authors a third separate houldout set is used avoiding explicitly any dependency of the final prediction results from the training data. That is, the training data D is split into three pairwise disjoint subsets D1 , D2 and D3 and keep D3 as the unique holdout set. The model parameters w are then improved with D1 and D2 using Algorithm (4.3). That means, firstly it is trained on D1 and evaluated on the subset D2 .
76
CHAPTER 4. PARAMETER TRAINING
Algorithm 4.3: Training(M1 , M2 ) procedure Evaluate(M, w) initialize: L′ ← 0 for each (ξ i , y i ) ∈ M, i = 1, 2, . . . , ∣M∣ ∗ ⎧ ξ ← argmax Pw (ξ i ∣ y i ) ⎪ ⎪ ⎪ ξi ⎪ do ⎨n ← number of nodes in graph H i i ⎪ ⎪ ⎪ ′ ← L ′ + L(ξ ∗ , ξ )/n ⎪ L i ⎩ i i return (L′ /∣M∣) # The data sets M1 and M2 are parameters of the following procedure. initialize: (L∗ , w∗ ) ← (∞, 1), (L, L pre , w) ← (0, 0, 1) repeat ⎧ w ← OLM(M1 , w) ⎪ ⎪ ⎪ ⎪ ⎪ L ← Evaluate(M2 , w) ⎪ ⎪ ⎪ ⎨if L < L∗ ⎪ ⎪ ⎪ L ← L∗ ⎪ ⎪ then { pre∗ ∗ ⎪ ⎪ ⎪ (L , w ) ← (L, w) ⎩ until ∣L pre − L∗ ∣ < ε return (L∗ , w∗ )
This process runs until no further improvement of the average relative loss L∗ of Algorithm 4.3 can be achieved. That means, the algorithm runs until consecutive training steps yield a difference of the respective relative losses which is smaller than a predefined ε. D1 and D2 are then interchanged and the process is repeated. Those model parameters are retained that achieve the smallest relative loss as specified in Algorithm (4.4).
77
4.2. SUPERVISED TRAINING USING LARGE-MARGIN PRINCIPLE
Algorithm 4.4: Select Parameters(D1 , D2 ) (L1 , w1 ) ← Training(D1 , D2 ) (L2 , w2 ) ← Training(D2 , D1 ) if L1 ≤ L2 then return (w1 ) else return (w2 )
At the end of the process, the selected model parameters are evaluated on the holdout set D3 . As an example, consider the data set PlaneDimers that contains 128 protein chains from homodimer complexes (Zellner et al. 2011). Randomly are 32 different proteins assigned to each subset D1 and D2 and the remaining 64 proteins are included in the holdout D3 .
78
Chapter 5 Results In this chapter the accuracy of our implemented CRF-model – denoted by ∆FCRF– is evaluated. In order to do so, two published sets of proteins are used having known protein-protein interaction interfaces or equivalently known binding sites. The achieved results of ∆F-CRF were compared to the output of other methods with respect to the protein data cited in the corresponding publications. Additionally, we generated reference labelings by adopting the publication-matching definition of a protein-protein interaction site keeping comparability to the original papers. The results are compared to these of Li et al. (Li et al. 2007) who also used a CRF, but in contrast to our general graphical model, incorporates only a linear chain of nodes. Either methods – ∆F-CRF and the method of Li et al. – were evaluated on a set of homo- and heterodimers by Keskin et al. (Keskin et al. 2004) termed Keskin list. Further, ∆F-CRF was evaluated on the homodimer set PlaneDimers compiled by Zellner et al. (Zellner et al. 2011). We compared our results with these of the PresCont server (Zellner et al. 2011). In that process, we do not make a distinction between cases where two proteins interact and constitute an interface, from cases with more than two proteins involved. These aspects are expected to be incorporated into CRF-models, but are left aside in the present work. For the Keskin list only the feature class RASA is used. On the PlaneDimers data set RASA and the newly proposed feature class ∆F are simultaneously used. On both data sets also the edge feature class from Equation (2.2) is incorporated in the model. In each experiment, the Belief Propagation implementation of the opensource software library libDAI (Mooij 2010) was used computing the maximum probability labeling.
79
5.1. COMPARISON TO LINEAR-CHAIN CRF USING KESKIN LIST
5.1
Comparison to linear-chain CRF using Keskin list
Here, the influence of the edge inclusion radius δ according to Equation (2.1) on the prediction performance is examined. The prediction results of the ∆F-CRF are compared with these of Li et al. (Li et al. 2007) using the Keskin list data set. This redundancy-free set of homo- and heterodimers includes 1276 protein chains with a broad variety of biological functionality. On this data set the following definition of interface residues is used computing the reference labelings: Definition. An inter-facial contact of a residue on a chain exists, if the C α atom of ˚ from the C α atom from a partner chain. this residue is at a distance of at most 5 A The absolute numbers describing the reference labelings in the Keskin list are given in Table 5.1. Chains 1276
residues 312 858
actual positives (AP) 56 831
Table 5.1: Summary of data from Keskin list where 18.2% residues are labeled I and that are considered as ground truth interaction interface residues Based on a 2-fold cross-validation with separate holdout set in accordance with Section 4, the performance measures specificity and sensitivity as functions of δ were computed and are shown in Table 5.2. These measures are defined as follows specificity ∶= TN/(TN + FP) sensitivity ∶= TP/(TP + FN) such that TP is the number of true positives that are correctly I-labeled residues TN is the number of true negatives that are correctly N -labeled residues FP is the number of false positives that are incorrectly I-labeled residues and which actually are N -labelled in the ground truth1 FN is the number of false negatives that are incorrectly N -labeled residues and which actually are I-labelled in the ground truth. 1
Ground truth and reference data are interchangeably used.
80
CHAPTER 5. RESULTS The actual positives are defined as AP ∶= TP + FN and, using the notation AN for the actual N -labeled resides in the reference data AN ∶= TN + FP. Usually, sensitivity is synonymously denoted with Recall or true positive rate (TPR) while the false positive rate (FPR) is defined by FPR ∶= 1 − specificity = FP/AN. For δ = 0 no edges are included in the model graph H, not even the backbone edges. The model parameters are trained for each δ separately. Li et al. use a linear-chain CRF considering only the edges along the backbone and integrate the feature RASA. In contrast, we use a general graphical model not constrained to edges along the backbone but we equivalently use the node feature RASA. Additionally, Li et al. apply a simple edge feature in order to “smooth the label assignment of neighboring nodes” coinciding with our edge feature according to Equation (2.2) although it remains unclear if parameter tying was used by Li et al. . The training methods are completely different. The performance measures for the method of Li et al. were calculated by comparing the original output data downloaded from their website2 to our reference labelings. ˚ δ [A] specificity 0.0 0.822 3.0 0.838 6.5 0.867 9.0 0.885 11.0 0.910 Li et al. 0.863
sensitivity 0.389 0.528 0.479 0.421 0.403 0.395
Table 5.2: Performance on the Keskin list. The accuracy of ∆F-CRF as a function of the edge inclusion radius accordingly Equation (2.1) is shown. The performance measures of individual proteins can considerably vary from the average values. As an example consider Figure 5.1. The performance measures 2
http://www.insun.hit.edu.cn/~mhli/site_CRFs/index.html
81
5.1. COMPARISON TO LINEAR-CHAIN CRF USING KESKIN LIST
1.0
for each protein taken from the Keskin list and labeled by the Li et al. method are plotted. As it can be seen, proteins with an almost exact prediction of their interaction interface are included together with proteins where the method almost completely fails.
●●
●
●
● ● ●
●
●
● ●
●
● ●
● ● ●
●
●
● ●
● ●
●
● ● ● ● ● ● ● ●● ● ● ●● ● ● ● ● ● ● ● ● ● ●● ● ●● ● ● ● ● ●● ● ● ● ● ●● ● ● ● ● ● ● ●● ●● ● ● ● ● ●● ● ● ● ● ● ● ●● ● ● ●● ● ● ● ● ● ●●● ● ●●● ● ● ● ● ● ● ●● ●● ● ● ● ● ● ● ● ● ● ● ● ● ● ●●●● ● ●● ● ● ● ●● ● ● ● ●● ● ● ●● ● ● ● ●● ● ● ● ● ● ●● ●●● ●●● ● ● ●● ● ● ● ● ● ● ● ● ● ● ● ● ● ● ● ●● ● ●●● ● ● ●● ● ● ● ● ● ● ● ● ● ●● ● ●● ● ● ● ● ● ● ● ● ● ● ● ●●●● ● ● ● ● ● ●●● ●● ● ● ● ● ● ●●● ●● ●● ●● ● ● ● ● ● ● ●● ● ● ● ● ● ● ● ●●● ●● ● ●●●● ● ● ● ● ● ● ● ●● ● ●●● ● ●● ●● ● ●●● ● ●● ●●● ●● ● ● ● ●● ●● ● ● ● ● ● ●● ● ● ● ● ● ● ● ● ●● ● ● ●● ● ●● ●●● ●● ● ● ● ● ●● ●● ● ● ● ●● ● ●● ●● ● ● ●● ● ● ● ● ● ● ●● ●● ● ● ● ● ● ● ●● ● ● ● ● ●● ● ● ● ●●● ● ● ● ● ● ● ● ●● ● ● ●●● ● ● ●● ● ●● ● ● ●●● ●● ●●● ● ● ● ● ● ● ● ● ● ●● ● ● ● ● ●● ● ● ● ● ●● ● ● ● ● ● ● ● ● ● ● ● ● ● ● ● ● ● ● ● ● ● ● ● ● ● ● ● ● ● ●●● ● ● ● ● ● ●● ● ●● ●● ● ●● ●● ● ●● ● ● ● ●● ●● ●● ● ●● ●● ● ● ●● ● ● ●● ● ● ● ●●● ● ● ● ● ● ●● ●● ● ● ● ● ● ●● ● ● ●●● ● ● ●● ● ● ● ● ● ● ● ● ● ● ●● ●● ● ●● ●● ● ● ● ● ● ● ●● ● ● ● ● ● ● ● ● ● ● ● ● ● ● ● ● ● ● ● ● ● ● ● ● ● ● ● ● ●● ● ● ● ● ● ● ● ● ● ● ●● ● ● ●● ● ● ●● ●●● ● ●● ● ● ●● ● ●● ● ● ● ● ●● ● ● ● ● ● ●● ● ● ● ●● ● ● ●● ● ●● ● ● ● ●
● ●
0.4
0.6
●
0.0
0.2
True Positive Rate (Lieval.plot−li)
0.8
● ● ● ●
0.0
0.2
0.4
●
● ●
●
● ●
● ●
● ●
● ● ● ●
0.6
0.8
1.0
False Positive Rate (Lieval.plot−li)
Figure 5.1: Receiver operator characteristic of Li et al. for the Keskin list indicated for each protein. The green dot indicates the average from Table 5.2 (bottom). The black dots are the performance measures of each individual protein of the Keskin list. The diagonal indicates the performance of a “random guess predictor” assigning labels from {I, N } uniformly at random to each residue. Based on the plot, two further performance measures intentionally called variance in specificity and variance in sensitivity can be more expressive and are suggested here although the rather unintuitive – in terms of value interpretation –
82
CHAPTER 5. RESULTS correlation coefficient is defined by Li et al. (Li et al. 2007) as CC ∶= √
TP × TN − FP × FN (TP + FN)(TP + FP)(TN + FP)(TN + FN)
.
0.8 0.6
●
●
●
● ● ●
●
● ●● ●● ● ●● ● ● ●● ● ●● ●●● ● ●●●●● ● ● ●● ● ●● ● ● ● ● ● ● ● ● ● ●●● ● ● ● ● ● ● ● ●● ●●● ● ●● ●● ● ● ● ● ● ● ● ● ● ● ● ● ● ●● ● ●● ● ●●● ● ●● ● ●● ● ● ●● ● ● ● ● ● ● ● ● ● ●●● ●● ● ● ●● ● ●●●● ● ● ●● ●● ● ● ● ● ● ●● ● ● ●● ● ●●●● ● ● ●● ● ● ●● ●● ● ●● ● ● ●●●●●● ●● ●●●●●● ● ●● ● ● ● ● ●● ●●●● ●● ●●● ● ● ●● ●● ● ● ● ● ● ● ●● ●● ●●●● ● ●● ● ●● ● ●● ● ●● ●● ● ● ● ● ● ● ● ● ● ● ● ● ● ● ● ● ● ● ● ●● ● ● ● ● ● ● ● ● ●●●●●● ● ● ● ●● ● ● ● ● ● ● ● ●● ●● ● ● ● ●● ● ●● ●●● ● ● ● ●● ●● ● ●● ● ● ●● ●● ●● ● ●● ● ● ● ● ● ●● ● ● ● ●●● ● ● ● ● ● ●
●
0.4
●
●
●
●
●
●●
0.2
True Positive Rate (2012−05−31−−3.0−roa)
1.0
As an example, consider Figure 5.2
● ● ● ●● ●
●
Li et. ( 0.137 , 0.395 / 2.883 )
0.0
( 0.178 , 0.389 / 2.183 )
0.0
0.2
0.4
0.6
0.8
1.0
False Positive Rate (2012−05−31−−3.0−roa)
Figure 5.2: Performance values of ∆F-CRF for each protein from the Keskin list with ˚ The results for each protein (black dot) are densely centered on the average δ = 0A. indicated by the green dot. Results of Li et al. are drawn as red triangle. The values in brackets indicate in order of appearance: (FPR, TPR / TPR FPR ) for each method. where the performances for each protein form a denser cloud around the center. Thus, from the author’s point of view, these represent better prediction results although the averages given in the plot are almost equal.
83
5.1. COMPARISON TO LINEAR-CHAIN CRF USING KESKIN LIST
1.0
In Figure 5.3 the performance measures for each protein are plotted for the case ˚ of an edge inclusion radius of δ = 3A.
●
● ●
● ●
●
●
●
●
●
●
●
0.8
●
● ●
0.6 0.4
● ●
● ●
●●
● ●
●
●
●●
●●
● ● ●● ● ● ● ● ● ● ● ● ● ● ● ● ● ● ● ● ● ●● ●●● ●●●● ● ● ● ● ● ● ● ● ● ● ● ● ● ● ●● ● ● ● ● ● ● ● ● ● ● ● ● ● ● ● ● ● ● ● ● ●●● ●● ● ● ●● ●● ●● ●● ● ● ● ●● ●● ● ● ● ● ● ● ● ●● ●● ● ● ● ● ● ● ● ● ● ● ● ● ● ● ● ● ● ● ● ● ●● ● ● ● ● ● ● ●● ● ● ● ●● ● ● ● ●● ● ●● ● ●● ● ● ● ● ● ● ● ● ● ● ● ● ● ● ●●● ● ● ● ●● ●●● ● ● ●● ● ● ● ● ● ● ● ● ● ● ● ●● ● ● ● ● ● ● ● ● ●● ● ●● ● ● ● ● ● ● ● ● ● ●● ● ● ● ● ● ● ● ● ● ● ●● ● ● ● ● ● ● ● ●● ● ●● ● ● ● ● ● ● ● ● ● ● ● ● ● ● ● ●●● ● ● ● ● ● ● ● ● ●● ● ● ● ●●● ●● ● ● ●● ● ● ● ● ● ● ● ●● ● ● ● ● ● ●● ● ● ●
●
● ● ●
●
●
0.2
True Positive Rate (2012−05−22−−3.0−ro4)
●
Li et. ( 0.137 , 0.395 )
● ● ● ● ●
0.0
●
● ●
●
●
●
●
0.0
●
( 0.162 , 0.528 )
● ●
●
●
0.2
0.4
0.6
0.8
1.0
False Positive Rate (2012−05−22−−3.0−ro4)
Figure 5.3: Performances (black dots) for each protein of the ∆F-CRF method at ˚ Results of Li et al. are drawn as averages (0.838, 0.528) from Table 5.2 and δ = 3A. red triangle. The value in brackets are (FPR, TPR). In Figure 5.4 the performance measure for each protein is plotted for the case ˚ Increasing δ – and hence the number of edges in the graph – means δ = 11A. that fewer independence assumptions are made in the undirected graphical model that a CRF constitutes. In the extreme case δ = 0, the labels of all residues are independent random variables. In the special case used by Li et al. , the graph contains an edge between two residues if and only if they are immediate neighbors in the sequence. In actual interfaces, however, such independence is not given because interfaces often form “patches” on the surface, where interface residues
84
CHAPTER 5. RESULTS
1.0
are close that are not neighbors in sequence. ●
●● ●
● ●
●
●
● ●
●
● ●
●
●
● ●
● ●
●
●
● ● ●
●● ●
0.8
● ● ● ● ● ● ● ● ● ● ●
● ●
● ●
● ●
●
● ●
● ● ●
● ●
●
● ●
● ● ●
0.6
● ● ● ● ●
●
●
0.4
● ●●
0.2
●● ● ● ● ●● ●
●
●
● ●●
● ●
●
● ●
● ●
●● ●●
● ● ● ● ● ● ● ● ● ●● ● ● ● ● ● ● ● ● ● ● ● ●● ● ● ● ● ● ●● ●● ● ● ● ● ● ● ● ●● ● ● ● ● ● ●● ● ● ● ● ● ●●● ● ● ● ● ● ●● ● ● ● ● ●● ● ● ●●● ● ● ● ● ● ● ● ●● ● ● ●● ● ● ● ● ●● ● ● ● ● ● ● ● ●● ●● ● ● ● ●● ● ● ●●●● ● ●●●● ● ● ● ● ● ● ●● ●● ● ●● ● ● ●● ● ●● ● ● ● ● ● ● ● ● ●●●● ●● ●● ● ● ● ●
0.0
● ● ●● ●
●
●
0.0
True Positive Rate (2012−05−25−−11.0−rxx)
● ●
● ● ● ● ● ● ●
●
● ●●
● ● ●● ● ● ● ● ●
●
●
●
●
●
●
●
● ●
● ●
● ●
Li et. ( 0.137 , 0.395 / 2.883 )
● ●
●
( 0.09 , 0.403 / 4.454 ) ● ●
0.2
0.4
0.6
0.8
1.0
False Positive Rate (2012−05−25−−11.0−rxx)
Figure 5.4: Performances for each protein of the ∆F-CRF method at averages ˚ Again, results of Li et al. are drawn (0.910, 0.403) from Table 5.2 and δ = 11A. as red triangle. The values in brackets are: (FPR, TPR / TPR FPR ). It can be deduced, performances for individual proteins can considerably vary from the method average. ˚ 9A ˚ and 11A ˚ our general CRF has both higher For edge inclusion radii 6.5A, specificity and higher sensitivity than the method of Li et al. , which also includes the RASA features. A possible explanation for the increased performance of ∆FCRF is therefore the inclusion of additional edges in the conditional independence graph.
5.2
Comparison to PresCont using PlaneDimers
The results of the ∆F-CRF are further compared with the results of the PresCont server using the PlaneDimers of Zellner et al. . Additionally to RASA, ∆F-CRF in85
5.2. COMPARISON TO PRESCONT USING PLANEDIMERS cludes the node features class ∆F modeled with τ = 20 bins per label, see Chapter 2 for definitions. The bin number τ was heuristically chosen as follows. Let a reference set of proteins be given. Start with τ = 1. Then, the performance of a simple threshold predictor assigning labels to nodes independent from other labels and based on the distribution according to Equation (4.9) using ξ∗i = argmax Pw (X i = ξ ∣ y)
i∈χ
ξ∈L
is evaluated. In order to do so, the performance measures (FPR, TPR) considered as a point in the plane as in Section 5.1 are computed. Further, the bin number is incremented and the process repeated. Finally, the bin number τ corresponding to performance measures with smallest distance to the point (FPR, TPR) = (0, 1) is taken. The reference labelings were computed using a definition for interface residues that is in accordance with Keskin et al. . Definition. A residue constitutes an interface residue, if there exists at least one atom ˚ from of this residue which has a van-der-Waals-sphere at a distance of at most 0.5A the van-der-Waals-sphere to any atom from a partner chain residue. The van-derWaals-sphere is an imaginary sphere around the mass center of an atom having a radius equal to the length of the associated van-der-Waals-force between concerned atoms. “The van-der-Waals-force is a weak attractive force between atoms caused by an instantaneous dipole moment of one atom inducing a similar temporary dipole moment in adjacent atoms .”3 ˚ throughout these The edge inclusion radius δ has been manually fixed to 9A experiments. As target proteins, the set PlaneDimers is selected whose summary is Chains 128
residues AP 31001 3597
Table 5.3: Summary of PlaneDimers data. shown in Table 5.3. This benchmark of proteins was compiled by Zellner et al. surveying particularly “canonical” interfaces. The authors removed complexes from the Keskin list 1. if one partner contains less than 100 residues, 3
Science Dictionary, 2014
86
0.6 0.4
TPR = Sensitivity
0.8
1.0
CHAPTER 5. RESULTS
PresCont
0.2
∆ F−CRF
0.2
0.4
0.6
0.8
1.0
FPR = 1−Specificity
Figure 5.5: The ∆F-CRF (blue) dominates the PresCont method (green) up to a false positive rate of about 50% for the PlaneDimers data. From the point (0.7, 1.0) PresCont and ∆F-CRF have comparable performances. ˚ 2, 2. if the interface covers an area smaller than 1000A 3. if the protein has either an intertwining or a “rough”, i.e. a non-planar interface according to Equation (5) of Zellner et al. and associated comment4 and 4. if a multiple sequence alignment with at least 100 sequences is not available for the concerned protein. The results are presented in Figure 5.5 and Table 5.4. The receiver operating char4
˚ If more than 60% of the residues belonging to the interface had a distance dist pl ane of at most 6A, the interface was classified as planar.
87
5.3. ASSESSING THE PERFORMANCE OF FEATURE COMBINATIONS acteristic (ROC) of PresCont 5 was generated by comparing the results of PresCont with our reference labelings where a certain specified threshold of the PresCont method varied in [0.0, 1.0]. Method ∆F-CRF PresCont
area under curve (AUC) 0.885 0.842
Table 5.4: AUC results for the two methods. ∆F-CRF includes the node feature classes RASA and ∆F. Specifically, the ∆F-CRF surpasses the PresCont up to a FPR of about 50%. In contrast to the PresCont method the ∆F-CRF does not require a multiple sequence alignment. Moreover, the ∆F-CRF makes no planarity assumption about protein surfaces. The ROC of ∆F-CRF was plotted by varying the scalar α within the interval [−2, 2] in Algorithm (4.1). As a post-processing step to the inference algorithm, residues are filtered as non-interfaces if the corresponding RASA values are less or equal to 5% (Porollo and Meller 2007).
5.3
Assessing the performance of feature combinations
In this section, the procedure is discussed how the most promising feature combination predicting interaction interfaces using the PlaneDimers data was determined. Basically, a brute force approach was taken, that is program configurations were generated containing invocations of the ∆F-CRF program such that each possible feature class combination provided by the implementation6 were taken into account. In particular, each of the following figures were generated using the procedure defined in Sections 5.2 and 4.2. So, each point at a ROC curve was isolated trained given a feature combination, an edge inclusion radius δ and fixing the parameter α in Algorithm 4.1. The range of the parameter α was reduced to a third of its original range in order to reduce the overall required experimentation time. After training, 5
Experiments with the PresCont server were accomplished by Keyu Wang and the results thereof are provided on his permission. 6 The implementation of the ∆F-CRF is available at http://bioinf.uni-greifswald.de/ ppi.
88
CHAPTER 5. RESULTS the performance was then assessed using the separate holdout set following the procedure specified at the end of Section 4.2. By examining the results, the feature combination together with the chosen edge inclusion radius δ outperforming the others was used generating a final ROC curve as specified in Section 5.2. To select the final parameter set, the criterion discussed at the beginning of Section 5.2 – selecting the bin number τ – was used, together with the heuristic of extending linearly partial ROC curves by using the last curve slop where it were broken up. The latter is justified only by the simplicity of this procedure. In Figure 5.6 performance measures of different combinations using always the feature classes ∆F and rg as defined in Section 2 are shown. The numbers in the ˚ and 14A. ˚ The used feature class plot designate the chosen edge inclusion radii, 11A combinations are repeated in Table 5.5, ˚ δ [A] 11 14 14 14 14
Feature class combination rg, ∆F rg, ∆F, RASA, EPROS, nobin rg, ∆F, RASA, EPROS rg, ∆F, RASA rg, ∆F
Table 5.5: Feature class combination in order of their appearance in Figure 5.6. nobin denotes a program invocation setting the number of bins – as defined in Equations (2.3a),(2.6) – for each feature class and label to 1. where nobin denotes a program invocation which sets the number of bins – as defined in Equations (2.3a),(2.6) – for each feature class and label to 1. Surprisingly, starting approximately with point (0.14, 0.65) this feature configuration slightly outperforms the others. This might indicate that node features contribute differently given distinct parameter settings or vanishing influence as parameters are varied. This observation was not further examined. A similar set of experiments is
89
TPR
0.6
0.8
1.0
5.3. ASSESSING THE PERFORMANCE OF FEATURE COMBINATIONS
0.0
0.2
0.4
rg+DF 11.0 rg+DF+RASA+EPROS+nobin 14.0 rg+DF+RASA+EPROS 14.0 rg+DF+RASA 14.0 rg+DF 14.0
0.0
0.2
0.4
0.6
0.8
1.0
FPR (2013−05−16)
Figure 5.6: Assessing the performance improvement by combining feature classes ∆F and rg with others. depicted in Figure 5.7, but the feature class rg is combined with others. ˚ δ [A] 14 14 11 11
Feature class combination rg, ∆F rg, RASA rg, ∆F rg, RASA
Table 5.6: Feature class combination and edge inclusion radii in order of their appearance in Figure 5.7. The actual feature class combination together with the chosen edge inclusion radii are given in Table 5.6. Clearly, the performance measures become better with 90
CHAPTER 5. RESULTS
TPR
0.6
0.8
1.0
growing δ value given a fixed feature combination. In Figure 5.8 the performance
0.0
0.2
0.4
rg+DF 14.0 rg+RASA 14.0 rg+DF 11.0 rg+RASA 11.0
0.0
0.2
0.4
0.6
0.8
1.0
FPR (2013−05−16)
Figure 5.7: Comparing performance values on combining feature class rg with others. values of different combinations of feature classes as defined in Section 2 are shown in comparison to the results of PresCont using PlaneDimers. The numbers in the ˚ The feature class plot designate the edge inclusion radius in this case fixed to 14A.
91
5.3. ASSESSING THE PERFORMANCE OF FEATURE COMBINATIONS combinations are repeated in Table 5.7. Feature class combination RASA, ∆F rg, RASA rg rg, ∆F rg, RASA, ∆F RASA Table 5.7: Feature class combination in order of their appearance in Figure 5.8.
0.6
0.8
1.0
As it can be deduced from Figure 5.8, the experiments revealed the superior feature combination RASA and ∆F which were then used for a complete benchmark test using the PlaneDimers data.
0.2
0.4
TPR
14.0, RASA+DF 14.0, rg+RASA 14.0, rg 14.0, rg+DF 14.0, rg+RASA+DF 14.0, RASA
0.0
PresCont
0.0
0.2
0.4
0.6
0.8
1.0
FPR (2013−05−24)
Figure 5.8: Partial ROC curves of various feature combinations used in ∆FCRF compared to the results of PresCont.
92
Chapter 6 Conclusion and Discussion The original purpose of this work is the prediction of residues in a protein that most likely participate in spatial protein-protein interactions which are of major interest to a large number of scientific disciplines. It is postulated that far-reaching understanding of the mechanisms underlying protein-protein interactions might grow from a sound and reliable knowledge of these residues forming the so-called interface. In the absence of direct measurements of interface residues which can be regarded acceptable in terms of time and cost, indirect measurements using methods that are well-designed software frameworks and which are able to incorporate signals deduced from a broad range of fields such as geometry, sequence conservation or spatial structure – to mention just a few – are methods of choice. The proposed CRF model and its implementation called ∆F-CRF represent such a software-based, modularized framework and is able to efficiently combine different observations and signals that might come from highly correlated sources. It is shown, that method and implementation achieve more accurate results than the PresCont server of Zellner et al. Zellner et al. 2011 in terms of area under the ROC which is considered as a state-of-the-art method. The results are better, if a low false positive rate is desired. PresCont assumes proteins with a plane surface and requires a multiple sequence alignment. Hence, ∆F-CRF is easier to use since it has fewer restrictions in terms of data prerequisites. ∆F-CRF only uses one free parameter to model spatial dependence. It is shown that considering more edges in the graph than just the edges along 93
the backbone increases accuracy. The optimum maximal distance between two ˚ in which case there are residues in order to be connected by an edge is around 9A roughly five times as many edges in the graph compared to the edges in the linearchain induced by the backbone. ∆F-CRF performs better than the linear-chain CRF by Li et al. (Li et al. 2007) on a broad set of proteins. The results show, that the number of edges in a graphical model has an essential influence on the prediction performance and that detailed modeling of the dependency structure between residues lead to increased performance even when simple existing features such as RASA alone are used. In the future, models with additional prior knowledge e.g. on the shape of protein-protein interfaces or the protein itself might increase accuracy, but then the demand for a meaningful training method having theoretically sound justification remains. Training and refining the models Based on these considerations, it is suggested to examine the training methods further. In this work, a Large-Margin principle is proposed estimating the parameters of the CRF model practically done by the online large-margin algorithm and that indeed showed superior results compared to the traditionally used maximum likelihood principle. Nevertheless, a lot of manual parameter selections remain – e.g. the construction of the model graph H(χ, K) – which might point into the direction of using models that are able to incorporate probabilistic setting at one hand but that are in turn able to encode non-probabilistic considerations. Furthermore, it is reasonable to restrict the set of labelings used within the CRF models by excluding subsets of them. Elegantly, this should be explicitly achieved in the training phase, not by manual decision as proposed e.g. in the sections specifying exact methods computing the maximum probability labeling or the partition sum.
94
Bibliography Ambainis, Andris, Yuval Filmus, and Franc¸ois Le Gall (2014). “Fast Matrix Multiplication: Limitations of the Laser Method”. In: CoRR abs/1411.5414. Arkin, M. R. and J. A. Wells (2004). “Small-molecule inhibitors of protein-protein interactions: progressing towards the dream”. In: Nat Rev Drug Discov 3.4, pp. 301– 317. Aytuna, A. Selim, Attila Gursoy, and Ozlem Keskin (2005). “Prediction of proteinprotein interactions by combining structure and sequence conservation in protein interfaces.” In: Bioinformatics (Oxford, England) 21.12, pp. 2850–2855. issn: 1367-4803. Baxter, Rodney J. (1982). Exactly solved models in statistical mechanics. London: Academic Press. isbn: 0-12-083180-5. Bernal, Axel et al. (2007). “Global discriminative learning for higher-accuracy computational gene prediction”. In: PLoS Comput Biol 3.3, e54. Bodlaender, Hans L. (1996). “A linear time algorithm for finding tree decompositions of small treewidth”. In: SIAM J. Comput. 25.6, pp. 1305–1317. issn: 00975397. Boykov, Yuri, Olga Veksler, and Ramin Zabih (1999). “A new algorithm for energy minimization with discontinuities”. In: Energy Minimization Methods in Computer Vision and Pattern Recognition. Springer, pp. 205–220. Bradford, J.R. and D.R. Westhead (2005). “Improved prediction of protein-protein binding sites using a support vector machines approach”. In: Bioinformatics 21. Burgoyne, Nicholas J. and Richard M. Jackson (2006). “Predicting protein interaction sites: binding hot-spots in protein-protein and protein-ligand interfaces.” In: Bioinformatics 22.11, pp. 1335–1342. Crammer, Koby, Ryan Mcdonald, and Fernando Pereira (2005). Scalable large-margin online learning for structured classification. Tech. rep. Desmet, Johan et al. (1992). “The dead-end elimination theorem and its use in protein side-chain positioning”. In: Nature 356.6369, pp. 539–542. issn: 0028-0836.
95
BIBLIOGRAPHY Diestel, R. (1996). Graphentheorie. Springer-Lehrbuch. Springer. isbn: 9783540609186. Flach, Boris (2002). Strukturelle Bilderkennung. (in Deutsch). Habilitationsschrift, TU Dresden. — (2013). “A class of random fields on complete graphs with tractable partition function”. In: IEEE Transactions on Pattern Recognition Analysis and Machine Intelligence. Accepted for publication. Ford, L. R. jun. and D. R. Fulkerson (1962). Flows in networks. With a new foreword by Robert G. Bland and James B. Orlin. Reprint of 1962 original. English. Princeton Landmarks in Mathematics. Princeton, NJ: Princeton University Press. 208 p., 2011. Freund, Yoav and RobertE. Schapire (1999). “Large margin classification using the Perceptron algorithm”. In: Machine Learning 37.3, pp. 277–296. issn: 0885-6125. Gallet, X. et al. (2000). “A fast method to predict protein interaction sites from sequences.” In: J Mol Biol 302.4, pp. 917–926. Hildebrandt, Andreas et al. (2010). “BALL - biochemical algorithms library 1.3”. In: BMC Bioinformatics 11, p. 531. Ishikawa, H. and D. Geiger (1998). “Segmentation by grouping junctions”. In: Proceedings of the IEEE Computer Society Conference on Computer Vision and Pattern Recognition. CVPR ’98. Washington, DC, USA: IEEE Computer Society, pp. 125–. isbn: 0-8186-8497-6. Jones, S. and J.M. Thornton (1996). “Principles of protein-protein interactions”. In: Proc. Natl. Acad. Sci. USA 93, pp. 13–20. Keskin, Ozlem et al. (2004). “A new, structurally nonredundant, diverse data set of protein-protein interfaces and its implications”. In: Protein Science 13, pp. 1043– 1055. Klenin, Konstantin V. et al. (2011). “Derivatives of molecular surface area and volume: Simple and exact analytical formulas”. In: Journal of Computational Chemistry 32.12, pp. 2647–2653. issn: 1096-987X. Koike, A. and T. Takagi (2004). “Prediction of protein-protein interaction sites using support vector machines”. In: Protein Engineering Design and Selection 17. Koller, Daphne and Nir Friedman (2009). Probabilistic Graphical Models: Principles and Techniques - Adaptive Computation and Machine Learning. The MIT Press. isbn: 0262013193, 9780262013192. Kolmogorov, Vladimir and Ramin Zabih (2004). “What energy functions can be minimized via graph cuts”. In: IEEE Transactions on Pattern Analysis and Machine Intelligence 26, pp. 65–81.
96
BIBLIOGRAPHY Kortemme, T. and D. Baker (2002). “A simple physical model for binding energy hot spots in protein-protein complexes”. In: Proc. Natl. Acad. Sci. U.S.A. 99.22, pp. 14116–14121. Lafferty, John D., Andrew McCallum, and Fernando C. N. Pereira (2001). “Conditional random fields: probabilistic models for segmenting and labeling sequence data”. In: ICML. Ed. by Carla E. Brodley and Andrea Pohoreckyj Danyluk. Morgan Kaufmann, pp. 282–289. isbn: 1-55860-778-1. Li, J. J. et al. (2006). “Identifying protein-protein interfacial residues in heterocomplexes using residue conservation scores.” In: Int J Biol Macromol 38.3-5, pp. 241–247. issn: 0141-8130. Li, Ming-Hui et al. (2007). “Protein-protein interaction site prediction based on conditional random fields”. In: Bioinformatics 23.5, pp. 597–604. Lijnzaad, P., H.J.C. Berendsen, and P. Argos (1996). “A method for detecting hydrophobic patches on protein surfaces.” In: Proteins 26.2, pp. 192–203. Lu, S.M. et al. (2001). “Predicting the reactivity of proteins from their sequence alone: Kazal family of protein inhibitors of serine proteinases.” In: Proc Natl Acad Sci U S A 98.4, pp. 1410–5. Miller, S. (1989). “The structure of interfaces between subunits of dimeric and tetrameric proteins.” In: Protein engineering 3.2, pp. 77–83. Mooij, Joris M. (2010). “libDAI: a free and open source C++ library for discrete approximate inference in graphical models”. In: J. Mach. Learn. Res. 11, pp. 2169– 2173. issn: 1532-4435. Neuvirth, Hani, Ran Raz, and Gideon Schreiber (2004). “ProMate: a structure based prediction program to identify the location of protein-protein binding sites”. In: Journal of Molecular Biology 338. Ofran, Y. and B. Rost (2003). “Predicted protein-protein interaction sites from local sequence information.” In: FEBS Lett 544.1-3, pp. 236–239. issn: 0014-5793. — (2007). “ISIS: interaction sites identified from sequence.” In: Bioinformatics 23.2, pp. 13–16. Porollo, Aleksey and Jarosfjaw Meller (2007). “Prediction-based fingerprints of proteinprotein interactions”. In: Proteins: Structure, Function, and Bioinformatics 66.3, pp. 630–645. issn: 1097-0134. Reˇs, I., I. Mihalek, and O. Lichtarge (2005). “An evolution based classifier for prediction of protein interfaces without using protein structures”. In: Bioinformatics 21.10, pp. 2496–2501. issn: 1367-4803. Rohl, Carol A. et al. (2004). “Protein structure prediction using Rosetta”. In: Numerical Computer Methods, Part D. Vol. 383. Methods in Enzymology. Elsevier, pp. 66–93. isbn: 9780121827885. 97
BIBLIOGRAPHY Rosenfeld, A., R. Hummel, and S. Zucker (1976). “Scene labeling by relaxation operations”. In: IEEE Trans. on Systems, Man, and Cybernetics 6.6, pp. 173–184. Schlesinger, Dmitrij and Boris Flach (2006). Transforming an arbitrary minsum problem into a binary one. Tech. rep. TU Dresden. Schlesinger, M.I. and V. Hlav´ac (2002). Ten lectures on statistical and structural pattern recognition. Computational Imaging and Vision Series. Kluwer Academic Pub. isbn: 9781402006425. Schlesinger, Michail I and Boris Flach (2000). “Some solvable subclasses of structural recognition problems”. In: Czech Pattern Recognition Workshop 2000, pp. 55– 62. Shlezinger, Dimitrij (2005). Strukturelle Ans¨atze f¨ur die Stereorekonstruktion. (in Deutsch). Dissertation, TU Dresden. Sowa, Mathew E. et al. (2001). “Prediction and confirmation of a site critical for effector regulation of RGS domain activity”. In: Nat. Struct. Biol. 8, pp. 234– 237. Sugaya, Nobuyoshi and Kazuyoshi Ikeda (2009). “Assessing the druggability of protein-protein interactions by a supervised machine-learning method.” In: BMC bioinformatics 10.1, pp. 263+. issn: 1471-2105. Sugaya, Nobuyoshi et al. (2007). “An integrative in silico approach for discovering candidates for drug-targetable protein-protein interactions in interactome data”. In: BMC Pharmacology 7, pp. 10+. issn: 1471-2210. Veksler, Olga (1999). “Efficient graph-based energy minimization methods in computer vision”. PhD thesis. Ithaca, NY, USA. isbn: 0-599-41334-4. wwPDB (2012). “Atomic coordinate entry format description”. In: Protein Data Bank Contents Guide, volume 3.3. Yan, Changhui, Drena Dobbs, and Vasant Honavar (2004b). “A two-stage classifier for identification of protein-protein interface residues.” In: ISMB/ECCB (Supplement of Bioinformatics), pp. 371–378. — (2004a). “A two-stage classifier for identification of protein-protein interface residues.” In: Bioinformatics (Oxford, England) 20 Suppl 1. issn: 1367-4811. Yedidia, J. S., W. T. Freeman, and Y. Weiss (2005). “Constructing free-energy approximations and generalized belief propagation algorithms”. In: IEEE Trans. Inf. Theor. 51.7, pp. 2282–2312. issn: 0018-9448. Yedidia, J.S., W.T. Freeman, and Y. Weiss (2003). “Understanding belief propagation and its generalizations”. In: Exploring Artificial Intelligence in the New Millennium. Ed. by G. Lakemeyer and B. Nebel. Morgan Kaufmann Publishers. Chap. 8, pp. 239–236.
98
BIBLIOGRAPHY Yin, H. and A. D. Hamilton (2005). “Strategies for targeting protein-protein interactions with synthetic agents”. In: Angewandte Chemie (International ed.) 44.27, pp. 4130–4163. issn: 1433-7851. Zellner, Hermann et al. (2011). “PresCont: predicting protein-protein interfaces utilizing four residue properties”. In: Proteins: Structure, Function and Bioinformatics. Zhou, H.-X (2004). “Improving the understanding of human genetic diseases through predictions of protein structures and protein-protein interaction sites”. In: Curr. Med. Chem. 11, pp. 539–549. Zhou, H.-X. and S. Qin (2007). “Interaction-site prediction for protein complexes: a critical assessment”. In: Bioinformatics 23.
99
Ver¨offentlichungen und andere wissenschaftliche Leistungen [1] Wierschin, Torsten and Stanke, Mario Predicting protein interfaces by modeling spatial structure. German Conference on Bioinformatics, poster presentation, 2012 [2] Wierschin, Torsten and Wang, Keyu and Welter, Marlon and Waack, Stephan and Stanke, Mario Combining features in a graphical model to predict protein interaction sites. German Conference on Bioinformatics, poster presentation, 2013 [3] Dong, Zhijie and Wang, Keyu and Linh Dang, Truong K. and G¨ultas, Mehmet and Welter, Marlon and Wierschin, Torsten and Stanke, Mario and Waack, Stephan CRF-based models of protein surfaces improve protein-protein interaction site predictions. BMC Bioinformatics, 15(1), 2014 [4] Wierschin, Torsten and Wang, Keyu and Welter, Marlon and Waack, Stephan and Stanke, Mario Combining features in a graphical model to predict protein interaction sites. PROTEINS: Structure, Function, and Bioinformatics, 83(5), 2015
Danksagung Herrn Prof. Dr. Mario Stanke danke ich f¨ur die kooperative Betreuung der vorliegenden Arbeit, welche nichtsdestotrotz eine best¨andig fordernde Betreuung war. Seine kritischen Hinweise zur mathematisch-pr¨azisen Formulierung und originellen L¨osungsideen zu Aufgaben im Gebiet der Bioinformatik sowie im Speziellen der hier betrachteten Protein-Protein Wechselwirkungsvorhersage hielten das Interesse des Autors u¨ ber den gesamten Bearbeitungszeitraum wach und wiesen der wissenschaftlichen Arbeit die Richtung. Mein Dank gilt den Kollegen in der Bioinformatik-Gruppe am Institut f¨ur Mathematik und Informatik an der Ernst-Moritz-Arndt-Universit¨at Greifswald f¨ur viele, anregende Diskussionen und im Besonderen Frau Dr. Katharina Hoff, Frau Stefanie K¨onig und Herrn Dr. Tonatiuh Pena Centeno. Frau Stefanie K¨onig und Herr Dr. Tonatiuh Pena Centeno halfen zudem, die Lesbarkeit das Manuskript deutlich zu verbessern. Ebenfalls Dank gilt Herrn Prof. Dr. Stephan Waack an der GeorgAugust-Universit¨at G¨ottingen sowie seinen Mitarbeitern Keyu Wang, Dr. Mehmet G¨ultas und Marlon Welter, mit denen sich eine f¨ur beide Seiten gewinnbringende und zielorientierte Zusammenarbeit gestaltete. Torsten Wierschin Greifswald, September 2014