An atom is simply a tuple that contains a description of the source of a statement. .... uncompressed data took 20 hours, while it completed in 30m on a database using ...... Journal of the ACM, 31:761â791, October .... dbxref.xref_dbname='FB'.
Approximate Lineage for Probabilistic Databases University of Washington Technical Report UW TR: #TR2008-03-02
Christopher R´e and Dan Suciu {chrisre,suciu}@cs.washington.edu
Abstract In probabilistic databases, lineage is fundamental to both query processing and understanding the data. Current systems s.a. Trio or Mystiq use a complete approach in which the lineage for a tuple t is a Boolean formula which represents all derivations of t. In large databases lineage formulas can become huge: in one public database (the Gene Ontology) we often observed 10MB of lineage (provenance) data for a single tuple. In this paper we propose to use approximate lineage, which is a much smaller formula keeping track of only the most important derivations, which the system can use to process queries and provide explanations. We discuss in detail two specific kinds of approximate lineage: (1) a conservative approximation called sufficient lineage that records the most important derivations for each tuple, and (2) polynomial lineage, which is more aggressive and can provide higher compression ratios, and which is based on Fourier approximations of Boolean expressions. In this paper we define approximate lineage formally, describe algorithms to compute approximate lineage and prove formally their error bounds, and validate our approach experimentally on a real data set.
1
Introduction In probabilistic databases, lineage is fundamental to processing probabilistic queries and understanding the data. Many
state-of-the-art systems use a complete approach, e.g. Trio [7] or Mystiq [16, 46], in which the lineage for a tuple t is a Boolean formula which represents all derivations of t. In this paper, we observe that for many applications, it is often unnecessary for the system to painstakingly track every derivation. A consequence of ignoring some derivations is that our system may return an approximate query probability such as 0.701 ± 0.002, instead of the true value of 0.7. An application may be able to tolerate this difference, especially if the approximate answer can be obtained significantly faster. A second 1
Process (P) (t1 ) (t2 ) (t3 ) (t4 ) (t5 )
Gene Product Process AGO2 “Cell Death” AGO2 “Embryonic Development” AGO2 “Gland development” Aac11 “Cell Death” Aac11 “Embroynic Development” Level I DB (Complete Lineage)
Annotations (Atoms) λ x1 x1 x2 x2 x3
Atom x1 x2 x3
Code TAS NAS IEA
Description “Dr. X’s PubMed PMID:12593804” “Dr. Y’s RA Private Communication” “Inferred from Computational Similarity”
Level II Lineage (Approximate) Type Lineage Formula Sufficient λ˜ St6 = x1 ∧ x2 Arithmetization λ˜ tA6 = x1 (1 − (1 − x2 )(1 − x3 )) 21 9 33 + 32 (x2 − 14 ) + 16 (x3 − 81 ) Polynomial λ˜ tP6 = 128
V(y) D P(x, y), P(‘Aac11’, y), x , ‘Aac11’ Gene Product λ (t6 ) AGO2 (x1 ∧ x2 ) ∨ (x1 ∧ x3 )
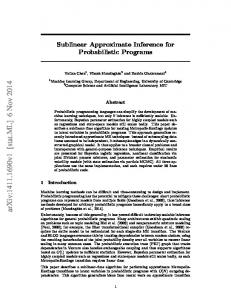
Figure 1. Process (P) relates each gene product to a process, e.g. AG02 is involved in “cell death”. Each tuple in Process has an annotation from the set of atoms. An atom, xi for i = 1, 2, 3, is a piece of evidence that has an associated probability, e.g. x1 is the proposition that we trust “Dr. X.’s PubMed article PMID:12593804”, which we assign probability 34 . V is a view that asks for “Gene Products that share a process with a product ‘Aac11”’. Below V’s definition is its output in the original database with a complete approach. At the right examples of approximate lineage functions we consider are listed. The compressed database is obtained by replacing λ with one of these functions, e.g. λ˜ St6 . This database is inspired by the Gene Ontology (GO) database [14].The terms (Level I) and (Level II) are specific to our approach and defined in (Sec. 1.1).
issue is that although a complete lineage approach explains all derivations of a tuple, it does not tell us which facts are the most influential in that derivation. In large data sets, a derivation may become extremely large because it aggregates together a large number of individual facts. This makes determining which individual facts are influential an important and non-trivial task. With these observations in mind, we advocate an alternative to complete lineage called approximate lineage. Informally, the spirit of approximate lineage is to compress the data by tracking only the most influential facts in the derivation. This approach allows us to both efficiently answer queries, since the data is much smaller, and also to directly return the most important derivations. We motivate our study of approximate lineage by discussing two application domains: (1) large scientific databases and (2) similarity data. We show that approximate lineage can compress the data by up to two orders of magnitude, e.g. 100s of MB to 1MB, while providing high-quality explanations. Application (1): Large Scientific databases In large scientific databases, lineage is used to integrate data from several sources [12]. These sources are combined by both large consortia, e.g. [14], and single research groups. A key challenge faced by scientists is that facts from different sources may not be trusted equally. For example, the Gene Ontology Database (GO) [14] is a large (4GB) freely available database of genes and proteins that is integrated by a consortium of researchers. For scientists, the most important data stored in GO is a set of associations between proteins and their functions. These associations are integrated by GO from many sources, such as PubMed articles [45], raw experimental data, data from SWISS-PROT [9], and automatically inferred matchings. GO tracks the provenance of each association, using what we call
2
P 3 4 1 4 1 8
atoms. An atom is simply a tuple that contains a description of the source of a statement. An example atom is “Dr. X’s PubMed article PMID:12593804”. Tracking provenance is crucial in GO because much of the data is of relatively low quality: approximately 96% of the more than 19 million atoms stored in GO are automatically inferred. To model these trust issues, our system associates each atom with a probability whose value reflects our trust in that particular annotation. Fig. 1 illustrates such a database. Example 1.1 A statement derivable from GO is, “Dr. X claimed in PubMed PMID:12593804 that the gene Argonaute2 (AGO2) is involved in cell death”[26]. In our model, one way to view this is that there is a fact, the gene Argonaute2 is involved in cell death and there is an atom, Dr. X made the claim in PubMed PMID:12593804. If we trust Dr. X, then we assign a high confidence value to this atom. This is reflected in Fig. 1 since the atom, x1 , has a high probability, 34 . More complicated annotations can be derived, e.g. via query processing. An example is the view V in Fig. 1, that asks for gene products that share a process with the gene ‘Aac11’. The tuple, AGO2 (t6 ), that appears in V is derived from the facts that both AGO2 and Aac11 are involved in “cell death” (t1 and t4 ) and “embryonic development” (t2 and t5 ); these tuples use the atoms x1 (twice), x2 and x3 shown in the Annotations table. A benefit of annotating the data with confidence scores is that the scientist can now obtain the reliability of each query answer. To compute the reliability value in a complete approach, we may be forced to process all the lineage for a given tuple. This is challenging, because the lineage can be very large. This problem is not unique to GO. For example, [13] reports that a 250MB biological database has 6GB of lineage. In this work, we show how to use approximate lineage to effectively compress the lineage more than two orders of magnitude, even for extremely low error rates. Importantly, our compression techniques allow us to process queries directly on the compressed data. In our experiments, we show that this can result in up to two orders of magnitude more efficient processing than a complete approach. An additional important activity for scientists is understanding the data; the role of the database in this task is to provide interactive results to hone the scientist’s knowledge. As a result, we cannot tolerate long delays. For example, the lineage of even a single tuple in the gene ontology database may be 9MB. Consider a scientist who finds the result of V in Fig 1 surprising: One of her goals may be to find out why t6 is returned by the system, i.e. she wants a sufficient explanation as to why AGO2 was returned. The system would return that the most likely explanation is that we trust Dr.X that AGO2 is related to cell death (t1 ) and Dr.Y’s RA that Aac11 is also related to cell death (t4 ). An alternative explanation uses t1 and the automatic similarity computation (t5 ). However, the first explanation is more likely, since the annotation associated with t4 (x2 ) is more likely than the annotation of t5 (x3 ), here
1 4
= p(x2 ) ≥ p(x3 ) = 18 .
A scientist also needs to understand the effect of her trust policy on the reliability score of t6 . Specifically, she needs to know which atom is the most influential to computing the reliability for t6 . In this case, the scientist is relatively sure that AGO2 is associated with cell death, since it is assigned a score of 43 . However, the key new clement leading to this surprising result is that Aac11 is also associated “cell death”, which is supported by the atom x2 , the statement of Dr. Y’s RA. 3
Concretely, x2 is the most influential atom because changing x2 ’s value will change the reliability of t6 more than changing any other atom. In our experiments, we show that we can find sufficient explanations with high precision, e.g. we can find the top 10 influential explanations with between 70% and 100% accuracy. Additionally, we can find influential atoms with high precision (80% − 100% of the top 10 influential atoms). In both cases, we can conduct these exploration tasks without directly accessing the raw data. Application (2): Managing Similarity Scores Applications that manage similarity scores can benefit from approximate lineage. Such applications include managing data from object reconciliation procedures [3, 34] or similarity scores between users, such as iLike.com. In iLike, the system automatically assigns a music compatibility score between friends. The similarity score between two users, e.g. Bob and Joe, has a lineage: It is a function of many atomic facts, e.g. which songs they listen to and how frequently, which artists they like, etc. All of these atomic facts are combined into a single numeric score which is then converted into quantitative buckets, e.g. high, medium and low. Intuitively, to compute such rough buckets, it is unnecessary to precisely maintain every bit of lineage. However, this painstaking computation is required by a complete approach. In this paper, we show how to use approximate lineage to effectively compress object reconciliation data in the IMDB database [35].
1.1
Overview of our Approach
At a high level, both of our example applications, large scientific data and managing similarity scores, manage data that is annotated with probabilities. In both applications, we propose a two-level architecture: The Level I database is a large, high-quality database that uses a complete approach and is queried infrequently. The Level II database is much smaller, and uses an approximate lineage system. A user conducts her query and exploration tasks on the Level II database, which is the focus of this paper. The key technical idea of this work is approximate lineage, which is a strict generalization of complete lineage. Abstractly, lineage is a function λ that maps each tuple t in a database to a Boolean formula λt over a fixed set of Boolean atoms. For example in Fig. 1, the lineage of the tuple t6 is λt6 = (x1 ∧ x2 ) ∨ (x1 ∧ x3 ). In this paper, we propose two instantiations of approximate lineage: a conservative approximation, sufficient lineage, and a more aggressive approximation, polynomial lineage. In sufficient lineage, each lineage function is replaced with a smaller formula that logically implies the original. For example, a sufficient lineage for t6 is λ˜ St6 = x1 ∧ x2 . The advantage of sufficient lineage is that it can be much smaller than standard lineage, which allows query processing and exploration takes to proceed much more efficiently. For example, in our experiments processing a query on an uncompressed data took 20 hours, while it completed in 30m on a database using sufficient lineage. Additionally, understanding query reliability is easy with sufficient lineage: the reliability computed for a query q is always less than or equal to the reliability computed on the original Level I database. However, only monotone
4
lineage functions can be represented by a sufficient approach. The second generalization is polynomial lineage which is a function that maps each tuple t in a database to a real-valued polynomial on Boolean variables, denoted λ˜ tP . An example polynomial lineage is λ˜ tP6 in Fig. 1. There are two advantages of using real-valued polynomials instead of Boolean-valued functions: (1) powerful analytic techniques already exist for understanding and approximating real-valued polynomials, e.g. Taylor series or Fourier Series, and (2) any lineage function can be represented by polynomial approximate lineage. Polynomial lineage functions can allow a more accurate semantic than sufficient lineage in the same amount of space, i.e. , the difference in value between computing q on the Level I and Level II database is small. In Sec. 5 we demonstrate a view in GO such that polynomial lineage achieves a compression ratio of 171 : 1 and sufficient lineage achieves 27 : 1 compression ratio with error rate less than 10−3 (Def. 2.10). Although polynomial lineage can give better compression ratios and can be applied to a broader class of functions, there are three advantages of sufficient lineage over polynomial lineage: (1) sufficient lineage is syntactically identical to complete lineage, and so can be processed by existing probabilistic relational databases without modification, e.g. Trio and Mystiq. (2) The semantic of sufficient lineage is easy to understand since the value of a query is a lower bound of the true value, while a query may have either a higher or lower value using polynomial lineage. (3) Our experiments show that sufficient lineage is less sensitive to skew, and can result in better compression ratios when the probability assignments to atoms are very skewed. In both lineage systems, there are three fundamental technical challenges: creating it, processing it and understanding it. In this paper, we study these three fundamental problems for both forms of approximate lineage.
1.2
Contributions, Validation and Outline
We show that we can (1) efficiently construct both types of approximate lineage, (2) process both types of lineage efficiently and (3) use approximate lineage to explore and understand the data. • In Sec. 2, we define the semantics of approximate lineage, motivate the technical problems that any approximate lineage system must solve and state our main results. The technical problems are: creating approximate lineage (Prob. 1); explaining the data, i.e. finding sufficient explanations (Prob. 2), finding influential variables (Prob. 3); and query processing with approximate lineage (Prob. 4). • In Sec. 3, we define our implementation for one type of approximate lineage, sufficient lineage. This requires that we solve the three problems above: we give algorithms to construct it (Sec. 3.2), to use it to understand the data (Sec. 3.3), and to process further queries on the data (Sec. 3.4). • In Sec. 4, we define our proposal for polynomial approximate lineage; our proposal brings together many previous results in the literature to give algorithms to construct it (Sec. 4.2), to understand it (Sec. 4.3) and to process it.
5
• In Sec. 5, we provide experimental evidence that both approaches work well in practice; in particular, we show that approximate lineage can compress real data by orders of magnitude even with very low error, (Sec. 5.2), provide high quality explanations (Sec. 5.3) and provide large performance improvements (Sec. 5.4). Our experiments use data from the Gene Ontology database [14, 53] and a probabilistic database of IMDB [35] linked with reviews from Amazon. We discuss related work in Sec. 6 and conclude in Sec. 7.
2
Statement of Results We first give some background on lineage and probabilistic databases, and then formally state our problem with examples.
2.1
Preliminaries: Queries and Views
In this paper, we consider conjunctive queries and views written in a datalog-style syntax. A query q is a conjunctive rule written q D g1 , . . . , gn where each gi is a subgoal, that is, a relational predicate. For example, q1 D R(x), S (x, y, ‘a’) defines a query with a join between R and S , a variable y that is projected away, and a constant ‘a’. For a relational database W, we write W |= q to denote that W entails q.
2.2
Lineage and Probabilistic Databases
In this section, we adopt a viewpoint of lineage similar to c-tables [29, 36]; we think of lineage as a constraint that tells us which worlds are possible. This viewpoint results in the standard possible worlds semantics for probabilistic databases [16, 20, 29]. Definition 2.1 (Lineage Function). An atom is a Boolean proposition about the real world, e.g. Bob likes Herbie Hancock. Fix a relational schema σ and a set of atoms A. A lineage function, λ, assigns to each tuple t conforming to some relation in σ, a Boolean expression over A, which is denoted λt . An assignment is a function A → {0, 1}. Equivalently, it is a subset of A, denoted A, consisting of those atoms that are assigned true. Fig. 1 illustrates tuples and their lineages. The atoms represent propositions about data provenance. For example, the atom x1 in Fig. 1 represents the proposition that we trust “Dr. X’s PubMed PMID:12593804”. Of course, atoms can also represent more coarsely grained propositions, “A scientist claimed it was true” or finely-grained facts “Dr. X claimed it in PubMed 18166081 on page 10”. In this paper, we assume that the atoms are given; we briefly discuss this at the end the current section.. To define the standard semantics of lineage, we define a possible world W through a two-stage process: (1) select a subset of atoms, A, i.e. an assignment, and (2) For each tuple t, if λt (A) evaluates to true then t is included in W. This process results in an unique world W for any choice of atoms A. 6
Example 2.2 If we select A13 = {x1 , x3 }, that is, we trust Dr. X and Dr. Y’s RA, but distrust the similarity computation, then W1256 = {t1 , t2 , t5 , t6 } is the resulting possible world. The reason is that for each ti ∈ W1256 , λti is satisfied by the assignment corresponding to A13 and for each t j < W1256 , λt j is false. In contrast, W125 = {t1 , t2 , t5 } is not a possible world because in W125 , we know that AGO2 and Aac11 are both associated with Cell Death, and so AGO2 should appear in the view (t6 ). In symbols, λt6 (W125 ) = 1, but t6 < W125 . We capture this example in the following definition: Definition 2.3. Fix a schema σ. A world is a subset of tuples conforming to σ. Given a set of atoms A and a world W, we say that W is a possible world induced by A if it contains exactly those tuples consistent with the lineage function, that is, for all tuples t, λt (A) ⇐⇒ t ∈ W. Moreover, we write λ(A, W) to denote the Boolean function that takes value 1 if W is a possible world induced by A. In symbols, ^
def
λ(A, W) =
^
λt (A)
t:t∈W
(1 − λt (A))
(1)
t:t 0, there exists a sub-formula φ˜ of size f (k, δ) such that µ(q) − E[φ] �
simply ensure that the atoms in these monomials are present.
This shows that sufficient lineage can be effectively utilized for query processing, solving Prob. 4. It is an interesting open question to find such lineage that works for many queries simultaneously. Example 3.8 Our current lineage approach uses only local knowledge, but we illustrate why some global knowledge may be required to construct lineage that is good for even simple queries. Consider a database with n tuples and a single relation R = {t1 , . . . , tn } and the lineage of tuple λtt = x0 ∨ xi . A sufficient lineage database could be λ˜ ti = x0 for each i. Notice, that the query q D R(x) on the sufficient lineage database is then x0 while the formuls on the level I databas is x0 ∨ x1 · · · ∨ xn . A potentially much larger probabilitity.
18
4
Polynomial Lineage In this section, we propose an instantiation of polynomial lineage based on sparse low-total-degree polynomial series. We
focus on the problems of constructing lineage and understanding lineage, since there are existing approaches, e.g. [8], that solve the problem of sampling from lineage, which is sufficient to solve the query evaluation problem (Prob. 4).
4.1
Sparse Fourier Series
Our goal is to write a Boolean function as a sum of smaller terms; this decomposition is similar to Taylor and Fourier series decompositions in basic calculus. We recall the basics of Fourier Series on the Boolean Hypercube1 . In our discussion, we fix a set of independent random variables x1 , . . . , xn , e.g. the atoms, where pi = E[xi ] (the expectation) and σ2i = pi (1 − pi ) (the variance). Let B be the vector space of real-valued Boolean functions on n variables; a vector in this space is a function λ : {0, 1}n → R. Rather than the standard basis for B, we define the Fourier basis for functions. def
To do so we equip B with an inner product that is defined via expectation, that is, hλ1 , λ2 i = E[λ1 · λ2 ]. This inner product
2 def induces a norm, kλt k2 = hλt , λt i. This norm captures our error function (see Def. 2.10) since E[(λt − λ˜ tP )2 ] =
λ˜ t − λ˜ tP
. We can now define an orthonormal basis for the vector space using the set of characters: Definition 4.1. For each z ∈ {0, 1}n , the character associated with z is a function from {0, 1}n → R denoted φ z and defined as: def
φz =
Y
(xi − pi )σ−1 i
i:zi =1
Since the set of all characters is an orthonormal basis, we can write any function in B as a sum of the characters. The coefficient of a character is given by projection on to that character, as we define below. Definition 4.2. The Fourier transform of a function λt is denoted Fλt and is a function from {0, 1}n → R defined as: def
Fλt (z) = hλt , φ z i = E[λt φ z ]
The Fourier series of f is defined as
P
z∈{0,1}n Fλt (z)φ z (A).
The Fourier series captures λt , that is, for any assignment A, f (A) =
P
z∈{0,1}n Fλt (z)φ z (A). An important coefficient is
Fλt (0), which is the probability (expectation) of λt . We give an example of to illustrate the computation of Fourier series: Example 4.3 Let λt = x1 ∨ · · · ∨ xn , that is, the logical or of independent n random variables. The arithmetization for λt is 1 For
more details, see [40, 43]
19
1−
Q
i=1,...,n (1
− xi ). Applying Def. 4.2, Fλt (0) = E[λt ] = 1 − Fλt (z) = = =
Q
i=1,...,n (1
− p(xi )) and for z , 0:
h � �i Q E φ z 1 − i=1,...,n (1 − xi ) h �Q � �Q �i E φz − i:zi =1 φei (1 − xi ) j:z j =0 (1 − x j ) �Q � �Q � i:zi =1 σi j:z j =0 (1 − p(x j ))
where for i = 1, . . . , n, σ2i = p(xi )(1 − p(xi )) (the variance of xi ). Our goal is to get a small, but good approximation; we make this goal precise using sparse Fourier series: Definition 4.4. An s-sparse series is a Fourier series with at most s non-zero coefficients. We say λ has an (s, ε) approxi
2 mation if there exists an s-sparse approximation λ˜ tP such that
λt − λ˜ tP
≤ ε. A best s-sparse series for a function λ is the s-sparse series that minimizes ε. Our approach for polynomial lineage is to approximate the lineage for a tuple t, λt , by a sparse Fourier series λ˜ tP , ideally an (s, ε)-sparse approximation for small s and ε. Additionally, we want λ˜ tP to have low total degree (constant) so we can describe its coefficients succinctly (in constant space). Selecting an approximation The standard approach to approximation using series is to keep only the largest coefficients, which is optimal in this case: Proposition 4.5. For any Boolean function λt and any s > 0, a best s-spare approximation for λt is the s largest coefficients in absolute value, ties broken arbitrarily. P Proof. Let g be any t term approximation and S G be its non-zero coefficients then we can write: k f − gk2 = S g (Fλt (S ) − P Fλ2 (S ))2 + S¯ g Fλt (S )2 . Notice that S ∈ S g implies that Fλt (S ) = Fλ2 (S ), else we could get a strictly better approximation – thus, the best approximation consists of a subset of coefficients in the Fourier expansion. If it does not contain the largest in magnitude, we can switch a term from the right to the left sum, and get a strictly better approximation. Thus, all best �
approximations are of this form.
4.2
Constructing Lineage
We construct polynomial lineage by searching for the largest coefficients using the KM algorithm [39]. The KM algorithm is complete in the sense that if there is an (s, ε) sparse approximation it finds an only slightly worse (s, ε+ε2 /s) approximation. The key technical insight, is that k-DNFs do have sparse (and low-total-degree) Fourier series, [40, 51]. This implies we only need to keep around a relatively few coefficients to get a good approximation. More precisely,
20
Theorem 4.6 ([39, 40, 51]). Given a set of atoms A = {x1 , . . . , xn } and a probabilistic assignment p, let β = mini=1,...,n {p(xi ), 1 − p(xi )} and λt be a (not necessarily monotone) k-DNF function over A, then there exists an (s, ε)1 −1 approximation λ˜ tP where s ≤ kO(kβ log( ε )) and the total degree of any term in λ˜ tP is bounded by c0 β−1 k log( 1ε ) where c0 is
a constant. Further, we can construct λ˜ tP in randomized polynomial time. The KM algorithm is an elegant recursive search algorithm. However, a key practical detail is at each step it requires that we use a two-level estimator, that is, the algorithm requires that at each step, we estimate a quantity y1 via sampling; to compute each sample of y1 , we must, in turn, estimate a second quantity y2 via sampling. This can be very slow in practice. This motivates us to purpose a cheaper heuristic: For each monomial m, we estimate the coefficient corresponding to each subset of variables of m. For example, if m = x1 ∧ x2 , then we estimate 0, e1 , e2 and e12 . This heuristic takes time 2k |λt |, but can be orders of magnitude more efficient in practice, as we show in our evaluation section (Sec. 5.2). This is linear with respect to data complexity.
4.3
Understanding Approximate Lineage
Our goal in this section is to find sufficient explanations and influential variables, solving Prob. 2 and Prob. 3, respectively. Sufficient Explanations Let λt be a lineage formula such that E[λt ] ∈ (0, 1) and λ˜ tP be a polynomial approximation of λt . Given a monomial m, our goal is to test if m is a sufficient explanation for λt . The key idea is that m is a sufficient explanation if and only if P[λt ∧ m] = P[m], since this implies the implication holds for every assignment. If λ˜ tP is exactly the Fourier series for λt , then we can compute each value in time O(2k ), since Y Y E[λ˜ tP m] = Fλt (z) σ µ j z:zi =1 =⇒ i∈m i∈m: zi =1 j∈m: z j =0 X
(5)
However, often λt is complicated, which forces us to use sampling to approximate the coefficients of λ˜ tP . Sampling introduces noise in the coefficients. To tolerate noise, we relax our test: Definition 4.7. Let τ > 0, the tolerance, and δ > 0, the confidence, then we say that a monomial m is a (τ, δ) sufficient explanation for λ˜ tP if: PN [|E[λ˜ tP · m] − E[m] | ≤ τ] ≥ 1 − δ | {z }
(6)
(†)
where N denotes the distribution of the sampling noise. The intuition is that we want that E[λ˜ tP m] and E[m] to be close with high probability. For independent random sampling, the N is a set of normally distributed random variables, one for each coefficient. Substituting Eq. 5 into Eq. 6 shows that (†) is a sum of 2k normal variables, which is again normal; we use this fact to estimate the probability that (†) is less than τ.
21
Query V1 V2 V3 V4
Tables 8 6 6 7
# Evidence 2 2 1 1
# Tuples 1 1119 295K 28M
Avg. Lin. Size 234 1211 3.36 7.68
Size 12k 141M 104M 31G
Figure 2. Query statistics for the GO DB [14]. Our heuristic is straightforward, given a tolerance τ and a confidence δ: For each monomial m, compute the probability in Eq. 6, if it is within δ then declare m a sufficient explanation. Finally, rank each sufficient explanation by the probability of that monomial. Influential tuples The key observation is that the influence of xi is determined by its coefficient in the expansion [40, 51]: Proposition 4.8. Let λt be an internal lineage function, xi an atom and σ2i = p(xi )(1 − p(xi )) then Inf xi (λt ) = σ−1 i Fλt (ei )
This gives us a simple algorithm for finding influential tuples using polynomial lineage, simply scale each Fλt (ei ), sort them and return them. Further, the term corresponding to ei in the transform is Fλt (ei )φei = Inf xi (λt )(xi − p(xi )), as was shown in Fig. 1.
5
Experiments In this section, we answer three main questions about our approach: (1) In Sec. 5.2, do our lineage approaches compress
the data? (2) In Sec. 5.3, to what extent can we recover explanations from the compressed data? (3) In Sec. 5.4, does the compressed data provide a performance improvement while returning high quality answers? To answer these questions, we experimented with the Gene Ontology database [14] (GO) and similarity scores from a movie matching database [35, 46].
5.1
Experimental Details
Primary Dataset The primary dataset is GO, that we described in the introduction. We assigned probability scores to evidence tuples based on the type of evidence. For example, we assigned a high reliability score (0.9) to a statement in a PubMed article, while we assigned a low score (0.1) to an automated similarity match. Although many atoms are assigned the same score, they are treated as independent events. Additionally, to test the performance of our algorithms, we generated several probability values that were obtained from more highly skewed distributions, that are discussed in the relevant sections. Primary Views We present four views which are taken from the examples and view definitions that accompany the GO database [14]. The first view V1 asks for all evidence associated with a fixed pair of gene products. V2 looks for all terms 22
Number of Monomials [Logscale]
Compression Ratio (y:1) [logscale]
1000
Poly Suff
100
10
1 0.001
0.01
0.1
1
1e+06
DNF Size Sufficient Size
100000 10000 1000 100 10 1 0
100
200
Error
(a)
300 Rank
400
500
600
(b)
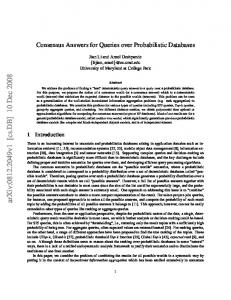
Figure 3. (a) Compression ratio as error increases in log scale for query V2. (b) Distribution of size of DNF for V2 with and without compression, x-axis is sorted by size, e.g. x = 1 is the largest DNF (823k).
associated with a fixed gene product. V3 is a view of all annotations associated with the Drosophila fly (via FlyBase [21]). V4 is a large view of all gene products and associated terms. Fig. 2 summarizes the relevant parameters for each view: (1) the number of tables in the view definition (2) the number of sources evidence, that is, how many times it joins with the evidence table (3) the number of tuples returned (4) the average of the lineage sizes for each tuple, and (5) the storage size of the result. Secondary Dataset To verify that our results apply more generally than the GO database, we examined a database that (fuzzily) integrated movie reviews from Amazon [2] that have been integrated with IMDB (the Internet Movie Database) [35]. This data has two sources of imprecision: matches of titles between IMDB and Amazon, ratings assigned to each movie by automatic sentiment analysis, that is, a classifier. Experimental Setup All experiments were run on a Fedora core Linux machine (2.6.23-14 SMP) with Dual Quad Core 2.66GHz 16Gb of RAM. Our prototype implementation of the compression algorithms was written in approximately 2000 lines of Caml. Query performance was done using a modified C++/caml version of the Mystiq engine[10] backed by databases running SQL Server 2005. The implementation was not heavily optimized.
5.2
Compression
We verify that our compression algorithms produce small approximate lineage, even for stringent error requirements. We measured the compression ratios and compression times achieved by our approaches for both datasets at varying errors. Compression Ratios Fig. 3(a) shows the compression ratio versus error trade-off achieved by polynomial and sufficient lineage for V2. Specifically, for a fixed error on the x-axis the y axis shows the compression ratio of the lineage (in log scale). As the graph illustrates, in the best case, V2, the compression ratio for the polynomial lineage is very large. Specifically,even for extremely small error rates, 10−3 , the compressed ratio 171 : 1 for polynomial lineage versus 27 : 1 times smaller for sufficient lineage. In contrast, V3 is our worst case. The absolute maximum our methods can achieve is a ratio of 3.36 : 1, which is the ratio we would get by keeping a single monomial for each tuple. At an error ε = 0.01, polynomial lineage achieves a 1.8 : 1 ratio, while sufficient lineage betters this with a 2.1 : 1 ratio. The abundance of large lineage formula in V2 contain redundant information, which allows our algorithms to compress
23
Compression Ratio (y:1)
250 200 150 100 50 Poly Suff 0
0.1
0.2
0.3
0.4
0.5
Mean
(a)
Q V1 V2 V3 V4
Suff PT 0.23s 3.5h 10.3m 50.3h
Poly PT 0.50s 3.5h 24.3m 67.4h
(b)
Figure 4. (a) The compression ratio versus the mean of the distribution for V1. Sufficient is more stable, though the polynomial lineage can provide better approximation ratios. (b) The compression time for each view, the processing time (PT).
them efficiently. Fig. 3(b) shows the distribution of the size of the original lineage formulae and below it the size after compression. There are some very large sources in the real data; the largest one contains approximately 823k monomials. Since large DNFs have probabilities very close to one, polynomial lineage can achieve an ε-approximation can use the constant 1. In contrast, sufficient lineage cannot do this. Effect of Skew We investigate the effect of skew, by altering the probabilistic assignment, that is, the probability we assigned to each atom. Specifically, we assigned an atom a score drawn from a skewed probability distribution. We then compressed V1 with the skewed probabilities. V1 contains only a single tuple with moderate sized lineage (234 monomials). Fig. 4(a) shows the compression ratio as we vary the skew from small means, 0.02, to larger means, 0.5. More formally, the probability we assign to an atom is drawn from a Beta distribution with β = 1 and α taking the value on the x axis. Sufficient lineage provides lower compression ratios for extreme means, that is close to 0.02 and 0.5, but is more consistent in the less extreme cases. Compression Time Fig. 4(b) shows the processing time for each view we consider. For views V2, V3 and V4, we used 4 dual-core CPUs and 8 processes simultaneously. The actual end-to-end running times are about a factor of 8 faster, e.g., V2 took less than 30m to compress. It is interesting to to note that the processor time for V2 is much larger than the comparably sized V3, the reason is that the complexity of our algorithm grows non-linearly with the largest DNF size. Specifically, the increase is due to the cost of sampling. The compression times for polynomial lineage and sufficient lineage are close; this is only true because we are using the heuristic of Sec. 4.2. The generic algorithm is orders of magnitude slower: It could not compress V1 in an hour, compared to only 0.5s using the heuristic approach. Our implementation of the generic search algorithm could be improved, but it would require orders of magnitude improvement to compete with the efficiency the simple heuristic. IMDB and Amazon dataset Using the IMDB movie data, we compressed a view of highly rated movies. Fig. 5(a) shows the compression ratio for versus error rate. Even for stringent error requirements, our approach is able to obtain good compression ratios for both instantiations of approximate lineage. Fig. 5(b) shows the distribution of the lineage size, sorted by rank, and its sufficient compression size. Compared to Fig. 3, there are relatively few large lineage formulae, which means
24
Suff 4.0 2.7 1.4 1.07
Number of Monomials [Logscale]
ε 0.1 0.05 0.01 0.001
100
Poly 4.5 2.6 1.5 1.3
DNF Size Sufficient
10
1 0
(a)
5000
10000 Rank
15000
20000
(b)
|Original| Figure 5. (a) Compression Ratio ( |Compressed| ) (b) The distribution of lineage size in IMDB view, by rank.
there is less much opportunity for compression. On a single CPU, the time taken to compress the data was always between 180 and 210s. This confirms that our results our more general than a single dataset.
Explanations
10
10 Number of Derivatives in Top K
Number of Explanations in Top K
5.3
9 8 7 6 5 4 3
Mean -1 Std. Dev +1 Std. Dev
2 1 0
20
40 60 80 Number of Coeffs (Size)
8 6 4 2 0 0.001
100
(a)
Mean +1 Std. Dev -1 Std. Dev 0.01 Epsilon (Error)
0.1
(b)
Figure 6. (a) Shows the precision of the top-k explanations versus the number of terms in the polynomial expansion (c) The number (precision) of influential variables in the top 10 returned using sufficient lineage that are in the top 10 of the uncompressed function.
We assess how well approximate lineage can solve the explanation tasks in practice, that is finding sufficient explanations (Prob. 2) and finding influential variables (Prob. 3). Specifically, we answer two questions: (1) How well can sufficient lineage compute influential variables? (2) How well can polynomial lineage generate sufficient explanations? To answer question (1), we created 10 randomly generated probabilistic assignment for the atoms in V1; we ensured that the resulting lineage formula had non-trivial reliability, i.e. , in (0.1, 0.9). We then tested precision: Out of the top 10 influential variables, how many were returned in the top 10 using sufficient lineage (Sec. 3.3)? Fig. 6(b) shows that for high error rates, ε = 0.1, we still are able to recover 6 of the top 10 influential variables and for lower error rates, ε = 0.01, we do even better: the average number of recovered top 10 values is 9.6. The precision trails-off for very small error rates due to small swaps in rankings near the bottom of the top 10, e.g., all top 5 are within the top 10. To answer question (2), we used the same randomly generated probabilistic assignments for the atoms in V1 as in the answer to question (1). Fig. 6(a) shows the average number of terms in the top k explanations returned by the method of
25
Sec. 4.3 that are actual sufficient explanations versus the number of terms retained by the formula. We have an average recall of approximately 0.7 (with low standard deviation), while keeping only a few coefficients. Here, we are using the heuristic construction of polynomial lineage. Thus, this experiment should be viewed as a lower bound on the quality of using polynomial lineage for providing explanations. These two experiments confirm that both sufficient and polynomial lineage are able to provide high quality explanations of the data directly on the compressed data.
5.4
Query Performance
100000
300 250
10000 Time (s)
Time (s)
200 1000
150 100
100 Uncompressed Suff Poly
10 0.001
50
0.01 Error
0.1
Uncompressed SUFF POLY
0.001
(a)
0.01 Error
0.1
(b)
Figure 7. Query performance on (a) V2. (b) IMDB data. Fig. 7 shows the effect of compression on execution time of V2; The query asks to compute each tuple in the view. The y-axis is in log scale, it takes just under 20 hours to run this query on the uncompressed data. On data compressed with sufficient lineage at ε = 0.001, we get an order of magnitude improvement; the query takes approximately 35m to execute. Using the data compressed with polynomial lineage, we get an additional order of magnitude; the query now runs in 1.5m. Fig. 7(b) shows the effect of compression on query performance for the IMDB movie dataset where the compression was not as dramatic. Again our query was to compute the lineage for each tuple in the view. The time taking is to perform Monte Carlo sampling on the now much smaller query. As expected, the data with higher error, and so smaller, allows up to a five time performance gain. In this example both running times scale approximately with the size of compression.
6
Related Work Lineage systems and provenance are important topics in data management, [12, 13, 17, 28]. Compressing lineage is cited
as an important techinque to scaling these systems [13]. Of these, only [30] considers probabilistic data, but not approximate semantics. There is long, successful line of work that compresses (deterministic) data to speed up query processing [18, 23, 25, 52, 55]. In wavelet approaches, probabilistic techniques are used to achieve a higher quality synopses, [18]. In contrast, lineage in our setting contains probabilities, which must be captured. The fact that the lineage is probabilistic raises the complexity of
26
compression. For example, the approach of Garofalakis et al. [23] assumes that the entire wavelet transform can be computed efficiently. In our work, the transform size is exponential in the size of the data. Probabilistic query evaluation can be reduced to calculating a single coefficient of the transform, which implies exact computation of the transform is intractable [16, 27]. Aref et al. [19] advocate an approach to operate directly on compressed data to optimze queries on Biological sequences. However, this approach is not lineage aware and so cannot extract explanations from the compressed data. In probabilistic databases, lineage is used for query processing in Mystiq [16, 46] and Trio [56]. However, neither considers approximate lineage. R´e et al. [46] consider approximately computing the probability of a query answer, but do not consider the problem of storing the lineage of a query answer. These techniques are orthogonal: We can use the techniques of [46] to compute the top-k query probabilities from the Level II database using sufficient lineage. Approximate lineage is used to materialize views of probabilistic data; this problem has been previously considered [47], but only with an exact semantics. The notion of approximation in [48] is not the same as ours: They do not consider error guarantees, nor explanations. Sen et al. [50] consider approximate processing of relational queries using graphical models, but not approximate lineage. In the graphical model literature [15, 37] approximate representation is considered, where the goal is to compress the model for improved performance. However, the data and query models of the our approaches is different. Specifically, our approach leverages the fact that lineage is database is often internal. Our approach to computing polynomial lineage is based on computational learning techniques, such as the seminal paper by Linial et al. [40], and others, [8, 11, 43]. A key ingredient underlying these results are switching lemmata, [5, 32, 49]. For the problem of sufficient lineage, we use use the implicit in both Segerlind et al. [49] and Trevisan [54] that either a few variables in a DNF matter (hit every clause) or the formula is ε large. The most famous (and sharpest) switching lemma due to Håstad [32] underlies the Fourier results. So far, learning techniques have only been applied to compressing the data, but have not compressed the lineage [4, 24]. A difference between our approach and this prior art is that we do not discard any tuples, but may discard lineage. Explanation is a well-studied topic in the Artificial Intelligence community, see [31, 44]. The definition of explanation of a fact is a formula that is a minimal and sufficient to explain a fact – which is similar to our definition – but they additionally require that the formula be unknown to the user. We do not model the knowledge of users, but such a semantic would be very useful for scientists.
7
Conclusion In this paper, we have proposed two instantiations of approximate lineage, a conservative approximation called sufficient
lineage and a more aggressive approximation called polynomial lineage. The intuition behind both approaches is to keep track of only the most important explanations or correlations. We provided fundamental algorithms to create, explore and understand, and process approximate lineage. Our approach acheives high compression ratios, high-quality explanations and 27
good query performance.
References [1] S. Abiteboul, R. Hull, and V. Vianu. Foundations of Databases. Addison Wesley Publishing Co, 1995. [2] Amazon.com: http://www.amazon.com/. [3] R. Ananthakrishna, S. Chaudhuri, and V. Ganti. Eliminating fuzzy duplicates in data warehouses. In VLDB, pages 586–597, 2002. [4] S. Babu, M. Garofalakis, and R. Rastogi. Spartan: A model-based semantic compression system for massive data tables. In SIGMOD, pages 283–294, 2001. [5] P. Beame. A switching lemma primer. Technical Report 95-07-01, University of Washington, Seattle, WA, 1995. [6] O. Benjelloun, A. Das Sarma, A. Y. Halevy, M. Theobald, and J. Widom. Databases with uncertainty and lineage. VLDB J., 17(2):243–264, 2008. [7] O. Benjelloun, A. Das Sarma, C. Hayworth, and J. Widom. An introduction to ULDBs and the Trio system. IEEE Data Eng. Bull, 29(1):5–16, 2006. [8] A. Blum, M. L. Furst, J C. Jackson, M J. Kearns, Y. Mansour, and S. Rudich. Weakly learning dnf and characterizing statistical query learning using fourier analysis. In STOC, pages 253–262, 1994. [9] B. Boeckmann, A. Bairoch, R. Apweiler, M. C. Blatter, A. Estreicher, E. Gasteiger, M. J. Martin, K. Michoud, C. O’Donovan, I. Phan, S. Pilbout, and M. Schneider. The swiss-prot protein knowledgebase and its supplement trembl in 2003. Nucleic Acids Res, 31(1):365–370, January 2003. [10] J. Boulos, N .Dalvi, B. Mandhani, S. Mathur, C. Re, and D. Suciu. Mystiq: A system for finding more answers using probabilities (demo). In SIGMOD, 2005. [11] N. Bshouty and C. Tamon. On the fourier spectrum of monotone functions. J. ACM, 43(4):747–770, 1996. [12] P. Buneman, A. Chapman, and J. Cheney. Provenance management in curated databases. In SIGMOD, pages 539–550, 2006. [13] A. Chapman and H. V. Jagadish. Issues in building practical provenance systems. IEEE Data Eng. Bull., 30(4):38–43, 2007.
28
[14] The Gene Ontology Consortium. Gene ontology: tool for the unification of biology. In Nature Genet., pages 25–29, (2000). [15] R. G. Cowell, S. L. Lauritzen, A. P. David, and D. J. Spiegelhalter. Probabilistic Networks and Expert Systems. SpringerVerlag New York, Inc., Secaucus, NJ, USA, 1999. [16] N. Dalvi and D. Suciu. Efficient query evaluation on probabilistic databases. In VLDB, Toronto, Canada, 2004. [17] Special issue on data provenance. IEEE Data Eng. Bull., 30(4), 2007. [18] A. Deligiannakis, M. Garofalakis, and N. Roussopoulos. Extended wavelets for multiple measures. ACM Trans. Database Syst., 32(2):10, 2007. [19] M. Eltabakh, M. Ouzzani, and W. G. Aref. bdbms - a database management system for biological data. In CIDR, pages 196–206, 2007. [20] R. Fagin, J. Y. Halpern, and N. Megiddo. A logic for reasoning about probabilities. Information and Computation, 87(1/2):78–128, 1990. [21] http://flybase.bio.indiana.edu/. [22] N. Fuhr and T. Roelleke. A probabilistic relational algebra for the integration of information retrieval and database systems. ACM Trans. Inf. Syst., 15(1):32–66, 1997. [23] M. Garofalakis and P. Gibbons. Probabilistic wavelet synopses. ACM Trans. Database Syst., 29:43–90, 2004. [24] L. Getoor, B. Taskar, and D. Koller. Selectivity estimation using probabilistic models. In SIGMOD, pages 461–472, 2001. [25] J. Goldstein, R. Ramakrishnan, and U. Shaft. Compressing relations and indexes. In ICDE, pages 370–379, 1998. [26] S.M. Gorski, S. Chittaranjan, E.D. Pleasance, J.D. Freeman, C.L. Anderson, R.J. Varhol, S.M. Coughlin, S.D. Zuyderduyn, S.J. Jones, and M.A. Marra. A SAGE approach to discovery of genes involved in autophagic cell death. Curr. Biol., 13:358–363, Feb 2003. [27] E. Gr¨adel, Y. Gurevich, and C. Hirsch. The complexity of query reliability. In PODS, pages 227–234, 1998. [28] T. Green, G. Karvounarakis, N. E. Taylor, O. Biton, Z. G. Ives, and V. Tannen. Orchestra: facilitating collaborative data sharing. In SIGMOD, pages 1131–1133, 2007. [29] T. Green and V. Tannen. Models for incomplete and probabilistic information. IEEE Data Engineering Bulletin, 29(1):17–24, March 2006. 29
[30] T. J. Green, G. Karvounarakis, and V. Tannen. Provenance semirings. In PODS, pages 31–40, 2007. [31] J. Halpern and J. Pearl. Causes and explanations: A structural-model approach - part II: Explanations. In IJCAI, pages 27–34, 2001. [32] J. Håstad. Computational limitations for small depth circuits. M.I.T Press, Cambridge, Massachusetts, 1986. [33] E. Hazan, S. Safra, and O. Schwartz. On the hardness of approximating k-dimensional matching. ECCC, 10(020), 2003. [34] M. Hernandez and S. Stolfo. The merge/purge problem for large databases. In SIGMOD, pages 127–138, 1995. [35] Internet movie database: http://www.imdb.com/. [36] T. Imielinski and W. Lipski. Incomplete information in relational databases. Journal of the ACM, 31:761–791, October 1984. [37] M. Jordan, Z. Ghahramani, T. Jaakkola, and L. Saul. An introduction to variational methods for graphical models. Machine Learning, 37(2):183–233, 1999. [38] R. Karp and M. Luby. Monte-Carlo algorithms for enumeration and reliability problems. In Proceedings of the annual ACM symposium on Theory of computing, 1983. [39] E. Kushilevitz and Y. Mansour. Learning decision trees using the fourier spectrum. SIAM J. Comput., 22(6):1331–1348, 1993. [40] N. Linial, Y. Mansour, and N. Nisan. Constant depth circuits, fourier transform, and learnability. J. ACM, 40(3):607– 620, 1993. [41] G. Miklau and D. Suciu. A formal analysis of information disclosure in data exchange. J. Comput. System Sci., 73(3):507–534, 2007. [42] R. Motwani and P. Raghavan. Randomized Algorithms. Cambridge University Press, August 1995. [43] R. W. O’Donnell. Computational Applications of Noise Sensitivity. PhD thesis, M.I.T., 2003. [44] J. Pearl. Causality: Models, Reasoning and Inference. Cambridge University Press, Cambridge, UK, 2000. [45] http://www.pubmed.gov. [46] C. R´e, N. Dalvi, and D. Suciu. Efficient top-k query evaluation on probabilistic data. In ICDE, 2007.
30
[47] C. R´e and D. Suciu. Materialized views in probabilistic databases for information exchange and query optimization. In VLDB, pages 51–62, 2007. [48] A. Das Sarma, S. U. Nabar, and J. Widom. Representing uncertain data: Uniqueness equivalence, minimimzation and approximation. Technical Report 2005-38, Stanford University, December 2005. [49] N. Segerlind, S. R. Buss, and R. Impagliazzo. A switching lemma for small restrictions and lower bounds for k-dnf resolution. SIAM J. Comput., 33(5):1171–1200, 2004. [50] P. Sen and A. Deshpande. Representing and querying correlated tuples in probabilistic databases. In ICDE, 2007. [51] R. Servedio. On learning monotone dnf under product distributions. Inf. Comput., 193(1):57–74, 2004. [52] M. Stonebraker, D. Abadi, A. Batkin, X. Chen, M. Cherniack, M. Ferreira, E. Lau, A. Lin, S. Madden, E. O’Neil, P. O’Neil, A. Rasin, N. Tran, and S. Zdonik. C-store: A column-oriented dbms. In VLDB, pages 553–564, 2005. [53] Go database v. go200801. [54] L. Trevisan. A note on deterministic approximate counting for k-dnf. Electronic Colloquium on Computational Complexity (ECCC), (069), 2002. [55] J. Vitter and M. Wang. Approximate computation of multidimensional aggregates of sparse data using wavelets. In SIGMOD, pages 193–204, 1999. [56] J. Widom. Trio: A system for integrated management of data, accuracy, and lineage. In CIDR, pages 262–276, 2005.
31
SELECT t1.id,t2.id,e1.*,e2.* FROM term AS t1, graph_path AS p1, association AS a1, association AS a2, term AS t2, graph_path AS p2, evidence as e1, evidence as e2 WHERE
(t1.id=p1.term1_id) AND (a1.term_id=p1.term2_id) AND (a2.gene_product_id=a1.gene_product_id) AND (t2.id=p2.term1_id) AND (a2.term_id=p2.term2_id) AND (e1.association_id = a1.id) AND (e2.association_id = a2.id) AND t1.acc = ’GO:0005525’ AND t2.acc = ’GO:0006955’ ORDER BY t1.id, t2.id Figure 8. V1
A
Necessary Lineage In necessary lineage, each formula λt is replaced by a formula λ˜ tN that is implied by the original. Hence, whenever λt holds
it is necessary that λtN hold as well. Thus, P[λtN ] ≥ P[λt ] and it can be used to give an upper bound on query probabilities. For example, the event “true” is a necessary lineage for any tuple, but may have high error. Using this observation, straightforward variants of our results about construction can be derived for necssary lineage. In particular, we can simply keep true rather than the matching in our construction algorithm. Lastly, we can use the same statistical test as Fourier lineage to find explanations. However, our preliminary experiments suggested that necessary lineage was not as well-suited for explanations as sufficient linage. On the other hand, necessary lineage can provide more aggressive compression when views are very large.
B
Experiment Queries We list the four queries explicitly in this section V1 in Fig. 8, V2 in Fig. 9, V3 in Fig 10 and V4 in Fig 11.
32
SELECT t1.id,t2.id, t2.acc, e1.*,e2.* -- Evidence codes FROM term t1, term t2, association a1, association a2, evidence e1, evidence e2 WHERE a1.term_id = t1.id AND a2.term_id = t2.id AND a1.gene_product_id = a2.gene_product_id AND e1.association_id = a1.id AND e2.association_id = a2.id AND t1.acc = ’GO:0006412’ AND t1.id != t2.id ORDER BY t1.id,t2.id Figure 9. V2
SELECT gene_product.*, term.name, dbxref.xref_key AS acc, dbxref.xref_dbname AS speciesdb, evidence.* FROM gene_product, dbxref, association, graph_path, evidence, term WHERE evidence.association_id = association.id and gene_product.dbxref_id = dbxref.id and association.gene_product_id = gene_product.id and graph_path.term2_id = association.term_id and graph_path.term1_id = term.id and dbxref.xref_dbname=’FB’ ORDER BY gene_product.id, term.name Figure 10. V3
33
SELECT gene_product.*, term.id, associated_term.id, association.id, evidence.* FROM gene_product INNER JOIN species ON (gene_product.species_id = species.id) INNER JOIN dbxref ON (gene_product.dbxref_id = dbxref.id) INNER JOIN association ON (gene_product.id = association.gene_product_id) INNER JOIN evidence ON (evidence.association_id = association.id) INNER JOIN graph_path ON (association.term_id = graph_path.term2_id) INNER JOIN term ON (graph_path.term1_id = term.id) INNER JOIN term AS associated_term ON (graph_path.term2_id = associated_term.id) ORDER BY gene_product.id, term.id, associated_term.id, association.id Figure 11. V4
34