Sensors are non-reactive elements which are used to monitor real life .... This hierarchical data organization consists of storing multiple aggregations ... values in the quad-tree nodes for evaluating the answer (see Section 6.1 for more details).
Approximate Query Answering on Sensor Network Data Streams Alfredo Cuzzocrea1 , Filippo Furfaro2 , Elio Masciari1 , and Cristina Sirangelo2 1
ICAR-CNR – Institute of Italian National Research Council {cuzzocrea, masciari}@isi.cs.cnr.it 2 DEIS-UNICAL Via P. Bucci, 87036 Rende (CS) Italy {furfaro, sirangelo}@si.deis.unical.it
Abstract. Sensor networks represent a non traditional source of information, as readings generated by sensors flow continuously, leading to an infinite stream of data. Traditional DBMSs, which are based on an exact and detailed representation of information, are not suitable in this context, as all the information carried by a data stream cannot be stored within a bounded storage space. Thus, compressing data (by possibly loosing less relevant information) and storing their compressed representation, rather than the original one, becomes mandatory. This approach aims to store as much information carried by the stream as possible, but makes it unfeasible to provide exact answers to queries on the stream content. However, exact answers to queries are often not necessary, as approximate ones usually suffice to get useful reports on the world monitored by the sensors. In this paper we propose a technique for providing fast approximate answers to aggregate queries on sensor data streams. Our proposal is based on a hierarchical summarization of the data stream embedded into a flexible indexing structure, which permits us to both access and update compressed data efficiently. The compressed representation of data is updated continuously, as new sensor readings arrive. When the available storage space is not enough to store new data, some space is released by compressing the “oldest” stored data progressively, so that recent information (which is usually the most relevant to retrieve) is represented with more detail than old one.
1
Introduction
Sensors are non-reactive elements which are used to monitor real life phenomena, such as live weather conditions, network traffic, etc. They are usually organized into networks where their readings are transmitted using low level protocols [8]. Sensor networks represent a non traditional source of information, as readings generated by sensors flow continuously, leading to an infinite stream of data. Traditional DBMSs, which are based on an exact and detailed representation of information, are not suitable in this context, as all the information carried by a data stream cannot be stored within a bounded storage space [2–4, 7, 1]. Moreover, traditional DBMSs are basically transaction oriented, i.e. their main
goal is to guarantee data consistency, and they do not pay particular attention to query efficiency. The inefficiency of the query answering process is dramatically evident in the computation of aggregate queries (sum, mean, count, etc.), as accessing a huge amount of data is usually necessary to provide the correct answer to this kind of query. The issue of defining new query evaluation paradigms to provide fast answers to aggregate queries is very relevant in the context of sensor networks. In fact, the amount of data produced by sensors is very large and grows continuously, and the queries need to be evaluated very quickly, in order to make it possible to perform a timely “reaction to the world” . Moreover, in order to make the information produced by sensors useful, it should be possible to retrieve an up-to-date “snapshot” of the monitored world continuously, as time passes and new readings are collected. For instance, a climate disaster prevention system would benefit from the availability of continuous information on atmospheric conditions in the last hour. Similarly, a network congestion detection system would be able to prevent network failures exploiting the knowledge of network traffic during the last minutes. If the answer to these queries, called continuous queries, is not fast enough, we could observe an increasing delay between the query answer and the arrival of new data, and thus a not timely reaction to the world. In this paper we propose a technique for providing fast approximate answers to aggregate queries on sensor data streams. Our proposal is based on a hierarchical summarization of the data stream embedded into a flexible indexing structure, which permits us to both access and update compressed data efficiently. The compressed representation of data is updated continuously, as new sensor readings arrive. When the available storage space is not enough to store new data, some space is released by compressing the “oldest” stored data progressively, so that recent information (which is usually the most relevant to retrieve) is represented with more detail than old one.
2
Problem Statement
Consider an ordered set of n sources (i.e. sensors) denoted by {s1 , . . . , sn } producing n independent streams of data, representing sensor readings. Each data stream can be viewed as a sequence of triplets hids , v, tsi, where: 1) ids ∈ {1, .., n} is the source identifier; 2) v is a non negative integer value representing the measure produced by the source identified by ids ; 3) ts is a timestamp, i.e. a value that indicates the time when the reading v was produced by the source ids . The data streams produced by the sources are caught by a Sensor Data Stream Management System (SDSMS), which combines the sensor readings into a unique data stream, and supports data analysis. An important issue in managing sensor data streams is aggregating the values produced by a subset of sources within a time interval. More formally, this means answering a range query on the overall stream of data generated by s1 , . . . , sn . A range query is a pair Q = hsi ..sj , [tstart ..tend ]i whose answer is the evaluation of an aggregate operator (such as sum, count, avg, etc.) on the values produced by the sources si , si+1 , . . . , sj within the time interval [tstart ..tend ].
The sensor data stream can be represented by means of a two-dimensional array, where the first dimension corresponds to the set of sources, and the other one corresponds to time. In particular, the time is divided into intervals ∆tj of the same size. Each element hsi , ∆tj i of the array is the sum of all the values generated by the source si whose timestamp is within the time interval ∆tj . Obviously the use of a time granularity generates a loss of information, as readings of a sensor belonging to the same time interval are aggregated. Indeed, if a time granularity which is appropriate for the particular context monitored by sensors is chosen, the loss of information will be negligible. Using this representation, an estimate of the answer to a sum range query over hsi ..sj , [tstart ..tend ]i can be obtained by summing two contributions. The first one is given by the sum of those elements which are completely contained inside the range of the query (i.e. the elements hsk , ∆tl i such that i ≤ k ≤ j and ∆tl is completely contained into [tstart ..tend ]). The second one is given by those elements which partially overlap the range of the query (i.e. the elements hsk , ∆tl i such that i ≤ k ≤ j and tstart ∈ ∆tl or tend ∈ ∆tl ). The first of these two contributions does not introduce any approximation, whereas the second one is generally approximate, as the use of the time granularity makes it unfeasible to retrieve the exact distribution of values generated by each sensor within the same interval ∆tl . The latter contribution can be evaluated by performing linear interpolation, i.e. assuming that the data distribution inside each interval ∆ti is uniform (Continuous Values Assumption - CVA). For instance, the contribution of the element hs2 , ∆t3 i to the sum query represented in Fig. 1 is given by 6−5 2 · 4 = 2.
Fig. 1. Two-dimensional representation of sensor data streams
As the stream of readings produced by every source is potentially “infinite”, detailed information on the stream (i.e. the exact sequence of values generated by every sensor) cannot be stored, so that exact answers to every possible range query cannot be provided. However, exact answers to aggregate queries are often not necessary, as approximate answers usually suffice to get useful reports on the content of data streams, and to provide a meaningful description of the world monitored by sensors. A solution for providing approximate answers to aggregate queries is to store a
compressed representation of the overall data stream, and then to run queries on the compressed data. The use of a time granularity introduces a form of compression, but it does not suffice to represent the whole stream of data, as the stream length is possibly infinite. An effective structure for storing the information carried by the data stream should have the following characteristics: i) it should be efficient to update, in order to catch the continuous stream of data coming from the sources; ii) it should provide an up-to-date representation of the sensor readings, where recent information is possibly represented more accurately than old one; iii) it should permit us to answer range queries efficiently. Our proposal. In this paper we propose a technique for providing (fast) approximate answers to aggregate queries on sensor data streams, focusing our attention on sum range queries. Our proposal consists of a compressed representation of the sensor data stream where the information is summarized in a hierarchical fashion. In particular, a flexible indexing structure is embedded into the compressed data, so that information can be both accessed and updated efficiently. In more detail, our compression technique is based on the following scheme: – the sensor data stream is divided into “time windows” of the same size: each window consists of a finite number of contiguous unitary time intervals ∆ti (the size of each ∆ti corresponds to the granularity); – time windows are indexed, so that windows involved in a range query can be accessed efficiently; – as new data arrive, if the available storage space is not enough for their representation, “old” windows are compressed (or possibly removed) to release the storage space needed to represent new readings, and the index is updated to take into account the new data. The technique used for compressing time windows is lossy, so that “recent” data are generally represented more accurately than “old” ones. In Fig. 2, the partitioning scheme of a stream into time windows is represented, as well as the overlying index referring to all the time windows.
Fig. 2. A sequence of indexed time windows
3 3.1
Representing Time Windows Preliminary Definitions
Consider given a two-dimensional n1 × n2 array A. Without loss of generality, array indices are assumed to range respectively in 1..n1 and 1..n2 . A block r (of the array) is a two dimensional interval [l1 ..u1 , l2 ..u2 ] such that 1 ≤ l1 ≤ u1 ≤ n1
and 1 ≤ l2 ≤ u2 ≤ n2 . Informally, a block represents a “rectangular” region of the array. We denote by size(r) the size of the block r, i.e. the value (u1−l1 +1)· (u2 −l2 +1). Given a pair hv1 , v2 i we say that hv1 , v2 i is inside r if v1 ∈ [l1 ..u1 ] and v2 ∈ [l2 ..u2 ]. We P denote by sum(r) the sum of the array elements occurring in r, i.e. sum(r) = hi,jiinside r A[i, j]. If r is a block corresponding to the whole array (i.e. r = [1..n1 , 1..n2 ]), sum(r) is also denoted by sum(A). A block r such that sum(r) = 0 is called a null block. Given a block r = [l1 ..u1 , l2 ..u2 ] in A, we denote by ri the i−th quadrant of r, i.e. r1 = [l1 ..m1 , l2 ..m2 ], r2 = [m1 + 1..u1 , l2 ..m2 ], r3 = [l1 ..m1 , m2 + 1..u2 ], and r4 = [m1 + 1..u1 , m2 + 1..u2 ]. where m1 = ⌊(l1 + u1 )/2⌋ and m2 = ⌊(l2 +u2 )/2⌋. Given a a time interval t = [tstart ..tend ] we denote by size(t) the size of the time interval t, i.e. size(t) = tend − tstart . Furthermore we denote by ti/2 the i-th half of t. That is t1/2 = [tstart ..(tstart + tend )/2] and t2/2 = [(tstart + tend )/2..tend ]. Given a tree T , we denote by Root(T ) the root node of T and, if p is a non leaf node, we denote the i−th child node of p by Child(p, i). Given a triplet x = hids , v, tsi, representing a value generated by a source, ids is denoted by ids (x), v by value(x) and ts by ts(x). 3.2
The Quad-Tree Window
In order to represent data occurring in a time window, we do not store directly the corresponding two-dimensional array, indeed we choose a hierarchical data structure, called quad-tree window, which offers some advantages: it makes answering (portions of) range queries internal to the time window more efficient to perform (w.r.t. a “flat” array representation), and it stores data in a straight compressible format. That is, data is organized according to a scheme that can be directly exploited to perform compression. This hierarchical data organization consists of storing multiple aggregations performed over the time window array according to a quad-tree partition. This means that we store the sum of the values contained in the whole array, as well as the sum of the values contained in each quarter of the array, in each eighth of the array and so on, until the single elements of the array are stored. Fig. 3 shows an example of quad-tree window, where each node of the quad-tree is associated to the sum of the values contained in the corresponding portion of the time window array.
Fig. 3. A Time Window and the corresponding quad-tree partition
The quad-tree structure is very effective for answering (sum) range queries inside a time window efficiently, as we can generally use the pre-aggregated sum
values in the quad-tree nodes for evaluating the answer (see Section 6.1 for more details). Moreover, the space needed for storing the quad-tree representation of a time window is about the same as the space needed for a flat representation, as we will explain later. Furthermore, the quad-tree structure is particularly prone to progressive compressions. In fact, the information represented in each node is summarized in its ancestor nodes. Therefore, if we prune some nodes from the quad-tree, we do not loose every information about the corresponding portions of the time window array, but we represent them with less accuracy. We will next describe the quad-tree based data representation of a time window formally. Denoting by u the time granularity (i.e. the width of each interval ∆tj ), let T = n · u be the time window width (where n is the number of sources). We refer to a Time Window starting at time t as a two-dimensional array W of size n×n such that W [i, j] represents the sum of the values generated by a source si within the j−th unitary time interval of W . The whole data stream consists of an infinite sequence W1 , W2 , . . . of time windows such that the i−th one starts at ti = (i − 1) · T and ends at ti+1 = i · T . In the following, for the sake of presentation, we assume that the number of sources is a power of 2 (i.e. n = 2k , where k > 1). A Quad-Tree Window on the time window W , called QT W (W ), is a full 4−ary tree whose nodes are pairs hr, sum(r)i (where r is a block of W ) such that: 1. Root(QT W (W )) = h[1..n, 1..n], sum([1..n, 1..n])i; 2. each non leaf node q = hr, sum(r)i of QT W (W ) has four children representing the four quadrants of r; That is, Child(q, i) = hri , sum(ri )i for i = 1, . . . , 4. 3. the depth of QT W (W ) is log2 n + 1. Property 3 implies that each leaf node of QT W (W ) corresponds to a single element of the time window array W . Given a node q = hr, sum(r)i of QT W (W ), r is referred to as q.range and sum(r) as q.sum. The space needed for storing all the nodes of a quad-tree window QT W (W ) is larger than the one needed for a flat representation of W . In fact, it can be easily 2 shown that the number of nodes of QT W (W ) is 4·n3 −1 , whereas the number of elements in W is n2 . Indeed, QT W (W ) can be represented compactly, exploiting the hierarchical structure of the quad-tree partition and the possible sparsity of data in a time window (i.e. the possible presence of null blocks in the quad-tree window). It can be shown that, if we use 32 bits for representing a sum, the largest max 2 storage space needed for a quad-tree window is SQT W = (32 + 8/3)n − 2/3 bits (assuming that the window does not contain any null value). 3.3
Populating Quad-Tree Windows
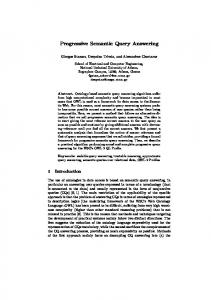
In this section we describe how a quad-tree window is populated as new data arrive. Let Wk be the time window associated to a given time interval [(k − 1) · T..k ·T ] and QT W (Wk ) the corresponding quad-tree window. Let x = hids , v, tsi be a new sensor reading such that ts is in [(k − 1) · T..k · T ]. We next describe how QT W (Wk ) is updated on the fly, to represent the changes in Wk .
Let QT W (Wk )old be the quad-tree window representing the content of Wk before the arrival of x. If x is the first received reading whose timestamp belongs to the time interval of Wk , QT W (Wk )old consists of a unique null node (the root). An algorithm for updating a quad-tree window on a reading arrival can work as follows. The algorithm takes as arguments x and QT W (Wk )old , and returns the up-to-date quad-tree window Qnew on Wk . First, the old quad-tree window QT W (Wk )old is assigned to Qnew . Then, the algorithm determines the coordinates hids , ji of the element of Wk which must be updated according to the arrival of x, and visits Qnew starting from its root. At each step of the visit, the algorithm processes a node of Qnew corresponding to a block of Wk which contains hids , ji. The sum associated to the node is updated by adding value(x) to it (see Fig. 4). If the visited node was null (before the updating), it is split into four new null children. After updating the current node (and possibly splitting it), the visit goes on processing the child of the current node which contains hids , ji. Algorithm ends after updating the node of Qnew corresponding to the single element hids , ji. Time Window
Time Window
Time Window
Time Window 8 sec
0 sec
8 sec
0 sec
Time Window 8 sec
0 sec
8 sec
0 sec
8 sec
0 sec
S1
0
0
0
0
S1
5
0
0
0
S1
5
0
0
0
S1
5
0
0
0
S1
5
0
0
0
S2
0
0
0
0
S2
0
0
0
0
S2
6
0
0
0
S2
6
0
0
0
S2
6
0
0
0
S3
0
0
0
0
S3
0
0
0
0
S3
0
0
0
0
S3
0
0
0
0
S4
0
0
0
0
S4
0
0
0
0
S4
S4
Dt 1 Dt 2 Dt 3 Dt 4
Dt 1 Dt 2 Dt 3 Dt 4
Dt 1 Dt 2 Dt 3 Dt 4
0
0
0
0
S3
0
9
0
0
S4
Dt 1 Dt 2 Dt 3 Dt 4
Quad Tree Window
Quad Tree Window
0
Quad Tree Window
5
(S1, 5, 1 sec)
Quad Tree Window
0
5
0
0
0
0
11
5
6
0
0
0
0 0
26 (S3, 6, 5 sec)
11 0
6 0
Quad Tree Window
(S4, 9, 3 sec)
0
0 9
20
11 (S2, 6, 1.5 sec)
5
0 0
Dt 1 Dt 2 Dt 3 Dt 4
} 2 sec
9
0
11 0
0
0
5 6 0 0 0 0 0 9
6
9
5 6 0 0 0 0 0 9
6 0 0 0
Fig. 4. Populating a quad-tree window
4
The Multi-Resolution Data Stream Summary
A quad-tree window represents the readings generated within a time interval of size T . The whole sensor data stream can be represented by a sequence of quad-tree windows QT W (W1 ), QT W (W2 ), . . .. When a new sensor reading x arrives, it is inserted in the corresponding quad-tree window QT W (Wk ), where ts(x) ∈ [(k − 1) · T..k · T ]. A quad-tree window QT W (Wk ) is physically created when the first reading belonging to [(k − 1) · T..k · T ] arrives. In this section we define a structure that both indexes the quad-tree windows and summarizes the values carried by the stream. This structure is called Multi-Resolution Data Stream Summary and pursues two aims: 1) making range queries involving more than one time window efficient to evaluate; 2) making the stored data easy to compress. We propose the following scheme for indexing quad-tree windows: 1. time windows are clustered into groups C1 , C2 , . . . ; each cluster consists of K contiguous time windows, thus describing a time interval of size K · T ; 2. quad-tree windows inside each cluster Cl are indexed by means of a binary tree denoted by BT I(Cl );
3. the whole index consists of a list linking BT I(C1 ), BT I(C2 ), . . .. We next focus our attention on describing the structure of a single index BT I(Cl ). Then, we show how the whole index overlying the quad-tree windows is built. 4.1
Indexing a Cluster of Quad-Tree Windows
Consider the l-th cluster Cl of the sequence representing the whole sensor data stream. Cl corresponds to the time interval [(l − 1) · K · T..l · K · T ] which will be denoted by ∆T (Cl ). We fix the value of K to a power of 2. A Binary Tree Index on Cl , is denoted by BT I(Cl ) and is a full binary tree whose nodes are pairs ht, si, with t a time interval and s a sum, such that: 1. Root(BT I(Cl )) = h∆T (Cl ), sum(∆T (Cl ))i where sum(∆T (Cl )) is the sum of Pthe values generated within ∆T (Cl ) by all the sources, i.e. sum(∆T (Cl )) = (l−1)·K ∆Tend ) whose answer, at the current time t, is the evaluation of an aggregate operator (such as sum, count, avg, etc.) on the values produced by the sources si , si+1 , . . . , sj within the time interval [t − ∆Tstart ..t − ∆Tend ]. In other words, a continuous query can be viewed as range query whose time interval “moves” continuously, as time goes
on. The output of a continuous query is a stream of (simple) range query answers which are evaluated with a given frequency. That is, the answer to a continuous query Q = hsi ..sj , ∆Tstart , ∆Tend i issued at time t0 with frequency ∆t is the stream consisting of the answers of the queries Q0 = hsi ..sj , t0 − ∆Tstart , t0 − ∆Tend i, Q1 = hsi ..sj , t0 − ∆Tstart + ∆t, t0 − ∆Tend + ∆ti, Q2 = hsi ..sj , t0 − ∆Tstart + 2 · ∆t, t0 − ∆Tend + 2 · ∆ti, . . .. The i-th term of this stream can be evaluated efficiently if we exploit the knowledge of the (i − 1)-th value of the stream, provided that ∆t ≪ ∆Tstart − ∆Tend . In this case the ranges of two consecutive queries Qi−1 and Qi are overlapping, and Qi can be evaluated by answering two range queries whose size is much less than the size of Qi . These two range queries are Q′ = hsi ..sj , t0 − ∆Tstart + (i − 1) · ∆t, t0 − ∆Tstart + i · ∆ti, and Q′′ = hsi ..sj , t0 − ∆Tend + (i − 1) · ∆t, t0 − ∆Tend + i · ∆ti. Thus we have: Qi = Qi−1 − Q′ + Q′′ . Acknowledgements. The authors would like to thank Domenico Sacc`a for his several comments and suggestions.
References 1. R. Avnur and J. M. Hellerstein. Eddies: Continuously adaptive query processing. In ACM SIGMOD Conference, 2000. 2. M. Datar R. Motwani B. Babcock, S. Babu and J. Widom. Models and Issues in Data Stream Systems. In Twenty-first ACM SIGACT-SIGMOD-SIGART Symposium on Principles of Database Systems, 2002. 3. D. Pregibon A. Rogers F. Smith C. Cortes, K. Fisher. Hancock: A language for extracting signatures from data streams. In Knowledge Discovery in Databases (KDD2000), 2000. 4. V.J. Tsotras D. Zhang, D. Gunopulos and B. Seeger. Temporal aggregation over data streams using multiple granularities. In Extending Database Technology Conference, 2002. 5. D. Rosaci D. Sacca’ F. Buccafurri, L. Pontieri. Improving range query estimation on histograms. 2002. 6. D. Sacca’ C. Sirangelo F. Buccafurri, F. Furfaro. A quad-tree based multiresolution approach for two-dimensional summary data. 2003. 7. S. Rajagopalan M.R. Henzinger, P. Raghavan. Computing on data streams. Technical Report 1998-011, Digital Systems Research Center, 1998. Available at http://www.research.digital.com/SRC/. 8. M.J. Franklin S. Madden. Fjording the stream: An architecture for queries over streaming sensor data. In Proc. ICDE, 2002. 9. V. Ganti V. Poosala. Fast approximate answers to aggregate queries on a datacube. In Proc. SSDBM Conf. 1999, Cleaveland, Ohio, USA. 10. Y. E. Ioannidis V. Poosala. Selectivity estimation without the attribute value independence assumption. 11. Y.E. Ioannidis V. Poosala, V. Ganti. Approximate query answering using histograms.