has a known form except for a few parameters (e.g. mean and .... login and data mart schemas. The analytic ... enterprise information portal, in which accurate.
Approximate Query Processing in Decision Support System Environment Carlo DELL’AQUILA, Ezio LEFONS, Filippo TANGORRA Dipartimento di Informatica Università di Bari Via E. Orabona 4, I-70125 Bari BA ITALY
Abstract: - Both the approximate query process and decisional portals are emerging technologies in the decision support system environment. The former tool provides fast execution time for the analysis applications which require access to large amounts of data in the warehouse, by furnishing estimates of summary data with an approximation error acceptable for decision-maker users. The web-based second tool allows managers to monitor the enterprise activities on which decisions have to be taken by means of opportune statistical leds. From the technological viewpoint, such an environment is the result of the integration of data warehouse, query optimizers and Internet technologies. Key-Words: - Aggregate queries, Approximate query answering, Data warehouses, Multidimensional data distribution, OLAP applications.
1 Introduction Approximate query processing is an investigation area of increasing interest. Classically, the database community was interested in the description of data statistical profiles to improve the query optimization process. Statistical profiles have been utilized as components of query optimizers in relational database management systems, to accomplish the analysis of the query, to construct possible access paths, and to estimate the cost of each path to determine the least expensive one. This path is then selected as the optimal strategy of the query execution. Recently, data warehouses have gained an increasing prominent role in supporting deep analysis and strategic planning. Data warehouses are very large repositories that integrate data from operational databases of several enterprise sectors for decisional analysis. In this context, the estimation of data statistical properties have been used in novel applications, besides the query optimization, to satisfy the external data analysis required by the user for a fast approximate response to complex querying. In fact, On-line analytic processing (OLAP) systems and decision-support (DS) systems run on data warehousing environments built on relational database technology (ROLAP servers). Typically, OLAP and DS applications involve the computation of summary data and the execution of aggregate
queries (queries requiring data aggregation and grouping such as the SQL operators COUNT, SUM, MIN, MAX, and AVG with GROUPBY/HAVING clauses) [12]. Internal data structures such as indexes (usually, bitmaps and B-trees) can be used by the DBMS to efficiently answer complex queries. Although the availability and the use of indexes [4,13,17], materialized views [3,27], summary tables [23], and statistical data profiles [21] can drastically reduce the response time to queries, operations often escape optimal query execution strategies, due to the unpredictable nature of decisional applications [9]. In these frequent cases, sequential data processing may occur and, as the data volume of interest is extremely large, queries can take hours or days to complete [14]. The alternative to the scan of huge amounts of data in data warehouses provides approximate query answering when applications can tolerate small errors in query answers. The goal of this approach is to achieve interactive response times to aggregate queries. Really, in the most decisional activity, it is unnecessary to have exact answers to aggregate queries if this requires expensive time; it suffices to obtain (reasonably accurate) approximate answers and good estimates of summary data provided that fast query responses are guaranteed. Moreover, initial phases of data analysis involved by drill-down or roll-up query sequences can take advantages of
sacrificing the accuracy of fast answers if this allows the analyst to explore quickly many possibilities or alternatives (scenarios) of analysis (including the what-if analysis [5]) or to restrict the rest of the analysis to truly interesting queries and regions of the database [15]. In general, the usual, decisional analysis is iterative and exploratory in nature: a sequence of queries is issued against the data warehouse, the formulation of each successive query being influenced by the results of previous queries.
2. Methodology Several approximate query answering approaches have been proposed. Traditionally, the terminology adopted in the query optimization area classifies the estimates methods into parametric and nonparametric methods. The distinction on the method for determining data distributions. Here, the knowledge of attribute distributions plays a crucial role in estimating both selectivity factors and aggregate functions. Parametric methods assume that the distribution has a known form except for a few parameters (e.g. mean and standard deviation). By making this assumption, one only needs to estimate the parameters which complete the description of the shape of the distribution. The distributions usually considered are Pearson family (including uniform, normal, beta, F, t, and gamma) and Zipf, even if somewhat unrealistic assumptions, such as the uniform distribution and independence of attributes or the worst-case selectivity are often made to simplify processing. Parametric methods are of interest because they summarize the distribution with a few parameters. On the contrary, they do not provide accurate estimates when the actual data do not fit the assumed theoretical distribution. Nonparametric methods do not make a priori assumptions about the form of the distribution. Therefore, the distribution can be more difficult to estimate, and more storage is required than with parametric methods but these methods provide accurate estimates. Since nonparametric methods better fit the distribution of the actual data and a higher performance in query optimization and aggregate function estimation is possible, we will consider only those methods and subdivide them into two classes: the scale-based and the analytic methods. In the class of scale-based methods, we group those based on distribution tables and scales of attribute domains. Equal-width, equal-height, and variable-width histograms are well-known examples.
Distribution tables are easy to construct and to use. On the contrary, they have serious drawbacks. The class of analytic methods contains those which approximate the actual data distribution by a finite series of analytic functions, whereas parametric methods use only an analytic function selected from a limited set. Both analytic and parametric methods make the assumption that the attribute values can be considered as observations of a random variable and, therefore, they approximate the discrete density distributions with continuous ones. Hence any method in this class is scale independent (and any parametric method as well). Interpolation polynomials, least squares approximation, polynomials of best approximation (minimum maximum norm), and trigonometric approximations are the methods generally utilized in numerical approximation theory. We have presented an analytic approach based on the analytic approximation of the actual multivariate data distribution of attributes by a series of orthogonal polynomials [8,18,19]. The method is a special case of least squares approximation by orthonormal functions and summarizes all the information on the data distribution by few data—the computed coefficients of the polynomial series. We have called them the Canonical Coefficients of the data for they allow the main data statistics (k-moments, mean, variance, correlation coefficient) to be easily derived and efficiently computed with no access to the data warehouse. Moreover, data updates (insertions, deletions, and modifications) can immediately propagate to the canonical coefficients based on their so-called additive property. More recently, the attention of researchers is moving to approximate query processing for decision support systems, therefore also new approaches to the problem of summary quantity estimations are being developed. So the classification of the estimate methods can be revised considering the following general classes: sampling-based (uniform random [1,11], self-tuning [10], and weighted [7] sampling), and summary-based (histograms [24,16], clustering [25], probabilistic model (for Boolean data and queries) [20], and wavelets [26,6,22]). To the variety of approaches not always corresponds an effective improvement of performances. For example, the main drawbacks of sampling are (a) joins between samples generally produce empty relations and (b) to access to stored large relations requires expensive time, especially in the case of distributed/fragmented data. As concerns the summary-based methods, (a) summary tables are not easily and online modifiable to accord to data insertion and update and (b) applications are category/measure dependent, that is,
the multidimensionality of each table reflects the role (category vs measure) assigned to attributes.
3. Approximate Query Process The architecture of decision support systems consists of three main components: (1) extract, transform and load tools (ETL tools); (2) the data warehouse; (3) the analysis tools. This structure defines four different levels of data flow corresponding to successive steps for adapting the data to the decisionmaker needs. They are: the source level, the refresh level, the warehouse level, and the analytic level. The source level. Data warehouses contain data consolidated from several operational databases. The integration of data coming from different heterogeneous sources became necessary. Such source data are stored on relational or legacy databases that are components of information systems owned by the decisional organization or other external organizations. The refresh level. At this level, the ETL tools allow the decisional data administrator to extract, to transform, to load, to refresh, and to integrate data from the several source data described by different data schemas in the data warehouse. From a technological view point, the solutions of distributed services for information systems are adopted, such as, for example, the management of the data inconsistency and the structure incompatibility. The data warehouse level. Data warehouses provide historical, summarized data directly for decision support system applications. they can be used also as source for building data marts which contain information for specific departmental sectors. The metadata repository stores information on data sources, access mechanism, user login and data mart schemas. The analytic level. At this level allows sophisticated data analysis with OLAP and data mining techniques are used to accomplish reports, responses to complex query, and results of simulation of new market scenarios. From a technological view point, services are required for aggregate data management, query optimization, indexing structures and user-friendly interfaces. It is in this environment that the approximate query processing technology can be profitably used. The approximate query processor (any tool which implements a valid approach) furnishes fast responses to aggregate queries when estimates and/or approximate results are required by the user directly. In the meantime, the tool provides to maintain the data statistical profile consistent with the content of
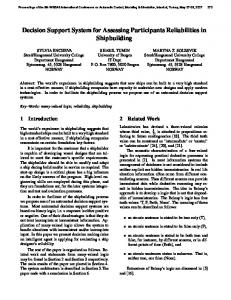
data warehouse in presence of data updating activity. The decision support system environment can be integrated in very natural way with Internet technology using decisional portals. Consequently, it can be easily extended the applicability of the method to the approximate query processing in an enterprise information portal, in which accurate estimates of answers are generally sufficient and/or tolerated by the decision makers. The web visualization of approximate indicators of the main statistical measures provides a useful support for the decisional information needs of the enterprise top managers (often there is no appreciable difference between exact values and the indicators from a graphical viewpoint), whereas the proximity to critical values can suggest a more detailed analysis on real data. The proposal approaches look also promising as a security-control method [2], because the statistical indicators do not derive from real data, but from the representation of the data distribution of the warehouse contents. As shown in Figure 1, we extend the traditional decision support system architecture with the capability of decisional portal at the analytic level and the approximate query processor at the data warehouse level.
Figure 1. Extension of decision support system architecture.
4 Decisional Portals Decisional portals are web-based systems supporting the enterprise top management. They are set up on the requirements of a specific departmental context
and, therefore, they can vary in structure and information content depending on the sector decisional support needs (for example, those of the Marketing & Sales sector and the Delivery sector of the same organization). A crucial component of decisional portals is the summary data section in which a set of statistical indicators regarding the organization data warehouse gives information on the progress of the specific field for which it has been planned. In these environments, an approximate query response method, like the one presented in the previous section, can be profitably used to reduce query response time and to advantage with respect to precise query processing. In fact, the indicators (graphical representations of statistical parameters) are views materialized online as the answer result of queries issued against the organization database. Therefore, the necessary use of Internet technology, through which the decisional portal both accesses to the data directly for query processing and presents the query results, is penalized for delays in the response times due to the fact that complex security procedures are necessary to accomplish access to reserved, protected, and critic data of the organization . Figure 2 shows an example of dash-board of decisional portal indicators based on exact query processing and graphically synthesizing the departmental scenario on which decisions have to be taken. As an example, one can visualize and control through simple indicators the sale percentage for departmental sections, the percentage of possibilities transformed in effective sales, the trend compared with the projections/previsions, and so on. All these indicators, the so-called Key Performance Indicators (KPI), give an immediate reading-key of the state of company sections. The red areas of some indicators are signals of unfavorable trends and the manager can decide to demand more detailed analysis through the portal itself. Therefore, the KPIs should not be static tools since the information reliability of the dash-board is strictly dependent on the fidelity of observed behavior patterns to actual behaviors in the data warehouse. The KPI indicators should be continually updated, possibly with access to the stored individual data in the data warehouse whenever data result significantly changed, in order to show always the last updated state of the company. As shown in Figure 2, the indicators are refreshed frequently in order to provide information at different level of data granularity and to gain in understanding of critical issues through interactive roll-up and drill-down operations. All these needs of indicator updating would be unsatisfactorily
Figure 2. Example of dash-board.
accomplished with an online access to data warehouse for time-consuming operations do not fit analysis activity. Figure 3 and 4 show in detail the indicator displayed in the decisional portal of Figure 2: Figure 3 shows the exact measure and Figure 4 the estimated quantity obtained with approximate query processing based on our analytic method. Notice that the graphical representation do not show significant differences between Figures 3 and 4 from the information viewpoint. However, when in doubt, the manager can always issue precise query process. Experiments of approximate query processing on a real database encourage us to carry on this approach (see Table 1). We have used a real database of about 76,000 objects. The queries have been executed taking into account three data dimensions: proceeds, time, and section. We have issued 100 online queries
Figure 3. Indicator relative to precise query processing.
Figure 4. Indicator relative to approximate query processing.
with different increasing range intervals to test the mean relative errors and response times both for approximate and precise query process, relative to COUNT and SUM functions and the bivariate CORREL correlation coefficient.
Function
Relative error
Approx. query response time
Exact query response time
0,19 0,8 80 3,17 1,5 96 CORREL 4,21 4 300 Table 1. Experimental results (mean values; time in secs.) COUNT SUM
4 Conclusions Decision support system context is mature for fast approximate answers to queries against large amount of data in data warehouses. There exists a variety of
approaches which yield estimates of database aggregate query results with an error magnitude that is acceptable in decisional activity environments. In addition, as an Internet-based application, it offers the following main advantages: Fast query response time. In Internet applications, it is relevant the problem of the concurrent access management at low value of timeout. The use of the canonical coefficients to solve queries reduces the response time and allows the portal to answer a number of queries at the same time without an excessive overload of the server. Low storage occupation. As all non parametric methods, and differently from sampling methods, the memory requirement for the canonical coefficients is independent of the quantity of individual data stored in the (very large) databases, but depends only on the approximation polynomial degree. (For example, for a three-dimensional distribution up to degree n = 29, the CC are stored approximately in 300 Kb). This is relevant in Internet applications to solve band problems (in the case of file downloads on the client) and to optimize the server storage. Easy updating process. Based on the additive property, the canonical coefficients are easily and immediately updated (for both insertion and deletion of data) without to re-scan the entire dataset. Moreover, there are no problems of synchronization, replication, and updating of multiple copies of the data. High security level. The fact that individual data are stored on clients whereas the CCs are available usually on the OLAP server, avoids the transmission of sensitive data so preventing the system from snooper’s and hacker’s attacks. References: [1] Acharya S., Gibbons P.B., Poosala V., and Ramaswamy S., Join Synopses for Approximate Query Answering, Proc. of the 1999 ACM SIGMOD Conf., Philadelphia, Pennsylvania, 1999, pp. 275-286. [2] Adam N.R. and Wortmann J.C., SecurityControl Methods for Statistical Databases: A Comparative Study, ACM Computing Surveys, Vol. 21, No. 4, 1989, pp. 515-556. [3] Agrawal D., El Abbadi A., Singh A., and Yurek T., Efficient View Maintenance at Data Warehouses, Proc. of the 1997 ACM SIGMOD Conf., Tucson, Arizona, 1997, pp. 417-427 [4] Amer-Yahia S. and Johnson T., Optimizing Queries on Compressed Bitmaps, Proc. of the 26th VLDB Conf., Cairo, Egypt, 2000, pp. 329338.
[5] Balmin A., Papadimitriou T., and Papakonstantinou Y., Hypothetical Queries in an OLAP Environment, Proc. of the 26th VLDB Conf., Cairo, Egypt, 2000, pp. 220-231. [6] Chakrabarti K., Garofalakis M., Rastogi R., and Shim K., Approximate Query Processing Using Wavelets, Proc. of the 26th VLDB Conf., Cairo, Egypt, 2000, pp. 111-122. [7] Chaudhuri S., Das G., Datar M., Motwani R., and Narasayya V., Overcoming Limitations of Sampling for Aggregation Queries, Proc. of the 2001 IEEE ICDE Conf., Heidelberg, Germany, 2001, pp. 534-542. [8] dell’Aquila C., Lefons E., and Tangorra F., Decisional Portal Using Approximate Query Processing, WSEAS Transactions on Computers, Vol. 2, No 2, 2003, pp 486-492. [9] Fayyad U., Piatetsky-Shapiro G., and Smyth P., The KDD process for extracting useful knowledge from volumes of data, Amer. Statist., Vol. 39, 1996, pp.27-34. [10] Ganti V., Lee M.L., and Ramakrishnan R., Icicles: Self-tuning Samples for Approximate Query Answering, Proc. of the 26th VLDB Conf., Cairo, Egypt, 2000, pp. 176-187. [11] Gibbons P.B., and Matias Y., New SamplingBased Summary Statistics for Improving Approximate Query Answers, Proc. of the 1998 ACM SIGMOD Conf., Seattle Washington, 1998, pp. 331-342. [12] Gupta A., Harinarayan V., and Quass D., Aggregate-Query Processing in Data Warehousing Environments, Proc. of the 21st VLDB Conf., Zurich, Switzerland, 1995, pp. 358-369. [13] Gupta H., Harinarayan V., Rajaraman A., and Ullman J.D., Index selection for OLAP, Proc. of the 1997 IEEE ICDE Conf., Birmingham, UK, 1997, pp. 208-219. [14] Haas P.J., Techniques for Online Exploration of Large Object-Relational Datasets, Proc. of the 11th SSDM Conf., Cleveland, Ohio 1999, 4-12. [15] Hellerstein J.M., Haas P.J., and Wang H.J., Online Aggregation, Proc. of the 1997 ACM SIGMOD Conf., Tucson, Arizona, 1997, pp. 171-182. [16] Ioannidis Y.E. and Poosala V., HistogramBased Approximation of Set-Valued Query Answers, Proc. of the 25th VLDB Conf., Edinburgh, Scotland, 1999, pp. 174-185. [17] Johnson T. and Shasha D., Some Approaches to Index Design for Cube Forests, IEEE Data Engineering Bull., Vol. 22, No. 4, 1999, pp. 2230.
[18] Lefons E., Silvestri A., and Tangorra F., An Analytic Approach to Statistical Databases, Proc. of the 9th VLDB Conf., Florence, Italy 1983, pp. 260-274. [19] Lefons E., Merico A., and Tangorra F., Analytical Profile Estimation in Database Systems, Information Systems, Vol. 20, No. 1, 1995, pp. 1-20. (Erratum for typos appear in Vol.4, No.4). [20] Mannila H. and Smyth P., Approximate Query Answering with Frequent Sets and Maximum Entropy, Proc. of the 2000 IEEE ICDE Conf., San Diego, California, 2000, p. 390. [21] Mannino M.V., Chu P., and Sager T., Statistical Profile Estimation in Database Systems, ACM Computing Surveys, Vol. 20, No. 3, 1988, pp. 191-221. [22] Matias Y., Vitter J.S., and Wang M., Dynamic Maintenance of Wavelets-Based Histograms, Proc. of the 26th VLDB Conf., Cairo, Egypt, 2000, pp. 101-110. [23] Mumick I.S., Quass D., and Mumick B.S., Maintenance of Data Cubes and Summary Tables in a Warehouse, Proc. of the 1997 ACM SIGMOD Conf., Tucson, Arizona, 1997, pp. 100-111. [24] Poosala V. and Ganti V., Fast Approximate Answers to Aggregate Queries on a Data Cube, Proc. of the 11th SSDM Conf., Cleveland, Ohio 1999, 24-33. [25] Shanmugasundaram J., Fayyad U., and Bradley P.S., Compressed Data Cubes for OLAP Aggregate Query Approximation on Continuous Dimensions, Proc. of the 1999 ACM SIGKDD Conf., San Diego, California, 1999, 223-232. [26] Vitter J.S. and Wang M., Approximate Computation of Multidimensional Aggregates of Sparse Data Using Wavelets, Proc. of the 1999 ACM SIGMOD Conf., Philadelphia, Pennsylvania, 1999, pp. 193-204. [27] Zhuge Y., Garcia-Molina H., Hammer J., and Widom J., View Maintenance in a Warehousing Environment, Proc. of the 1995 ACM SIGMOD Conf., San Jose, California, 1995, pp. 316-327.