hyperspectral systems as support in archaeological ... enhancement techniques that allow increasing and ... principles of multispectral research are very rare.
Archaeological usability of Hyperspectral images: successes and failures of image processing techniques A. Traviglia University of Venice, Italy
profession holding the technical capabilities to perform autonomously computer based RS research.
1 Introduction In the last decade, particular interest in the use of airborne hyperspectral systems as support in archaeological research has taken place in Italy, where the MIVIS sensor has found large application. The different projects involving its use have tried to demonstrate that MIVIS imagery represents an important complementary source of information for archaeological goals. However, in most of the cases, the limits and the problems generated by using hyperspectral images have never been stressed enough in the research reports, while the spotlight has been focused only on the positive outcomes.
Nowadays, if this process can be considered –partiallyaccomplished as regards to aerial picture management and even if many steps have been done in the last years toward a “technicalization” of archaeological researchers, still most of the multispectral and hyperspectral RS analysis is performed on the base of the division of roles between RS experts, in charge for the processing activity, and archeologists, in charge for the interpretation of the processed images and detected features. In most the cases the archaeologists have little or no knowledge of the processes applied, of their meaning or of what the derived images really display, which is often made clear by misunderstandings or readiness in the interpretation of detected anomalies. From the other side, in many cases also the RS experts, due to the lack of knowledge in the archaeological needs, are uncertain about what they are looking for and consequently in the processing phase do not always apply those processes that completely fulfill the archaeological needs. This distinction between the research roles strongly affects many research results that could be more significant and incisive if steps were taken in the direction of a reciprocal understanding of the principles and fundamentals of the two different disciplines. Unfortunately, at the moment, the cases of archaeologists who, supported by technical teams or in autonomy, have undertaken the study of the technical principles of multispectral research are very rare. When the archaeological interpretation process is carried out separately from the processing phase, the adopted processes can easily be misinterpreted in their meaning and an unjustified enthusiasm for the multi and hyperspectral analysis can occur. It is common to notice in the literature an easy attribution of archaeological reliability to detected features and anomalies without an accurate report of proof as if the usage of hyperspectral data would determine by itself the certainty of the achieved results. Often, the fact of being able to identify linear features or regular shapes on the landscape is put in direct relation with the presence of archaeological remains, most of the time without giving any explanation of the process of interpretation or explaining the basis for such certainty: the identified features are interpreted as archaeological without any ground truth or without the data (obtained by other sources such as published data, thematic cartography, reports data from field-walking surveys etc) cross processing.
In this paper, moving from a critical review of published reports and through the discussion of the results of a personal project based in NE Italy, in the surroundings of the urban area of Aquileia, an overview will be presented of the main problems encountered when dealing with hyperspectral images together with the presentation of positive aspects and results. Preliminary problems such as resolution, atmospheric corrections, noise reduction along with post-process issues such as redundancy of data and the large number of images to handle will be presented. Focus will be placed also on the fact that standard procedures cannot be largely and automatically applied without consideration of the landscape characteristics, the land coverage and the actual goals of the archaeological research. With this approach in mind, the paper will expose what one can reasonably expect to obtain by exploiting the spectral content of the MIVIS images and how this can be used to give prominence to the presence of certain ancient buried remains and structures. Starting with the most common technical issues encountered in pre-processing the raw images the paper will go through the enhancement techniques that allow increasing and improving the optic distinction between traces recorded in the scene by generating new images where the useful information is more easily identifiable. Some years ago in the Introduction to the Proceedings of the IX International School in Archaeology (“Remote Sensing in Archaeology”) held at Certosa di Pontignano (Siena, Italy), the editors expressed the hope that archaeologists could fully coordinate RS multidisciplinary projects in a short time, stressing the importance of the creation of an archaeological
123
FROM SPACE TO PLACE A total confidence in the technology has to be rejected because the role of the visual interpretation in the archeological research of the remotely sensed data is fundamental and it is still based on the classical criteria of the archaeological photo-interpretation: like in the aerial photo-interpretation, extreme caution is due (and opportune) in the explanation of the detected traces and anomalies, which is linked to the continuous comparison with other data sources.
been treated as primary, using orthorectified and georeferenced data in the further spectral processes. If not due to the immediate need of positioning data from direct ground survey of spectral signatures simultaneous to the flight recording (for example for SAM classification), the georeferencing process can be postponed and applied after the spectral analysis (Emmolo et al. 2004, p.493; Traviglia 2005a p. 145). Even in the need of referring multi-temporal runs, it can be decided to refer the images to another image used as reference in order to resample only one image (Emmolo et al. 2004, p. 493). It can result useful also to adopt a procedure of dividing each run into an n-number of sub-scenes: this can improve the accuracy in the process of registration, requires the identification of a smaller number of G.C.P. and is suitable for further spectral analysis based on radiometric statistic.
2 Primary issues of MIVIS data: ground resolution, geometrical distortion, atmospheric correction, noise removal A fact that is never stressed enough in the researches applying MIVIS hyperspectral data is the not always satisfying ground resolution of the sensor, measuring between 3x3 and 4x4 m, dependent on the flight altitude. This level of resolution, already outmoded by other similar products available on the market, is suitable for archeological application only in the case of macro-areas researches, since the features that MIVIS can reasonably detect must be, in the luckiest of the hypothesis, larger than an average area of 27/48 m2 (so basically at least 3 pixels) or a length of at least 6/8 m (2 pixels). A more reasonable expectation for identifiable feature size averages minimally between 80/100 m2 and a length of 20 m. As a consequence, the applications of these hyperspectral images within restricted urban areas or small portion of the landscape have to be considered potentially inadequate if not useless: while MIVIS can deal well in the identification of large built structures or settlements, canals or street networks, a large quantity of small archaeological remains can not be detected. For this reason it is important to investigate previously if the resolution at the ground provided by MIVIS images is suitable for the needs of a specific archaeological project on the basis of the expected types of remains and the kinds of archaeological structures that one expects to identify.
Another aspect that has been taken in consideration during pre-processing of MIVIS data is the atmospheric distortion and the consequent need for a correction. At the current state of the research, final and appropriate algorithms for application to MIVIS images has not been provided yet, so it has not often been possible to perform a specific atmospheric correction to the data used. In addition to that, usually no ground truth information for the time of the shots is available with the images, so that they could be used to implement appropriate corrections. The presence or absence of this pre-processing operation is seldom indicated in the research reports and even when stated little space is given to the process description. The lack of atmospheric disturbance removal can affect certain subsequent processes (e.g. some kind of Vegetation Indices -see Traviglia 2005a, p. 149-) so this should be taken in consideration both when planning the processes to apply and in the discussion of the obtained results that can be invalidated from the data used in the process. System noise strongly affects MIVIS images as well and its removal is rarely discussed as a pre-processing procedure. The chosen path is often to select a reduced number of non-noise affected bands to use in the further analysis, losing in this way a considerable amount of information and annulling the advantage of having a 102 band image by using only a small part of them.
When dealing with MIVIS images, a primary technical difficulty that has to be afforded is the rectification and georeferencing of the data. The images in fact are strongly affected from panorama distortions due to scanner geometry and from effects introduced by perturbations in position and attitude of the airborne platform. From one side, a geometric correction that rectifies the images is necessary not only to make more understandable and recognizable the features on the landscape but also to integrate the MIVIS data with other source data in a G.I.S. environment; from the other side, all of the most common procedures followed to rectify hyperspectral images risk to compromise the spectral content of the data set: this is particularly relevant if spectral analyses are going to be applied on the georeferenced data.
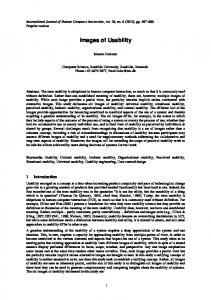
In order to overcome the shortcomings of the available data sets and improve the accuracy of the obtainable results, a noise removal process has been applied in the Aquileia project obtaining a drastic reduction of the unwanted disturbance due to limitations of the signal digitization and data recording process. In some cases, in fact, noise was not only degrading the true radiometric information content of the images of the case study area but also masking it so that several of them were totally useless. The successful noise reduction process tested consists of two steps: the first operation, the MNF (Minimum Noise Fraction), extracts the noise through the inherent dimensionality of image data, segregates it and reduces the computational requirements for subsequent processing (Boardman, Kruse 1994), the second consists
These considerations have received little attention in many studies where the geometric deformation issue has 124
A. TRAVIGLIA: ARCHAEOLOGICAL USABILITY OF HYPERSPECTRAL IMAGESS
Figure 1 Comparison of an original MIVIS band (a) to one subjected to MNF/Inverse MNF transformation (b)
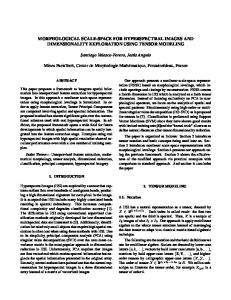
Figure 2 Comparison among vegetation indexes: a) true color image, b) DVI, c) NDVI, d) MSAVI2 in the inverse transformation of the previous step (Inverse MNF) that allows for the elimination of the system noise from the original bands by excluding the noise components from the inverse calculation. The images submitted to this process have shown a clear improvement in terms of signal noise and have been used in place of original data for most of the below described analysis processes (Fig. 1).
have been applied in the many projects involving the use of MIVIS data will be critically discussed and their results compared in order to define the ones that fit better the different research goals.
Vegetation Indices Vegetation Indices (VI) performed with hyperspectral MIVIS data find wide application in the archaeological research, since studies about the quality of the vegetation, monitoring variations in its vigor, can enable the detection of subterranean archaeological deposits that allow or, in opposition, limit the growth of the vegetation. As well known, heterogeneity of the texture of the subsoil
Still, despite these diminishing factors that necessarily need to be taken in consideration when planning a research using MIVIS shots, the negative aspects of the MIVIS data are overcome by their broad spectral content, which requires some interventions to be fully exploited. Various treatments and processing of the images that 125
FROM SPACE TO PLACE extraneous factors. However, in those circumstances, it provided better results than any other vegetation index only in case of high vegetation cover, while simultaneously highlighting its sensitivity to canopy background variations in case of low or sparse vegetation. In order to overcame the problems related to interference of the soil background in areas of low plant cover, MSAVI2 (2nd Modified Soil Adjusted Vegetation Index), -a recursion of MSAVI that attempts to reduce soil noise by shifting the place where the isovegetation lines meet (see Qi et al. 1994) - has been successfully applied. However, even if the index has shown encouraging results, it is important to point out that, despite the improvement in terms of accuracy, a difficulty that can happen is an increase in the sensitivity to variations in the atmosphere: this can cause variations in the calculated values of vegetation indices (Qi et al. 1994; Leprieur et al. 1996). Since no atmospheric correction has been performed on MIVIS images, the atmospheric distortion could be the cause of some of the poor results gained in a small number of the runs.
has a strong impact on the growth of the vegetation, creating the manifestation of the so called “crop-marks” over the vegetation canopy. Most of the archaeological researches involving the usage of VIs have used Normalized Vegetation Index (NDVI) more as a default than as the appropriate process based on the specific environmental and morphological characteristics of the target site, applying it in areas where no need for normalization was potentially required. Despite its large use over every type of environmental conditions, other VIs can achieve better results for archaeological purposes, depending on the vegetation coverage type and the density of the canopy: both being primary factors to keep in consideration when selecting the appropriate process to evaluate the biomass of a certain area, since they can strongly affect the results of the process itself. The suggested procedure to follow is to perform and test different vegetation indices after a careful consideration of the study case area characteristics. This means that in studying a vast area containing different vegetation coverage, the VIs must be singularly applied to fields with similar characteristics based on the type of canopy. The results gained can first be compared among themselves to determine the best method for evaluating vegetation health in the target area and secondarily with the original MIVIS images in order to verify the improvement of the visibility of traces they offer (Fig. 2).
In conclusion, it is important to stress that these results have been reached in a specific landscape context and that different outcomes could be achieved applying similar processes to areas with different morphological characteristics stressing the need for a preliminary analysis of the target area to identify the type of vegetation surface cover.
This process flow has been tested with good results in Aquileia area, a fertile flat plain mostly devoted to agricultural exploitation, where very different type of ground cover conditions are encountered, ranging from inhomogeneous vegetation growth (even inside the same field) to the heterogeneous density of the canopy. The comparison of the different VIs’ results confirmed that the type of surface under examination must previously be taken in consideration and that the same type of vegetation index cannot be applied to all situations. VIs, have been selected from a vast range in order to represent general vegetation indices and indices with correction for soils, one based on simple math (DVI) and two based on ratioing (NDVI and MSAVI2). Further investigation has been executed using orthogonal indices (PVI), but only as a preliminary step in the creation of a soil line (SL) since the limits of the equation mathematically defining a soil line in the PVI theory and the need of empirical data have been largely demonstrated.
PCA The Principal Component Analysis (PCA) has been adopted as an enhancement process in a small number of researches using MIVIS data, not as much as one would expect considering that the goal of the process is to reduce the information previously contained in the original n-band data set into a smaller number of new bands that can be used in place of the original ones, a solution extremely effective when dealing with such an elevated number of bands like in MIVIS. The application of the PCA to archaeological study can be of great utility since it provides supplementary information compared to the original bands, avoids useless loss of time in case of a preliminary surveying of the images and allows a better discrimination of different surfaces that become more distinguishable in visual analysis.
The application of the DVI -the subtraction operation involving the use of the Red and NIR bands- appeared to be satisfactory in case of low vegetation cover and in grounds without steep slopes.
In MIVIS images subjected to PCA, normally the PC 1 and 2 together, in most cases, account for about 98,90% of the total variability in the original bands and usually about 1% is found in 3rd Principal Component: PC1, PC2 and PC3 show virtually all of the variance in the scene (on average 99.6 %) and consequently of the total information. Components from PC4 and higher, usually contain all together only about 0.40 % of the variation in the data. However, some of these higher order components have demonstrated, at least for the Aquileia case study, to contain useful information, recognizable and identifiable only through a visual inspection of the
In those areas of inhomogeneous crop canopy or steep surfaces, where there is a shadow effect, the NDVI (Normalized Difference Vegetation Index) -the ratio obtainable dividing the difference between IR and red intensities by the total light being reflected- has demonstrated to have very good sensitivity to changes in vegetation cover and compensating for changing illumination conditions, surface slope, aspect and other 126
A. TRAVIGLIA: ARCHAEOLOGICAL USABILITY OF HYPERSPECTRAL IMAGESS image itself. Technically, high order Principal Components might be considered to be unworthy, having lower signal-to-noise ratio than the low-order Principal Components: here, instead, the presence of significant additional information that was not present in some of the lower orders has been noticed even up to the 30-40th Principal Components, the value varying from run to run. This recognition lead to the necessity for visually check all the produced Principal Component, singularly, rather than relying solely upon the magnitudes of the eigenvalues as an indicator of information content, in order to list the ones to keep for further processes.
alterations in the health of the vegetation and its growth, filled riverbeds, unexplainable alterations in the surface texture.
The most common procedure of visual inspection in PCA consists of generating a R.G.B. false color composites with the first 3 principal components of a scene (P.C.1, P.C. 2, P.C.3): this creates 6 different combinations. In the case of MIVIS data, applying the same procedure would mean excluding from the composite many of the lower order principal components that turn out to carry interesting information. For this reason, raising to 4 or 6 the number of principal components used in R.G.B. composites generates a total of 24 to 120 different combinations and minimizes the loss of information. Increasing the number of Principal Components combined into color composites was a successful procedure in the Aquileia case, providing interesting results in terms of visibility of specific types of features (such as certain soil irregularity or in terms of water penetration).
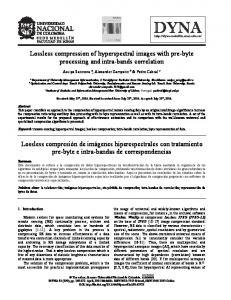
The possibilities offered by studying the tonal variations of the bare soil (damp-marks) are well known in archaeology: their existence in fact can be an indication of the presence in the subsoil of archaeological structures or ditches that inhibit or facilitate the absorption of rainwater and of the rising of humidity. The studying of the different degrees of water absorption of a soil becomes therefore particularly useful for the identification of buried archaeological sites. The Soil Line Index (SLI) created for hyperspectral MIVIS data in the course of the Aquileia project (Traviglia 2005b, pp.1970-1973) aims to constitute a support for the identification of traces over non-vegetated soil, emphasizing the wetness or the dryness of portions of the ground. Starting from the well-known concept of the linear relationship between the near-infrared and red reflectance, the SLI produces an image where the driest areas are represented in brighter and lighter colors compared to humid areas. For most of the sample areas, the application of the SLI has shown a clear improvement in the differentiation of the typologies of the soils, accentuating the dry-wet discrimination (Fig.3) and in this way making easier the distinction of lines or zones of different condition from the surrounding ground.
Soil Line Index A type of process that is not taken in any account in the archaeological research employing hyperspectral data is one which aims to provide an aid in the identification of anomalies on bare soil, increasing the optical distinction between the wetness or the dryness of a portion of the ground.
However, despite the recognizable advantages obtainable applying PCA, many details that are visible analyzing singularly the original bands cannot always be recognized in the PCs -single components or composites- because they are covered by the overlaying information from other bands. A better result in terms of recognizable features can be reached through the computation of spectral subsets (here referred as SPCA, Selective Principal Components Analysis, that is to say, a PCA computed for groups of bands, detected by a single spectrometer of the sensor or belonging the same spectral region) that can be visually analyzed singularly (see Merola 2005, pp. 311-313 and Traviglia in press) and through their composite (see Traviglia in press). The results obtainable from this technique can in fact be magnified by the combination of the different SPCs instead of relying only on the visual inspection of the first SPCs of each spectrometer. The selection of the SPC to use in these composites has been based on the Intrinsic Dimensionality (ID) of the data for each SPC, this leads to a quite large number of combination to deal with. The selection of the SPCs to combine has been expedited using a dedicated correlation matrix (Traviglia in press) in order to identify the best usable subset able to ensure no loss of spectral coverage. The use of this type of analysis provided very valuable results in terms of amount of recognizable features: the traces that were better emphasized were lineation of dry or wet soil in contrast with the surrounding soil,
Figure 3 Result of the application of a Soil Line Index (SLI): SLI (a) compared to an original band (b)
Classifications SAM (Spectral Angle Mapper) classification is one of the most often adopted process in the treatment of MIVIS 127
FROM SPACE TO PLACE data for archaeological goals, the results gained through its application seldom exposed clearly enough in terms of explaining the correlation between the archaeological buried remains and the actual identification of features from RI (rule images) obtained from spectral classes selected in advance (ROI, Region of Interest) and related to modern entities of the landscape. Due also to ground resolution of the data, the application of classification techniques, both supervised and unsupervised, often deliver invalid and questionable results in archaeological applications. For instance, they are conceptually useless when applied to bare soil areas, being potentially useful only in case of emerging structures (and in this case probably already known, also without RS analysis –unless positioned in recessed areas) or in case of enormous -and extremely rare- concentration of scattered building material or pottery remains. Where it can possibly be applied is in a reduced scale sample area, meaning an area like a single crop or bare soil field, where the spectral signatures of each soil type are known –in case of supervised classification- or strongly marked by archaeological remains -in case of unsupervised classification. The problem with classification techniques is two part. First is that most of the classifications require some a priori knowledge of the scene: in the case of supervised classification knowledge of the spectral signatures for classes relevant for detection of archaeological features and in the case of unsupervised classification a general notion of the number of distinct classes that are expected to be identifiable in the scene. Most of this information is often unavailable. The second part relates to the reduction of resolution found in the resulting classified image: central to classification is the grouping of pixels into a finite number of classes with no middle grounds. This leads to a flattening of the image into a reduced resolution with significant aliasing, which complicates the visual recognition process used in most of the archeological researches.
Figure 4 Combinations of SPCs and their quality scale tables, correlation and selection matrixes should be applied in order to reduce the images used in the next step of the research to a small number and be able to insure the complete coverage as regards to the detected traces. This types of solution has been applied in the Aquileia research, both to reduce the usable images in process cycles that could generate multiple images as results or to select the most significant (like in PCA and SPCA) and to reduce in a finale phase the total number of the obtained processed images. For instance, in the case of the SPCA, the spectral subset images were merged into one image and a correlation matrix of the components was calculated to identify a minimal images subset containing all the wanted information (ended up to be four). The consequent series of 24 combinations of the four selected PC images could be reduced by selecting sample areas representative of anomalies (in this example, four sample areas have been used: a sample area of anomalies on dry bare soil, one on wet bare soil, one on vegetation, one on sea water) and attributing to them a quality score from 1 (low visibility quality) to 5 (high visibility quality). The sum of the four grades given for each combination provided the scale index of the quality of the composite
For these reasons, in the Aquileia project, classifications, having shown their limits and incapability to provide any original or unique results that cold not be reached through other more credible processes, have been discarded from the routine processes applied to the various runs.
Image number reduction The amount of processes tested over the hyperspectral shots also clearly generates an issue with the number of produced images. We are dealing here with a 102 bands image; even considering realistically to use 1/10 of the bands for simple TC/FC composites and for the multiple processes, the number of produced images that must be subjected to visual analysis and interpretation is too large. For this reason it is necessary to define a set of procedure to reduce the number of final images to be used, selecting the ones that do not carry redundant information. Consequently, comparison tables, cross process coverage
128
A. TRAVIGLIA: ARCHAEOLOGICAL USABILITY OF HYPERSPECTRAL IMAGESS
Figure 5 Cross process coverage table. The i.d. process number is shown in the right table and the first 3 or 4 combination of images of the scale were the ones used for archaeological interpretation.
the landscape in which there is a higher probability to find archaeological deposits.
In case of having to manage a large amount of images resulting from different processes another way to compare the results is to look at the coverage between processes, which means comparing the number of traces common to two given processes against the total of one of the processes. This is possible through a table listing the traces found in a process versus the number of those specific traces also found in other processes (Fig.4) For example, 39 of the 253 traces visible in True Colors are also seen in SPC of Red bands: this gives SPC Red about 15% coverage over True Colors. Reversing it, this means that 39 of the 45 traces found in SPC Red are also seen in True Colors, giving True Colors about 87 % coverage over SPC Red.
Until now the GIS platforms have been sparsely employed in archaeological RS research or used only to provide and manage archaeological and topographical data matching them through a simple overlay. The increased number of processed images and consequent data amount obtainable in the long term using MIVIS images imposes the usage of a more complex GIS architecture, the new needs pushing in the direction of more advanced structures that allow for more sophisticated storing and visualization techniques. In this way the GIS assumes an indispensable role in the interpretation of remotely sensed data leading to a multitools approach which in a multi-scale and diachronic context is the only reliable way to deliver effective contributions in the understanding of settlement patterns.
GIS
Conclusions
The use of GIS in RS research manages all the archaeological and topographical data necessary to eventually recognize the detected surface anomalies as ancient origin traces, in absence and/or in support of ground truth information. GIS is the obvious choice where the nature and attributes of each feature identified in the remotely sensed images can be stored, investigated and its causes determined by putting it in relationship with the contiguous aspects of the landscape and with all the other data extracted from various sources: the ability to manage this body of information can lead to a correct interpretation of the identified features. An useful interpretation tool that has been adopted in the Aquileia project, where no specific ground truth data was at disposal, was attributing to each of the detected feature, as result of the interpretation process, a value of visibility and archaeological reliability that express an evaluation about the quality of the observed feature. Although unable to substitute the value of field-walking survey, these attributes can at least emphasize those locations on
The introduction of multispectral and hyperspectral data in the archeological research during the last years has created lot of expectations, often not really fulfilled from the results gained. Working with MIVIS images over a long period, evaluating a direct experience and observing results achieved in other similar projects, revealed positive and negative aspects of this sensor. As a general statement it can be asserted that the value of the MIVIS images relies more in their spectral content than in their spatial resolution, which cannot be considered completely adequate for the search of small archaeological remains (e.g.