ARCHITECTURE EVALUATION STRATEGY FOR DSP SOFTWARE DEVELOPMENT Anu Purhonen VTT Electronics, Embedded Software Software Architectures Group Tel. +358 8 551 2436, Fax +358 8 551 2320 P.O.Box 1100, FIN-90571 Oulu, Finland
[email protected]
ABSTRACT In order to be useful, developed software architecture should be validated against its quality requirements. Architecture evaluation is a process that analyses architectural decisions and how well they fulfil quality requirements. Digital signal processing (DSP) software development has traditionally concentrated on optimisation of the signal processing algorithms. However, the importance of software architecture design has increased in recent years. Architecture evaluation results create the basis for design rationale that can be used in the later phases of the development. This paper presents an evaluation strategy for supporting the work of a DSP software architect. Keywords: Architecture evaluation, Software architecture, DSP, Software engineering
1/8
1. INTRODUCTION An essential part of a mobile wireless system is digital signal processing. It creates the part of the physical layer, which is devoted to the physical transmission of information between distant entities. Characteristic of DSP functions is that they should be performed in a strict time frame with restricted resources. Traditionally, the development of physical layer architecture has concentrated on finding optimal algorithms using mathematical models and simulations. The emergence of more powerful processors and compilers and at the same time the increase of control type of functionality has caused the importance of software architecture design to increase. Products have to be evaluated from two perspectives: ability to fulfil the functional requirements, and ability to respond to the quality requirements. Classic testing often concentrates on functionality. In this work, the purpose of the evaluation is to give quantitative or qualitative values that the software architect can use to compare and justify design decisions. Because functionality is not architectural in nature [1], the basic assumption is that the required functionality exists in every case. Because of these reasons, this work concentrates on quality evaluation. Architecture evaluation contains several types of analysis. Usually, each quality attribute is first analysed separately and after that, the individual results are compared in order to find out conflicts and to perform an overall optimisation. Quantitative methods are suitable for analysing operational qualities such as performance [2, 3, 4, 5]. Scenario-based methods are used for analysing development qualities such as modifiability [6, 7, 8, 26]. The success of scenario-based methods depends on the quality of the elicited scenarios [9, 10]. Metrics [11, 12, 13] are used for estimating internal properties of the system such as complexity. Metrics-based and scenariobased approaches can also be combined [14]. Scenarios are useful for restricting the scope of the quantitative analysis for the most critical cases. There are not yet commercial tools for architecture trade-off studies. However, several research projects are producing guidelines for clarifying quality conflicts [15, 16, 17, 18]. The contribution of this work is to create a starting point for defining an evaluation strategy for DSP software architecture development. The goal is to combine assets for a DSP software architect to be able to compare design decisions during the architecture development. In this early stage, the goal has been to find and enhance methods that do not need any additional diagrams in addition to architectural descriptions made in UML. Furthermore, it was required that the evaluation should be able to be made without tools, although it is an advantage when there are commercial tools available. This paper first describes the benefits of the architecture evaluation for DSP software development. After that example architecture is defined that is then used for illustrating the defined evaluation strategy. The results of the evaluation of the example architecture are presented. Finally, the characteristics of the evaluation strategy and future research are discussed.
2. BACKGROUND Why especially DSP software development benefits from architecture evaluation: Software architects have to justify resource requirements imposed by software architecture to hardware architects. Ultimately a longer experience of evaluation can give a way to quantify software cost. • Software architects should be able to analyse impact of the hardware architecture features to software before hardware is fixed. • Simulation models of algorithms give a goal as to what kind of performance should be achieved with the system. However, the environmental constraints and additional control needed hinders that goal from ever fully being achieved. Architecture evaluation gives an estimate of how close to the ideal the solution under consideration is. It is an important feature for the customers especially in the base station development. • DSP software designers have to cope with uncertain and changing requirements. Time-to-market pressures force the starting of several design activities concurrently, so that requirements may still be unclear when a design task begins. Architecture evaluation allows the impact of possible future changes to be assessed. •
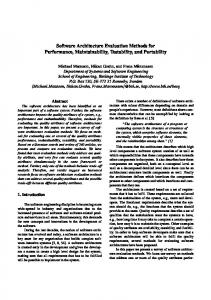
3. EXAMPLE ARCHITECTURE The architecture evaluation strategy was developed when preparing DSP software architecture for a hypothetical future multimedia terminal [19]. The terminal is capable of connecting to the next generation public mobile phone networks and future wireless local area networks. The main goals of the DSP system were to optimise the use of hardware resources and to support use of several networks. The DSP software architecture is described with four views [20]. The logical view describes the required functionality in an implementationindependent way. The physical view summarises the important aspects of hardware architecture. The runtime operation is defined in the process view. Finally, the development view shows the modules that should actually be developed. The logical view of the architecture is shown in Figure 1.
2/8
Controller 1 1
*
Specifies
1
Configurator 1
1
Connection
*
1
1
Maps
Configures
*
* Algorithm *
* Service
1
Figure 1. Logical view of example architecture During the development of the example architecture one of the main design decisions was the selection of the architectural style for the process view. Initially, pipes and filters style (option 1) was selected and first version of the process view was made using it. After that a second version of the process view was made using blackboard style (option 2). The following presentation of the evaluation strategy includes examples of the artefacts of the evaluation of these two process views i.e. architecture candidates that have different process views but are otherwise the same.
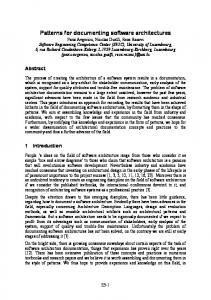
4. EVALUATION STRATEGY The proposed architecture quality evaluation strategy is summarised in Figure 2. It is divided into three main phases: creation of evaluation criteria, actual evaluation, and architecture refinement. The results of the evaluation process are quality attribute profiles, evaluation result report, and the refined architecture. The evaluation strategy combines several of the methods and techniques used in the literature. In the performance impact analysis the guidelines of Rate-Monotonic-Analysis (RMA) were followed [23]. For variability analysis, techniques from Software Architecture Analysis Method (SAAM) [26] were applied. The cost analysis includes an estimation of resource and development costs. The trade-off analysis contains steps in which each change that is proposed after individual impact analysis is studied separately and the effect that the change would have on the other attributes are analysed. The ideas of Architecture Tradeoff Analysis Method (ATAM) are utilised [16], although the full ATAM might be more useful in review-type of usage. Evaluation criteria Performance profile
Scenario elicitation
Variability profile
Architecture candidate Weighing
Cost profile
Evaluation Performance impact analysis
Variability impact analysis
Cost impact analysis
Architecture refinement
Evaluation result
Result analysis
Figure 2. Quality evaluation strategy. 4.1 CREATION OF EVALUATION CRITERIA Quality attribute profiles create the test cases for quality evaluation. “A profile is a set of scenarios, generally with some relative importance associated with each scenario” [21]. The main quality attributes for DSP software are performance, cost and variability [22]. Traditionally the main effort has been put into the optimisation of
3/8
throughput and latencies and the minimisation of resource cost, and today, ease of development and endurance to future changes are also considered. Evaluation criteria are created in two phases: 1. Scenario elicitation. Scenario elicitation includes the creation of profiles for the three quality attributes. The selected scenarios should be as concrete as possible. 2. Weighing. Weight shows the relative criticality or importance of the scenario. On the other hand, especially in variability scenarios, it shows the likelihood of the scenario appearing. Weight is used in selecting the most critical scenarios for more detailed analysis and in trade-off analysis. Performance profile is a group of worst-case usage scenarios. It is a sub-group of the usage scenarios that are used for validating functionality. The usage of several types of resources should be balanced, so that worst-case situations can still be under control. The art of evaluation is to find the critical scenarios - limiting the number to as few scenarios as possible - to make the evaluation process fast. When evaluating the example architecture two different types of scenarios for performance profile were prepared. The first one was used for ensuring that the maximum allowed values were never exceeded for latency, in order to ensure reliable operation of the system. The most typical user scenario was considered to be a GSM voice call. Therefore, it was used for minimising the power consumption. Both of these scenarios had equal importance. Cost profile is dependent on how many different feature sets have been defined for the architecture. Cost profile is used when trying to find the optimal feature set for a system or for comparing architecture candidates for a particular feature set. The profile should include the scenarios that are critical in terms of product and development cost. In the example architecture development, cost was estimated only for one feature set, which was defined in the requirements. The Variability profile includes the change scenarios. Because it is impossible to detect and use all the possible scenarios that may exist, the scenarios are handled in categories. Part of the variability profile for the example architecture is presented in Table 1. The table groups the scenarios according to the source of the change request. Table 1. Variability profile. Source Changes in the external components Changes in functional requirements Changes in quality requirements
Scenario Change the type of a processor.
Weight 0.8
New mode in addition to GSM/WCDMA/WLAN is needed.
0.5
Cost should be decreased. One processor instead of two is used.
0.7
4.2 IMPACT ANALYSIS An impact analysis is based on the created profiles and on the quantitative values for the quality attribute measures that are given in the requirement specifications. In the impact analysis, the impact of each scenario to an architecture candidate is assessed using different types of methods. 4.2.1 Performance Before measurements can be made estimates are needed for execution times of the processes, hardware components and support functionality such as context switches. In addition, the amount of data transferred between the processes should be estimated. For each scenario in the performance profile, the values of performance measures (latency, throughput, memory utilisation, processor utilisation, bus utilisation, power utilisation) are measured and then compared to the requirements. In the example architecture, RMA was used. RMA is a collection of quantitative methods that enable real-time system developers to understand, analyse, and predict the timing behaviour of real-time systems [23]. RMA was chosen because it can be applied manually, although there are commercial schedulability analysers available that are based on RMA [24, 25]. Furthermore, no new diagrams had to be drawn in addition to UML diagrams in order to be able to use it. 4.2.2 Cost A cost impact analysis is divided into the following estimations: product cost, effort, amount of personnel, duration of work (i.e. time-to-market). Time-to-market is estimated from the module development times and the architecture’s integrability. Module development time depends on the complexity of the module, the size of the module, and the experience of the developer. From these, architecture can affect the first two. The hardware cost is established on the basis of resource usage estimates. Metrics [11, 12] such as structural complexity can support e.g. the estimation of effort. However, the complexity estimates of the signal processing algorithms are usually received from the algorithm designers. 4.2.3 Variability A variability impact analysis is performed in two phases like in SAAM [26]. First, each scenario is analysed individually. The second task is to reveal scenario interaction. The variability scenarios are change scenarios.
4/8
The values for variability measures are estimated for each scenario in order to be able to analyse the impact of the scenario. The variability measures are the cost of the change and the complexity of the architecture after the change. Only relative values are used for evaluating the impact of the scenario. In our case, we sum up the results of the variability measures and give one qualitative value for the impact: minimum, low, high, or maximum. If there is a maximum impact for a relevant scenario, the evaluated architecture cannot be accepted. In case of minimum impact, there is no need for changes in the architecture. The most interesting cases are the high and low impact. All the high impact cases should be carefully studied and considered if there is a way to reduce the impact. In case of low impact, the weight of the scenario is used for selecting only the most critical scenarios for detailed analysis. An example of the impact analysis is shown in Table 2. Table 2. Variability impact analysis Scenario New type of processor
Description When the processor is changed it mainly concerns the operating system because it is assumed that no processorspecific assembly is used in application code.
One processor instead of two.
When a new processor is taken into use, the load of the two processors has to be divided.
Impact RTOS has to be ported to new processor => minimum if execution time estimates remain the same New versions of drivers might be needed Rearrangement of process view => high to process view
4.3 RESULT ANALYSIS The main task of result analysis is to identify the quality conflicts. Quality conflicts occur when some features are advantageous to one quality but unfavourable to another quality. After the quality conflicts are found, the weights can be used to make compromises. A result analysis is divided into three tasks: 1. An analysis of the individual qualities based on the impact analysis results. In the event that the architecture does not fulfil the quality requirements, changes are proposed. In Table 3, there is an example of the analysis of variability. 2. An analysis of conflicting requirements using the impact analysis results. Each proposed change is analysed for its impact concerning the other quality attributes. In Table 4, there is an example of the trade-off analysis. In some cases, quality attribute measures are especially sensitive to certain parameters in the architecture [16]. For example, the processor utilisation rate and the latencies are dependent on periods of the processes and bus capacity. The point at which the optimal result is received should be found. 3. An analysis of the evaluation results, and making a decision upon whether the architecture candidate thus fulfils the requirements or not. If the candidate is not good enough, refinements are needed. Table 3. Example result analysis of variability 1
Problem Data process has to be always changed when algorithm interface changes.
2
Controller is too complicated
Alternative solutions 1. Interface converter 2. Dynamic inheritance pattern 1. Division to resource and pipeline managers
Table 4. Example trade-off analysis Result of impact analysis Minimise power utilisation.
Shorten latencies.
The same encoding is used in two processes.
Control process is too complicated
Change request Performance Enable dynamic processes, remove inactive processes, re-arrange processes and shutdown the hardware parts when they are not active. Increase parallelism by finding out the optimum period. Variability Move the encoding to a separate process.
It is divided into two processes. Resource management is separated to a different process.
5/8
Trade-off The critical use of dynamic processes does not cause unnecessary overhead and therefore can be accepted. Does not affect other quality attributes except buffer utilisation. Too much overhead compared to the execution time of the encoding. Adds a little bit to the execution time but because it is not critical functionality it is ok.
4.4 ARCHITECTURE REFINEMENT The architecture refinement is performed in two phases: An analysis of the required changes. The refinement of the architecture can be directed to software architecture, hardware architecture, or even to algorithm design. After the refinement responsibilities are divided between these three areas, the actual refinement can be performed separately. 2. Actual refinement. Each view has specific patterns, styles and other strategies that can be used to achieve better quality. 1.
5. EVALUATION OF THE EXAMPLE ARCHITECTURE The performance impact analysis was performed using the execution time estimates from hardware architecture design for individual components. In addition, the time spent in control operations was estimated. The cost impact analysis was difficult to perform because there was no estimation of the organisation that would develop the system. Therefore, relative values were used in the analysis. Resource usage estimates for product cost were received from hardware architecture design. In addition, the complexity estimates that were used in development time estimation were received from algorithm experts. The results of the analysis were used only for comparing the architecture candidates after the other analysis. Option 1, using the pipes and filters style, was evaluated twice. After the first evaluation some refinements were made to the process view. In the second evaluation, the results of the first evaluation were used when applicable. Option 2, using the blackboard style, was evaluated once. The process view based on the pipes and filters style was considered to be the better alternative with the given requirements. The reason for this was the slightly better result in the cost analysis and the fact that the performance of the other candidate based on blackboard style was too sensitive to changes in process partition and periods. If an emphasis were laid on the importance of adaptability so that the implementation platform of an algorithm would be selected for each call separately, the blackboard architecture would be a valid option.
6. DISCUSSION Because many properties of the system are still unknown in the architecture design phase, there may exist doubts about whether evaluation based on the estimates is reliable enough. However, the purpose is not to give any exact values of the quality of the architecture, but to make comparisons and find possible problems. The evaluation of the example architecture showed that, even with inadequate knowledge of the system in the early phases of the development, the architecture evaluation could be used for comparing design decisions. The openness of the process enables the same tests to be repeated when more accurate knowledge is available. In the end, even the final, implemented product can be evaluated in order to find out whether the initial assumption applies and the selected architecture still fulfils its requirements. This evaluation was done manually; however, when there are larger evaluation profiles and several iterations of the architecture candidates, good tools are necessary. Because there are several methods with different features, the evaluation strategy should allow selection of a method that best suits the conditions in which the evaluation is performed. For example, in the early phases methods that do not need implementation may be necessary but often some of the features can be analysed with code derived from earlier products. The problem with the existing evaluation methods is often that they are not meant for the architecture phase and they are too time-consuming to be used for architecture evaluation. Usually, evaluation methods need some sort of implementation of the system. Simulation of individual design problems can help in making design decisions. However, because the underlying hardware is usually not ready when DSP software architecture is designed and the tools are not ready either, the analysis of the whole architecture with a prototype is usually not possible. Another reason for simple tools is that DSP software is usually not very large compared to many other systems often used as examples of architecture design. Most of the work is done in the signal processing algorithms and the functionality is generally very restricted by these standards. Thus, it would not be costeffective to spend too much time in evaluating the architecture candidates or individual architectural decisions. This work is a first step towards meeting the needs for architecture evaluation in DSP software development. Several existing methods can be utilised at least after some modifications. Further research is needed in selecting and applying the performance and cost estimation methods and finding out the tools that could help in automating the process.
7. CONCLUSION This paper presented a basis for developing a framework for architecture evaluation that supports DSP software development. Architecture evaluation is an integral part of DSP software development and helps in fulfilling the quality requirements set for the software. First, the architect uses it when selecting architectural
6/8
structures in supporting decisions. Secondly, it is a basis for a design rationale that explains the decisions made for the needs of the future. Finally, it can be used in different phases of development, when new information has been received, to ensure that the architecture still fulfils the requirements. In order to be useful, architecture evaluation should be fast to perform. Although several methods and techniques are already available, they need modifications and enhancing. In addition, the most suitable combination of the methods should be selected. This is how this research will continue in the future.
Acknowledgements This paper is based on the work carried out in the MULTICS (“The Architecture Study of Next Generation Multistandard Mobile Terminal and Basestation”) project financed by the Technology Development Centre of Finland (TEKES), Nokia Research Centre and Elektrobit Ltd.
References [1] Bass, L., Clements, P., Kazman, R. 1998. Software Architecture in Practice. Reading, Massachusetts: Addison-Wesley. 452 p. ISBN 0-201-19930-0 [2] Nord, R.L., Cheng, B.C. 1994. Using RMA in Evaluating Design Decisions, Position paper. Proceedings of the Second IEEE Workshop on Real-Time Applications, IEEE Computer Society, Washington D.C. USA, July 1994. [3] Xu, J., Kuusela, J. 1998. Analyzing the execution architecture of mobile phone software with colored Petri nets. International Journal on Software Tools for Technology Transfer. Vol 2 No 2. ed. Pp. 133-143. [4] Petriu, D., Shousha, C., Jalnapurkar, A. 2000. Architecture-Based Performance Analysis Applied to a Telecommunication System. IEEE Transactions on Software Engineering. Vol. 26, No. 11. Pp. 1049-1065. [5] Aquilani, F., Balsamo, S., Inverardi, P. 2001. Performance analysis at the software architectural design level. Performance Evaluation. Vol. 45. Pp. 147-178. [6] Lassing, N. 2001. Architectural-Level Modifiability Analysis. PhD Thesis, URL: http://www.cs.vu.nl/~nlassing. Vrije Universiteit. 236 p. [7] Dobrica, L., Niemelä, E. 2000. A strategy for analysing product line software architectures. VTT publications, URL: http://www.inf.vtt.fi/pdf/. Espoo: Technical Research Centre of Finland. 124 p. [8] Bengtsson, PO., Lassing, N., Bosch, J., van Vliet, H. 2000. Analyzing Software Architectures for Modifiability, Research Report 2000:11, University of Karslkrona/Ronneby, URL: http://www.ipd.hk-r.se. 28 p. [9] Lassing, N., Rijsenbrij, D., van Vliet, H. 1999. The goal of software architecture analysis: confidence building or risk assessment. Proceedings of the 1st Benelux conference on state-of-the-art of ICT architecture. Amsterdam, Netherlands: Vrije Universiteit. 6p. [10] Bass, L., Klein, M., Moreno, G. 2001. Applicability of General Scenarios to the Architecture Tradeoff Analysis Method, Technical Report CMU-SEI-2001-TR-014. Software Engineering Institute, Carnegie Mellon University. 65 p. [11] Briand, L.C., Morasca, S. 1996. Property-Based Software Engineering Measurement. IEEE Transactions on Software Engineering, Vol. 22. No. 1. Pp. 68-85. [12] Weyuker, E.J. 1988. Evaluating software complexity measures. IEEE Transactions on Software Engineering, Sept. 1988. Vol. 14, No. 9. Pp. 1357-1365. [13] Bengtsson, P., Bosch, J. 1999. Architecture Level Prediction of Software Maintenance. Proceedings of Third European Conference on Software Maintenance and Reengineering, Amsterdam, Netherlands, March 1999. Pp. 139-147. [14] Briand, L.C., Wüst, J. 2001. Integrating scenario-based and measurement-based software product assessment. The Journal of Systems and Software . Vol. 59. Elsevier. Pp. 3-22. [15] Bosch, J., Molin, P. 1999. Software Architecture Design: Evaluation and Transformation. Proceedings of IEEE Engineering of Computer Based Systems Symposium (ECBS99), December 1999. 10 p. [16] Kazman, R., Klein, M., Barbacci, M., Longstaff, T., Lipson, H., Carriere, J. 1998. The Architecture Tradeoff Analysis Method. Proceedings of the 4th International Conference on Engineering of Complex Computer Systems (ICECCS98), Monterey, CA. [17] Boehm, B., In, H. 1996. Identifying Quality-Requirement Conflicts. IEEE Software. Vol. 13, No. 2. Pp. 2535. [18] Gacek, C. 1998. Detecting Architectural Mismatches During Systems Composition, Doctoral Dissertation, Center for Software Engineering. Los Angeles, CA 90089: University of Southern California.
7/8
[19] Soininen, J-P, Purhonen, A, Rautio, T., Kasslin, M., 2001. Mobile multi-mode terminal: making trade-offs between software and fixed digital radio, in E.Del Re (Ed.) Software Radio: technologies and services. London: Springer-Verlag. Pp. 237-249. [20] Purhonen, A. 2002. Using architectural views in DSP software development. Proceedings of the IASTED International Conference, Applied Informatics, International Symposium on Software Engineering, Databases, and Applications, February 18-21, 2002, Innsbruck, Austria. Pp. 97-102. [21] Bosch, J. 2000. Design and Use of Software Architectures, Adopting and evolving a product-line approach. Pearson Education Limited. 354 p. ISBN 0-201-67494-7 [22] Purhonen, A.2001. Quality Attribute Taxonomies for DSP Software Architecture Design. Proceedings of the 4th International Workshop on Product Family Engineering, European Software Institute (ESI), Bilbao, Spain, October 3-5, 2001, Pp. 223-233. [23] Klein, M.H., Ralya, T., Pollak, B., Obenza, R., Harbour, M.G. 1993. A Practitioner's Handbook for RealTime Analysis: Guide to Rate Monotonic Analysis for Real-Time Systems. Massachusetts: Kluwer Academic Publishers. ISBN 0-7923-9361-9 [24] Rapid RMA, Tri-Pacific Software, Inc. URL: http://www.tripac.com [25] TimWiz, TimeSys. URL: http://www.timesys.com [26] Kazman, R., Abowd, G., Bass, L., Clements, P. 1996. Scenario-Based Analysis of Software Architecture. IEEE Software. Vol. 13, No. 6. Pp. 47-55.
8/8