Partially miscible system, binodal curve, modeling, artificial ... the biological nervous system. ... Artificial neural network model is developed based on the.
International Journal of Computer Applications (0975 – 8887) Volume 52 – No. 8, August 2012
Artificial Neural Network Modeling of Equilibrium Relationship for Partially Miscible Liquid-Liquid Ternary System S. L. Pandharipande
Yogesh Moharkar
Associate Professor Laxminarayan Institute of Technology Rashtrasant Tukadoji Maharaj Nagpur University, Nagpur
M.Tech Laxminarayan Institute of Technology Rashtrasant Tukadoji Maharaj Nagpur University, Nagpur
ABSTRACT The equilibrium relationship for a ternary mixture containing one pair of partially miscible components can be expressed in the form of a ternary diagram depicting a binodal curve. Depending upon the location of the point representing the composition of the mixture, the ternary diagram may be divided into three parts 1, 2 & 3, for, whether the point is on the Binodal curve, single phase region or two phase region, respectively. Because of this unique nature of equilibrium relationship modeling of such partially miscible ternary system becomes very complex. Artificial neural network (ANN) is an upcoming modeling tool & has high accuracy levels even for processes involving multivariable non-linear relationships. The objective of the present work is to develop ANN models for the system of acetic acid-water-benzene for prediction of type of resulting mixture whether single homogeneous liquid phase, two immiscible liquid phases or a single equilibrium liquid phase of the pair of partially miscible system. The equilibrium data generated experimentally has been used. Different topology of ANN architecture has been tried for model 1 & 2. Selection of ANN model is based on the comparison of % relative error for predicted output values for ANN model-1 & 2. The highlight of the present work is the successful incorporation of the linguistics variables in a model with coded values.
Keywords Partially miscible system, binodal curve, modeling, artificial neural network
1. INTRODUCTION The separation of the components of a liquid mixture by treatment with a solvent in which one or more of the desired components is preferentially soluble is known as liquid–liquid extraction. Addition of a third component to a homogeneous binary liquid mixture may result in one of the three types of systems, which are: (a) A homogeneous liquid system where all the three components are miscible with each other resulting in a single homogeneous liquid phase
(b) A completely immiscible liquid-liquid system where the third component added is not miscible with the binary mixture thus resulting into two immiscible liquid phases (c) A pair of partially miscible system. This is more complex than the two other systems. There are two possibilities when known quantity of a third liquid component is added to a binary mixture. The resulting mixture may lead to a single phase homogeneous ternary mixture. This is because all the three components are completely miscible with each other for the given composition. The second possibility is that, the resulting mixture has two immiscible liquid phases, each having all the three components with different compositions. This is due to the partial miscibility of one pair of components with each other whereas the remaining two pairs are completely miscible. Such a system is also referred as a system with one pair of partially miscible components. There are few isolated systems reported in the literature with more than one pair of partially miscible systems [1].
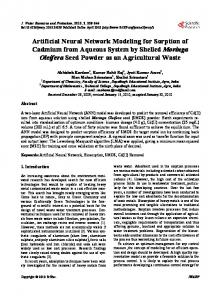
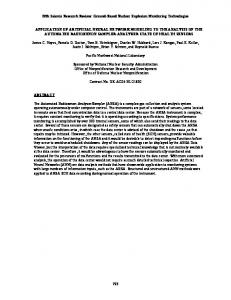
2. ARTIFICIAL NEURAL NETWORK An Artificial Neural Network (ANN) is an information processing paradigm that is based on the working principle of the biological nervous system. It consists of a large network of processing elements called as nodes working in unified manner [2]. The most common type of ANN employed for modeling of processes & operations is Multi Layer Perceptron (MLP). It is a type of feed forward neural network & consists of input, output & hidden layers. The input & output layers have as many neurons or nodes in it, as the number of input & output parameters. The nodes between the two successive layers are fully connected by means of constants called as weights. The outputs from nodes of input layer are fed to hidden layer nodes, which in turn, feed their outputs to the next hidden nodes. The hidden nodes pass the net activation through a function, such as the logistic sigmoidal or hyperbolic tangent to calculate the outputs. Training of the ANN is prerequisite in developing a model & error back propagation algorithm suggested by Rumelhart[3] is popular for this task. This is based on a nonlinear version of the Windro-Hoff rule known as Generalized Delta Rule (GDR). The schematic of the typical MLP network used in developing ANN model in the present work is shown in fig 1.
1
International Journal of Computer Applications (0975 – 8887) Volume 52 – No. 8, August 2012
Weight % of Acetic Acid Coding of various phases Weight % of Acetic Acid
Input
Hidden layer
Output
Figure no 1: Simple feed forward neural network with one hidden layer Various applications of ANN are, an approach to fault diagnosis in chemical processes[4], fault diagnosis in complex chemical plants[5], incipient fault diagnosis of chemical process[6], leak detection in liquefied gas pipeline[7],[8], for estimation of mass transfer coefficient for fast fluidized bed solids[9], modeling of distillation column[10], detergent formulation[11], modeling of unsteady heat conduction in semi infinite solid[12], prediction of mass transfer coefficient in downflow jet loop reactor[13] and modeling of packed column[14] and similar other[15,16,17] are also reported.
5
48.83
46.05
6.44
6
57.25
36.38
6.36
7
65.98
26.95
8.08
8
64.48
15.38
20.147
9
46.64
4.92
48.59
10
11.383
3.25
85.36
11
22.34
3.194
74.46
3. PRESENT WORK 3.1 Introduction to Present Work
12
32.9
3.136
63.96
13
42.21
5.03
52.75
The present work is aimed at generation of the liquid-liquid equilibrium data experimentally for a partially miscible ternary system of Acetic acid-Water-Benzene (AWB). Artificial neural network model is developed based on the experimental values.
14
50.08
6.786
42.36
15
58.33
9.26
32.4
16
63.49
13.83
22.67
17
65.83
20.4
13.72
18
61.24
33.08
5.66
3.2 Materials and Method The present work is divided in following parts[18]: 1.
Generation of equilibrium data experimentally for the liquid-liquid partially miscible system of acetic acid-water-benzene. Development of artificial neural network models for the liquid-liquid equilibrium data generated as in part 1.
2.
3.3 Experimental procedure i.
ii.
Known composition of acetic acid-water mixtures are prepared and benzene is added to it till the point of turbidity is reached. The procedure is repeated for known composition mixtures of acetic acid-benzene. Water is added till the turbidity is reached. The composition of the ternary miscible system is thus determined and is as given in table-1.
Table 01: Experimental liquid-liquid equilibrium data Sample no.
Weight% of acetic acid
1
9.921
85.11
Weight% of benzene 4.959
2
19.75
75.31
4.936
3
31.41
63.802
4.77
4
38.82
55.51
5.66
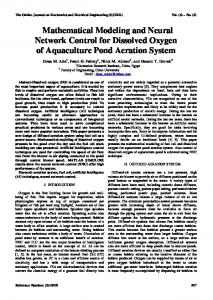
Weight% water
Wt % acetic acid
Part 2 SINGLE PHASE REGION
Part 1 EQUILIBRI UM CURVE
Part 3 TWO PHASE REGION
Wt % of benzene
Wt % of water
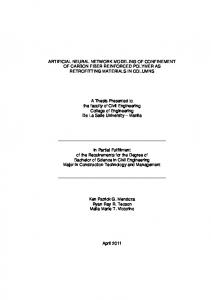
Figure no.2: Binodal curve of acetic acid-water-benzene system The experimental equilibrium data for system Acetic acid (A) –Water (B) –Benzene(C) is plotted on triangular graph as shown in Fig no 02. The component A is a solute & is completely miscible with the two solvent components B and C which are only partially miscible with each other. The area
2
International Journal of Computer Applications (0975 – 8887) Volume 52 – No. 8, August 2012 under the curve represents a two-phase region, and area above the curve represents the single phase region. If a mixture having composition falling in the two phase region is prepared then it will split up into two liquid phases that are at equilibrium with each other. Thus the composition of a ternary mixture is divided into three regions or parts as shown in figure 2. Parts 1, 2 & 3 may be referred for; on binodal curve, single phase region & two phase region respectively.
difficult to be included in the conventional mathematical models. The linguistic variables in the form of part 1, 2 and 3 as defined in the liquid-liquid equilibria of the present work are coded as given in table-2. Table 2: Coded linguistic variable
3.4 Neural Network Topology for ANN model -1 and model -2 The two input parameters used for developing ANN model -1 and model -2 are; compositions of the ternary liquid mixture expressed as mass % acetic acid & mass % of water. Similarly the single output parameter is coded as numerical value of 0 or 1 or -1 representing that given composition at a point in liquid-liquid equilibria diagram is either on the equilibrium curve or two phase or single phase region respectively. The special feature of artificial neural network modeling is its ability to incorporate the linguistic variables which are
Code assigned for artificial neural network modelling 0 -1 1
Ternary Mixture zone Part -1 Part -2 Part -3
Topology is one of the important factors in determination of the accuracy of artificial neural network model. In present work two different topologies have been used for developing ANN models – 1 & 2. The details of topology of the ANN model -1 and model -2 is given in table -3. The comparison of the performance of ANN models have also been carried out.
Table 3: Topology of the ANN model -1 and model -2 No. of neurons ANN model
Input layer
1st Hidden layer
ANN model-1 Simple
2
ANN model-2 complex
2
Data points
2nd Hidden layer
3rd Hidden layer
Output layer
Training
0
5
5
1
18
0
10
10
1
18
30 15 10 5 3
1 1 1 1 1
0.887133 0.970409 0.941698 0.962477 0.925634
0.966136 0.995787 0.986874 0.993478 0.965671
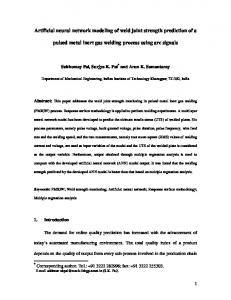
The actual and predicted output values obtained by using ANN model -1 and model -2 are plotted as shown in fig - 3. As can be seen from the graph the predictions are with high accuracy and are indicative of the liquid-liquid equilibria zones of the ternary mixture. Actual output 1.5 1 Coded values
The details of the output obtained by using ANN model -1 & model -2 is given as in table -4. Table no.4: Predicted output values for ANN model -1 and model -2. Act Mass ANN model ANN model Mass% of ual %of 1 output 2 output acetic acid out water For simple For complex put 15 80 0 0.268674 -0.00396 25 70 0 0.276695 0.030296 44 50 0 0.364089 0.144989 55 38 0 0.263047 -0.02901 63 30 0 0.452919 0.092779 67 18 0 0.10893 0.049129 60 30 0 -0.03747 -0.05066 45 6 0 0.085918 0.01198 35 4 0 0.031606 0.006823 10 4 0 0.070111 0.048858 10 75 -1 -1 -1 30 50 -1 -1 -0.99999 50 40 -1 -0.99974 -0.99999 30 60 -1 -0.99895 -0.99939 55 25 -1 -0.89821 -0.95592 35 35 -1 -1 -1 40 20 -1 -1 -1 15 45 -1 -1 -1 15 15 -1 -1 -1 10 87 1 0.75301 0.917023 30 66 1 0.849348 0.831429 50 45 1 0.935173 0.980518
65 80 75 60 30
0.5 0 1
3
5
7
9 11 13 15 17 19 21 23 25 27
-0.5 -1 Data Points -1.5 Figure no. 3: Comparison of actual and predicted output obtained by ANN mode -1 & model -2
3
International Journal of Computer Applications (0975 – 8887) Volume 52 – No. 8, August 2012 Table no.5: Relative error of predicted output values for ANN model 1 and ANN model-2. percen Predicted Predicted percenta tage Actua coded coded ge relativ l values of values of relative e error outpu output output error for for t ANN ANN ANN ANN model 1 model 2 model1 model 2 0 0.268674 -0.00396 0 0 0 0.276695 0.030296 0 0 0 0.364089 0.144989 0 0 0 0.263047 -0.02901 0 0 0 0.452919 0.092779 0 0 0 0.10893 0.049129 0 0 0 -0.03747 -0.05066 0 0 0 0.085918 0.01198 0 0 0 0.031606 0.006823 0 0 0 0.070111 0.048858 0 0 -1 -1 -1 0 0 -1 -1 -0.99999 0 0.001 -1 -0.99974 -0.99999 0.026 0.001 -1 -0.99895 -0.99939 0.105 0.061 -1 -0.89821 -0.95592 10.179 4.408 -1 -1 -1 0 0 -1 -1 -1 0 0 -1 -1 -1 0 0 -1 -1 -1 0 0 1 0.75301 0.917023 24.699 8.2977 1 0.849348 0.831429 15.0652 16.857 1 0.935173 0.980518 6.4827 1.9482 1 0.887133 0.966136 11.2867 3.3864 1 0.970409 0.995787 2.9591 0.4213 1 0.941698 0.986874 5.8302 1.3126 1 0.962477 0.993478 3.7523 0.6522 1 0.925634 0.965671 7.4366 3.4329
30 percentage relative error for model-1
Relative error
25 20 15 10 5 0
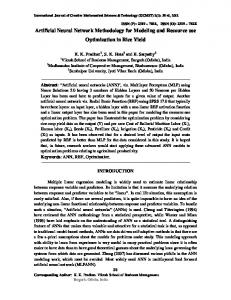
range of 0.0 to 24 where as for model -2 it is between 0.0 to 16.
4. CONCLUSION The equilibrium relationship for a ternary mixture containing one pair of partially miscible components can be expressed in the form of a ternary diagram depicting a binodal curve. Depending upon the location of the point representing the composition of the mixture, the ternary diagram may be divided into three parts 1, 2 & 3, for, whether the point is on the Binodal curve, single phase region or two phase region, respectively. Modeling of such a complex system is difficult using conventional models and very little has been reported in a literature. The present work has been able to address this problem & has developed ANN models successfully with high accuracy. Based on result & discussion it can be concluded that the ANN model-2 developed in the present work is more accurate in predicting the location of the point representing the concentration of the ternary mixture in the liquid-liquid equilibria zone. The highlight of the present work is the successful incorporation of the linguistics variables in a model in addressing to the complex problem of liquid-liquid equilibria of a ternary system with one pair of partially miscible components.
5. ACKNOWLEDGMENTS Authors are thankful to Director, Laxminarayan Institute of Technology, RTMNU, Nagpur for constant encouragement.
6. REFERENCES [1] Coulson and Richardson. 2002. chemical engineering volume-2 fifth edition- Particle Technology and Separation Processes, pp.721. [2] Anderson, J.A. 1999. “An Introduction to Neural Networks (Prentice-Hall of India, Pvt. Ltd New Delhi),” [3] Rumelhart, D.E. and McClleland, 1986. “Back Propagation Training Algorithm Processing,” M.I.T Press, Cambridge Massachusetts. [4] Fan, J.Y. Nikolau M. & White, R.E. 1993. “An approach to Fault diagnosis of chemical processes in Neural networks,” AIChE, 82-88. [5] Hoskins, J.C. Kaliyur, K.M. & Himmelblau, D.M. 1991 “Fault diagnosis in complex chemical plants using artificial neural network,” AIChEJ, 137-141. [6] Watanabe, K. M., Matsuura Abe, I., Kubota, M. and Himmelblau, D. M. 1989 “Incipient fault diagnosis of chemical processes via artificial neural networks,” AIChEJ, 1803-1812.
1 3 5 7 9 11 13 15 17 19 21 23 25 27 Data point Figure no.4: Relative error of experimental output and predicted output values for the composition and predicted data
[7] Belsito, S. & Banerjee, S. 1998. “Leak detection in liquefied gas pipelines by Artificial neural networks,” AIChEJ, 2675-2688.
The criterion for selection of suitable ANN model is based on the comparison of the relative error for all the data points. The relative error of predicted output of all coded values for ANN model -1 and model -2 is as shown in table -5. Figure no 4 shows a graph plotted for relative error of the predicted output values using ANN model-1 and model-2. It can be seen from the graph that the relative error for ANN model -1 is in the
[9] Zamankhan, P., Malinen, P., Lepomaki, H. 1997. “Application of neural networks to mass transfer predictions in a fast fluidized bed of fine solids,” AIChEJ, 1684-1690.
[8] Pandharipande, S. L. Badhe, Y.P. 2003. “ANN for leak detection in pipelines.” Chem Eng World, 70-72.
4
International Journal of Computer Applications (0975 – 8887) Volume 52 – No. 8, August 2012 [10] Baratti, R., Vacca, G., Servida, A. 1995. “Neural networks modeling of distillation columns,” Hydrocarbon Processing, 35-38.
[14] Pandharipande, S. L., Mandavgane, S. A., 2004. “Modeling of packed column using artificial neural networks,” Indian J Chem Tech, 820-824.
[11] Pandharipande, S. L., Agarwal, R.S., Gogte, B. B., Badhe, Y. P., 2003. “Detergent formulation by artificial neural network,” Chem Eng World, 78- 80.
[15] Pandharipande, S. L., Bhaise, A., Poharkar, A., 2004. “Steam tables: Using Artificial Neural Networks,” Chem Eng world, 50-54.
[12] Pandharipande, S.L., Badhe, Y.P. 2003. “Unsteady state heat conduction in semi infinite solids artificial neural networks,” Chem Eng World, 82-84.
[16] Pandharipande, S.L., Badhe, Y.P. 2004. “Artificial neural networks for Gurney- Lurie and Heisler Charts,” J Inst Eng, 65-70.
[13] Pandharipande, S.L., Badhe, Y.P. 2003. “Prediction of mass transfer coefficient in downflow jet loop reactor using artificial neural network,” Indian Chemical Engineer, 256-258.
[17] Pandharipande, S.L., Badhe, Y.P. elite-ANN©. 2004; ROC No SW-1471 India. [18] Yogesh Moharkar, Minor project report submitted for degree of M Tech at Rashtrasant Tukadoji Maharaj Nagpur University.
5