28 Jan 2009 ... 1.3 POWER DISSIPATION IN CMOS IC'S.. ..... synthesized FIFO example is used
in the physical design IC Compiler Tutorial .................................
ASIC Design Flow Tutorial Using Synopsys Tools
By Hima Bindu Kommuru Hamid Mahmoodi
Nano-Electronics & Computing Research Lab School of Engineering San Francisco State University San Francisco, CA Spring 2009
San Francisco State University
Nano-Electronics & Computing Research Lab
1
TABLE OF CONTENTS WHAT IS AN ASIC? ........................................................................................................ 5 1.0 INTRODUCTION ..................................................................................................................................... 5 1.1 CMOS TECHNOLOGY ........................................................................................................................... 6 1.2 MOS TRANSISTOR ................................................................................................................................ 6 Figure 1.2a MOS Transistor ................................................................................................................. 6 Figure 1.2b Graph of Drain Current vs Drain to Source Voltage ........................................................ 7 1.3 POWER DISSIPATION IN CMOS IC’S ..................................................................................................... 8 1.4 CMOS TRANSMISSION GATE ............................................................................................................... 8 Figure 1.4a Latch.................................................................................................................................. 9 Figure 1.4b Flip-Flop ........................................................................................................................... 9
OVERVIEW OF ASIC FLOW ..................................................................................... 10 2.0 INTRODUCTION ....................................................................................................................................10 Figure 2.a : Simple ASIC Design Flow ................................................................................................11
SYNOPSYS VERILOG COMPILER SIMULATOR (VCS) TUTORIAL ............... 13 3.0 INTRODUCTION ....................................................................................................................................13 3.1 TUTORIAL EXAMPLE ............................................................................................................................14 3.1.1 Compiling and Simulating ..........................................................................................................14 Figure 3.a: vcs compile........................................................................................................................15 Figure 3.b Simulation Result ...............................................................................................................16 3.2 DVE TUTORIAL................................................................................................................................17 APPENDIX 3A: OVERVIEW OF RTL ........................................................................................................28 3.A.1 Register Transfer Logic ..............................................................................................................28 3.A.2 Digital Design ...........................................................................................................................30 APPENDIX 3B: TEST BENCH / VERIFICATION ................................................................................30 3.B.1 Test Bench Example: ..................................................................................................................33
DESIGN COMPILER TUTORIAL [RTL-GATE LEVEL SYNTHESIS] ............... 37 4.0 INTRODUCTION ....................................................................................................................................37 4.1 BASIC SYNTHESIS GUIDELINES ..................................................................................................39 4.1.1 Startup File .................................................................................................................................39 4.1.2 Design Objects ............................................................................................................................40 4.1.3 Technology Library .....................................................................................................................41 4.1.4 Register Transfer-Level Description ...........................................................................................42 4.1.5 General Guidelines .....................................................................................................................43 4.1.6 Design Attributes and Constraints ..............................................................................................44 4.2 TUTORIAL EXAMPLE ............................................................................................................................46 4.2.1 Synthesizing the Code .................................................................................................................48 Figure 4.a : Fragment of analyze command ........................................................................................50 Figure 4.b Fragment of elaborate command .....................................................................................51 Figure 4.c: Fragment of Compile command ........................................................................................53 4.2.2 Interpreting the Synthesized Gate-Level Netlist and Text Reports ..............................................54 Figure 4.d : Fragment of area report .................................................................................................55 Figure 4.e: Fragment of cell area report ............................................................................................55 Figure 4.f : Fragment of qor report ...................................................................................................56 Figure 4.g: Fragment of Timing report ...............................................................................................57 Figure 4.h : Synthesized gate-level netlist ...........................................................................................58 4.2.3 SYNTHESIS SCRIPT ............................................................................................................................58 Note : There is another synthesis example of a FIFO in the below location for further reference. This synthesized FIFO example is used in the physical design IC Compiler Tutorial .................................60 APPENDIX 4A: SYNTHESIS OPTIMIZATION TECHNIQUES ..........................................................60 4. A.0 INTRODUCTION ...............................................................................................................................60
San Francisco State University
Nano-Electronics & Computing Research Lab
2
4. A.1 MODEL OPTIMIZATION....................................................................................................................60 4.A.1.1 Resource Allocation .................................................................................................................60 Figure 4A.b. With resource allocation. ................................................................................................61 4.A.1.2 Flip-flop and Latch optimizations ...........................................................................................64 4.A.1.3 Using Parentheses ...................................................................................................................64 4.A.1.4 Partitioning and structuring the design. ..................................................................................65 4.A.2 OPTIMIZATION USING DESIGN COMPILER ........................................................................................65 4.A.2.1 Top-down hierarchical Compile ..............................................................................................66 4.A.2.2 Optimization Techniques .........................................................................................................67 4. A.3 TIMING ISSUES ................................................................................................................................70 Figure 4A.b Timing diagram for setup and hold On DATA .................................................................70 4.A.3.1 HOW TO FIX TIMING VIOLATIONS .....................................................................................71 Figure 4A.c : Logic with Q2 critical path ............................................................................................73 Figure 4A.d: Logic duplication allowing Q2 to be an independent path. ...........................................73 Figure 4A.e: Multiplexer with late arriving sel signal .........................................................................74 Figure 4A.f: Logic Duplication for balancing the timing between signals .........................................74 Figure 4.A.g : Logic with pipeline stages ............................................................................................74 4A.4 VERILOG SYNTHESIZABLE CONSTRUCTS ..........................................................................................75
5.0 DESIGN VISION ...................................................................................................... 78 5.1 ANALYSIS OF GATE-LEVEL SYNTHESIZED NETLIST USING DESIGN VISION ..................78 Figure 5.a: Design Vision GUI ...........................................................................................................78 Figure 5.b: Schematic View of Synthesized Gray Counter ..................................................................79 Figure 5.c Display Timing Path ...........................................................................................................81 Figure 5.d Histogram of Timing Paths ................................................................................................81
STATIC TIMING ANALYSIS ...................................................................................... 82 6.0 INTRODUCTION ....................................................................................................................................82 6.1 TIMING PATHS .....................................................................................................................................82 6.1.1 Delay Calculation of each timing path: ......................................................................................83 6.2 TIMING EXCEPTIONS ............................................................................................................................83 6.3 SETTING UP CONSTRAINTS TO CALCULATE TIMING:.............................................................................83 6.4 BASIC TIMING DEFINITIONS: ...............................................................................................................84 6.5 CLOCK TREE SYNTHESIS (CTS): .........................................................................................................85 6.6 PRIMETIME TUTORIAL EXAMPLE ..............................................................................................86 6.6.1 Introduction.................................................................................................................................86 6.6.2 PRE-LAYOUT ....................................................................................................................................86 6.6.2.1 PRE-LAYOUT CLOCK SPECIFICATION ..............................................................................87 6.6.3 STEPS FOR PRE-LAYOUT TIMING VALIDATION ...................................................................87
IC COMPILER TUTORIAL ......................................................................................... 92 8.0 BASICS OF PHYSICAL IMPLEMENTATION..............................................................................................92 8.1 Introduction ...................................................................................................................................92 Figure 8.1.a : ASIC FLOW DIAGRAM ...............................................................................................92 8.2 FLOORPLANNING ................................................................................................................................93 Figure 8.2.a : Floorplan example ........................................................................................................94 8.3 CONCEPT OF FLATTENED VERILOG NETLIST .......................................................................................97 8.3.a Hierarchical Model: ...................................................................................................................97 8.3.b Flattened Model: .........................................................................................................................98 Figure 8.c Floorplanning Flow Chart .................................................................................................98 8.4 PLACEMENT .........................................................................................................................................99 8.5 Routing ........................................................................................................................................100 Figure 8.5.a : Routing grid ................................................................................................................101 8.6 PACKAGING .......................................................................................................................................102 Figure 8.6.a : Wire Bond Example ....................................................................................................102
San Francisco State University
Nano-Electronics & Computing Research Lab
3
Figure 8.6.b : Flip Chip Example ......................................................................................................103 8.7 IC TUTORIAL EXAMPLE ..............................................................................................................103 8.7.1 INTRODUCTION ...............................................................................................................................103 CREATING DESIGN LIBRARY .........................................................................................................106 FLOORPLANNING ...........................................................................................................................109 PLACEMENT.....................................................................................................................................112 CLOCK TREE SYNTHESIS ...............................................................................................................115 CTS POST OPTIMIZATION STEPS ..................................................................................................116 ROUTING ..........................................................................................................................................117
EXTRACTION ............................................................................................................. 121 9.0 INTRODUCTION ..................................................................................................................................121
APPENDIX A: DESIGN FOR TEST.......................................................................... 126 A.0 INTRODUCTION .................................................................................................................................126 A.1 TEST TECHNIQUES ............................................................................................................................126 A.1.1 Issues faced during testing .......................................................................................................126 A.2 SCAN-BASED METHODOLOGY ..........................................................................................................126 A.3 FORMAL VERIFICATION ....................................................................................................................128
APPENDIX B: EDA LIBRARY FORMATS ............................................................. 128 B.1 INTRODUCTION .................................................................................................................................128
San Francisco State University
Nano-Electronics & Computing Research Lab
4
What is an ASIC? 1.0 Introduction Integrated Circuits are made from silicon wafer, with each wafer holding hundreds of die. An ASIC is an Application Specific Integrated Circuit. An Integrated Circuit designed is called an ASIC if we design the ASIC for the specific application. Examples of ASIC include, chip designed for a satellite, chip designed for a car, chip designed as an interface between memory and CPU etc. Examples of IC’s which are not called ASIC include Memories, Microprocessors etc. The following paragraphs will describe the types of ASIC’s. 1. Full-Custom ASIC: For this type of ASIC, the designer designs all or some of the logic cells, layout for that one chip. The designer does not used predefined gates in the design. Every part of the design is done from scratch. 2. Standard Cell ASIC: The designer uses predesigned logic cells such as AND gate, NOR gate, etc. These gates are called Standard Cells. The advantage of Standard Cell ASIC’s is that the designers save time, money and reduce the risk by using a predesigned and pre-tested Standard Cell Library. Also each Standard Cell can be optimized individually. The Standard Cell Libraries is designed using the Full Custom Methodology, but you can use these already designed libraries in the design. This design style gives a designer the same flexibility as the Full Custom design, but reduces the risk. 3. Gate Array ASIC: In this type of ASIC, the transistors are predefined in the silicon wafer. The predefined pattern of transistors on the gate array is called a base array and the smallest element in the base array is called a base cell. The base cell layout is same for each logic cell, only the interconnect between the cells and inside the cells is customized. The following are the types of gate arrays: a. Channeled Gate Array b. Channelless Gate Array C. Structured Gate Array When designing a chip, the following objectives are taken into consideration: 1. Speed 2. Area 3. Power 4. Time to Market To design an ASIC, one needs to have a good understanding of the CMOS Technology. The next few sections give a basic overview of CMOS Technology.
San Francisco State University
Nano-Electronics & Computing Research Lab
5
1.1 CMOS Technology In the present decade the chips being designed are made from CMOS technology. CMOS is Complementary Metal Oxide Semiconductor. It consists of both NMOS and PMOS transistors. To understand CMOS better, we first need to know about the MOS (FET) transistor.
1.2 MOS Transistor MOS stands for Metal Oxide Semiconductor field effect transistor. MOS is the basic element in the design of a large scale integrated circuit is the transistor. It is a voltage controlled device. These transistors are formed as a ``sandwich'' consisting of a semiconductor layer, usually a slice, or wafer, from a single crystal of silicon; a layer of silicon dioxide (the oxide) and a layer of metal. These layers are patterned in a manner which permits transistors to be formed in the semiconductor material (the ``substrate''); The MOS transistor consists of three regions, Source, Drain and Gate. The source and drain regions are quite similar, and are labeled depending on to what they are connected. The source is the terminal, or node, which acts as the source of charge carriers; charge carriers leave the source and travel to the drain. In the case of an N channel MOSFET (NMOS), the source is the more negative of the terminals; in the case of a P channel device (PMOS), it is the more positive of the terminals. The area under the gate oxide is called the ``channel”. Below is figure of a MOS Transistor.
Figure 1.2a MOS Transistor
The transistor normally needs some kind of voltage initially for the channel to form. When there is no channel formed, the transistor is said to be in the ‘cut off region’. The voltage at which the transistor starts conducting (a channel begins to form between the source and the drain) is called threshold Voltage. The transistor at this point is said to be in the ‘linear region’. The transistor is said to go into the ‘saturation region’ when there are no more charge carriers that go from the source to the drain.
San Francisco State University
Nano-Electronics & Computing Research Lab
6
Figure 1.2b Graph of Drain Current vs Drain to Source Voltage
CMOS technology is made up of both NMOS and CMOS transistors. Complementary Metal-Oxide Semiconductors (CMOS) logic devices are the most common devices used today in the high density, large number transistor count circuits found in everything from complex microprocessor integrated circuits to signal processing and communication circuits. The CMOS structure is popular because of its inherent lower power requirements, high operating clock speed, and ease of implementation at the transistor level. The complementary p-channel and n-channel transistor networks are used to connect the output of the logic device to the either the VDD or VSS power supply rails for a given input logic state. The MOSFET transistors can be treated as simple switches. The switch must be on (conducting) to allow current to flow between the source and drain terminals. Example: Creating a CMOS inverter requires only one PMOS and one NMOS transistor. The NMOS transistor provides the switch connection (ON) to ground when the input is logic high. The output load capacitor gets discharged and the output is driven to a logic’0’. The PMOS transistor (ON) provides the connection to the VDD power supply rail when the input to the inverter circuit is logic low. The output load capacitor gets charged to VDD . The output is driven to logic ’1’. The output load capacitance of a logic gate is comprised of a. Intrinsic Capacitance: Gate drain capacitance ( of both NMOS and PMOS transistors) b. Extrinsic Capacitance: Capacitance of connecting wires and also input capacitance of the Fan out Gates. In CMOS, there is only one driver, but the gate can drive as many gates as possible. In CMOS technology, the output always drives another CMOS gate input. The charge carriers for PMOS transistors is ‘holes’ and charge carriers for NMOS are electrons. The mobility of electrons is two times more than that of ‘holes’. Due to this the output rise and fall time is different. To make it same, the W/L ratio of the PMOS transistor is made about twice that of the NMOS transistor. This way, the PMOS and San Francisco State University
Nano-Electronics & Computing Research Lab
7
NMOS transistors will have the same ‘drive strength’. In a standard cell library, the length ‘L’ of a transistor is always constant. The width ‘W’ values are changed to have to different drive strengths for each gate. The resistance is proportional to (L/W). Therefore if the increasing the width, decreases the resistance.
1.3 Power Dissipation in CMOS IC’s The big percentage of power dissipation in CMOS IC’s is due to the charging and discharging of capacitors. Majority of the low power CMOS IC designs issue is to reduce power dissipation. The main sources of power dissipation are: 1. Dynamic Switching Power: due to charging and discharging of circuit capacitances A low to high output transition draws energy from the power supply A high to low transition dissipates energy stored in CMOS transistor. Given the frequency ‘f’, of the low-high transitions, the total power drawn would be: load capacitance*Vdd*Vdd*f 2. Short Circuit Current: It occurs when the rise/fall time at the input of the gate is larger than the output rise/fall time. 3. Leakage Current Power: It is caused by two reasons; a. Reverse-Bias Diode Leakage on Transistor Drains: This happens in CMOS design, when one transistor is off, and the active transistor charges up/down the drain using the bulk potential of the other transistor. Example: Consider an inverter with a high input voltage, output is low which means NMOS is on and PMOS is off. The bulk of PMOS is connected to VDD. Therefore there is a drain-to –bulk voltage –VDD, causing the diode leakage current. b. Sub-Threshold Leakage through the channel to an ‘OFF’ transistor/device.
1.4 CMOS Transmission Gate A PMOS transistor is connected in parallel to a NMOS transistor to form a Transmission gate. The transmission gate just transmits the value at the input to the output. It consists of both NMOS and PMOS because, PMOS transistor transmits a strong ‘1’ and NMOS transistor transmits a strong ‘0’. The advantages of using a Transmission Gate are: 1. It shows better characteristics than a switch. 2. The resistance of the circuit is reduced, since the transistors are connected in parallel. Sequential Element In CMOS, an element which stores a logic value (by having a feedback loop) is called a sequential element. A simplest example of a sequential element would be two inverters connected back to back. There are two types of basic sequential elements, they are: 1. Latch: The two inverters connected back to back, when connected to a transmission gate, with a control input, forms a latch. When the control input is high (logic ‘1’), the transmission gate is switched on and whatever value which was at the input ‘D’ passes to the output. When the control input is low, the transmission gate is off and the inverters that are connected back to back hold the
San Francisco State University
Nano-Electronics & Computing Research Lab
8
value. Latch is called a transparent latch because when the ‘D’ input changes, the output also changes accordingly.
D
Q
G
Figure 1.4a Latch 2. Flip-Flop: A flip flop is constructed from two latches in series. The first latch is called a Master latch and the second latch is called the slave latch. The control input to the transmission gate in this case is called a clock. The inverted version of the clock is fed to the input of the slave latch transmission gate. a. When the clock input is high, the transmission gate of the master latch is switched on and the input ‘D’ is latched by the 2 inverters connected back to back (basically master latch is transparent). Also, due to the inverted clock input to the transmission gate of the slave latch, the transmission gate of the slave latch is not ‘on’ and it holds the previous value. b. When the clock goes low, the slave part of the flip flop is switched on and will update the value at the output with what the master latch stored when the clock input was high. The slave latch will hold this new value at the output irrespective of the changes at the input of Master latch when the clock is low. When the clock goes high again, the value at the output of the slave latch is stored and step’a’ is repeated again. The data latched by the Master latch in the flip flop happens at the rising clock edge, this type of flip flop is called positive-edge triggered flip flop. If the latching happens at negative edge of the clock, the flip flop is called negative edge triggered flip flop.
Master
Slave
D
Q
CLK
Figure 1.4b Flip-Flop
San Francisco State University
Nano-Electronics & Computing Research Lab
9
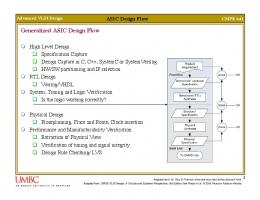
Overview of ASIC Flow 2.0 Introduction To design a chip, one needs to have an Idea about what exactly one wants to design. At every step in the ASIC flow the idea conceived keeps changing forms. The first step to make the idea into a chip is to come up with the Specifications. Specifications are nothing but Goals and constraints of the design. Functionality (what will the chip do) Performance figures like speed and power Technology constraints like size and space (physical dimensions) Fabrication technology and design techniques The next step is in the flow is to come up with the Structural and Functional Description. It means that at this point one has to decide what kind of architecture (structure) you would want to use for the design, e.g. RISC/CISC, ALU, pipelining etc … To make it easier to design a complex system; it is normally broken down into several sub systems. The functionality of these subsystems should match the specifications. At this point, the relationship between different sub systems and with the top level system is also defined. The sub systems, top level systems once defined, need to be implemented. It is implemented using logic representation (Boolean Expressions), finite state machines, Combinatorial, Sequential Logic, Schematics etc.... This step is called Logic Design / Register Transfer Level (RTL). Basically the RTL describes the several sub systems. It should match the functional description. RTL is expressed usually in Verilog or VHDL. Verilog and VHDL are Hardware Description Languages. A hardware description language (HDL) is a language used to describe a digital system, for example, a network switch, a microprocessor or a memory or a simple flip-flop. This just means that, by using a HDL one can describe any hardware (digital) at any level. Functional/Logical Verification is performed at this stage to ensure the RTL designed matches the idea. Once Functional Verification is completed, the RTL is converted into an optimized Gate Level Netlist. This step is called Logic/RTL synthesis. This is done by Synthesis Tools such as Design Compiler (Synopsys), Blast Create (Magma), RTL Compiler (Cadence) etc... A synthesis tool takes an RTL hardware description and a standard cell library as input and produces a gate-level netlist as output. Standard cell library is the basic building block for today’s IC design. Constraints such as timing, area, testability, and power are considered. Synthesis tools try to meet constraints, by calculating the cost of various implementations. It then tries to generate the best gate level implementation for a given set of constraints, target process. The resulting gate-level netlist is a completely structural description with only standard cells at the leaves of the design. At this stage, it is also verified whether the Gate Level Conversion has been correctly performed by doing simulation. The next step in the ASIC flow is the Physical Implementation of the Gate Level Netlist. The Gate level Netlist is converted into geometric representation. The geometric
San Francisco State University
Nano-Electronics & Computing Research Lab
10
representation is nothing but the layout of the design. The layout is designed according to the design rules specified in the library. The design rules are nothing but guidelines based on the limitations of the fabrication process. The Physical Implementation step consists of three sub steps; Floor planning->Placement->Routing. The file produced at the output of the Physical Implementation is the GDSII file. It is the file used by the foundry to fabricate the ASIC. This step is performed by tools such as Blast Fusion (Magma), IC Compiler (Synopsys), and Encounter (Cadence) Etc…Physical Verification is performed to verify whether the layout is designed according the rules.
Figure 2.a : Simple ASIC Design Flow
Idea
Specifications
RTL
Gate Level Netlist
Physical Implementation
GDSII
CHIP
San Francisco State University
Nano-Electronics & Computing Research Lab
11
For any design to work at a specific speed, timing analysis has to be performed. We need to check whether the design is meeting the speed requirement mentioned in the specification. This is done by Static Timing Analysis Tool, for example Primetime (Synopsys). It validates the timing performance of a design by checking the design for all possible timing violations for example; set up, hold timing. After Layout, Verification, Timing Analysis, the layout is ready for Fabrication. The layout data is converted into photo lithographic masks. After fabrication, the wafer is diced into individual chips. Each Chip is packaged and tested.
San Francisco State University
Nano-Electronics & Computing Research Lab
12
Synopsys Verilog Compiler Simulator (VCS) Tutorial 3.0 Introduction Synopsys Verilog Compiler Simulator is a tool from Synopsys specifically designed to simulate and debug designs. This tutorial basically describes how to use VCS, simulate a verilog description of a design and learn to debug the design. VCS also uses VirSim, which is a graphical user interface to VCS used for debugging and viewing the waveforms. There are three main steps in debugging the design, which are as follows 1. Compiling the Verilog/VHDL source code. 2. Running the Simulation. 3. Viewing and debugging the generated waveforms. You can interactively do the above steps using the VCS tool. VCS first compiles the verilog source code into object files, which are nothing but C source files. VCS can compile the source code into the object files without generating assembly language files. VCS then invokes a C compiler to create an executable file. We use this executable file to simulate the design. You can use the command line to execute the binary file which creates the waveform file, or you can use VirSim. Below is a brief overview of the VCS tool, shows you how to compile and simulate a counter. For basic concepts on verification and test bench, please refer to APPENDIX 3A at the end of this chapter. SETUP Before going to the tutorial Example, let’s first setup up the directory. You need to do the below 3 steps before you actually run the tool: 1. As soon as you log into your engr account, at the command prompt, please type “csh “as shown below. This changes the type of shell from bash to c-shell. All the commands work ONLY in c-shell. [hkommuru@hafez ]$csh 2. Please copy the whole directory from the below location (cp –rf source destination) [hkommuru@hafez ]$cd [hkommuru@hafez ]$ cp -rf /packages/synopsys/setup/asic_flow_setup ./ This creates directory structure as shown below. It will create a directory called “asic_flow_setup ”, under which it creates the following directories namely
San Francisco State University
Nano-Electronics & Computing Research Lab
13
asic_flow_setup src/ : for verilog code/source code vcs/ : for vcs simulation , synth_graycounter/ : for synthesis synth_fifo/ : for synthesis pnr/ : for Physical design extraction/: for extraction pt/: for primetime verification/: final signoff check The “asic_flow_setup” directory will contain all generated content including, VCS simulation, synthesized gate-level Verilog, and final layout. In this course we will always try to keep generated content from the tools separate from our source RTL. This keeps our project directories well organized, and helps prevent us from unintentionally modifying the source RTL. There are subdirectories in the project directory for each major step in the ASIC Flow tutorial. These subdirectories contain scripts and configuration files for running the tools required for that step in the tool flow. For this tutorial we will work exclusively in the vcs directory. 3. Please source “synopsys_setup.tcl” which sets all the environment variables necessary to run the VCS tool. Please source them at unix prompt as shown below [hkommuru@hafez ]$ source /packages/synopsys/setup/synopsys_setup.tcl Please Note : You have to do steps 1 and 3 above everytime you log in.
3.1 Tutorial Example In this tutorial, we would be using a simple counter example . Find the verilog code and testbench at the end of the tutorial. Source code file name : counter.v Test bench file name : counter_tb.v
Setup 3.1.1 Compiling and Simulating NOTE: AT PRESENT THERE SEEMS TO BE A BUG IN THE TOOL, SO COMPILE AND SIMULATION IN TWO DIFFERENT STEPS IS NOT WORKING. THIS WILL BE FIXED SHORTLY. PLEASE DO STEP 3 TO SEE THE OUTPUT OF YOUR CODE. STEP 3 COMMAND PERFORMS COMPILATION AND SIMULATION IN ONE STEP. San Francisco State University
Nano-Electronics & Computing Research Lab
14
1. In the “vcs” directory, compile the verilog source code by typing the following at the machine prompt. [hkommuru@hafez vcs]$ cd asic_flow_setup/vcs [hkommuru@hafez vcs]$ cp ../src/counter/* . [hkommuru@hafez vcs]$ vcs –f main_counter.f +v2k Please note that the –f option means the file specified (main_counter.f ) contains a list of command line options for vcs. In this case, the command line options are just a list of the verilog file names. Also note that the testbench is listed first. The below command also will have same effect . [hkommuru@hafez vcs]$ vcs –f counter_tb.v counter.v +v2k The +v2k option is used if you are using Verilog IEE 1364-2000 syntax; otherwise there is no need for the option. Please look at Figure 3.a for output of compile command.
Figure 3.a: vcs compile Chronologic VCS (TM) Version B-2008.12 -- Wed Jan 28 20:08:26 2009 Copyright (c) 1991-2008 by Synopsys Inc. ALL RIGHTS RESERVED This program is proprietary and confidential information of Synopsys Inc. and may be used and disclosed only as authorized in a license agreement controlling such use and disclosure.
Warning-[ACC_CLI_ON] ACC/CLI capabilities enabled ACC/CLI capabilities have been enabled for the entire design. For faster performance enable module specific capability in pli.tab file Parsing design file 'counter_tb.v' Parsing design file 'counter.v' Top Level Modules: timeunit counter_testbench TimeScale is 1 ns / 10 ps Starting vcs inline pass... 2 modules and 0 UDP read. recompiling module timeunit recompiling module counter_testbench Both modules done. gcc -pipe -m32 -O -I/packages/synopsys/vcs_mx/B-2008.12/include -c -o rmapats.o rmapats.c if [ -x ../simv ]; then chmod -x ../simv; fi g++ -o ../simv -melf_i386 -m32 5NrI_d.o 5NrIB_d.o IV5q_1_d.o blOS_1_d.o rmapats_mop.o rmapats.o SIM_l.o /packages/synopsys/vcs_mx/B-2008.12/linux/lib/libvirsim.a /packages/synopsys/vcs_mx/B2008.12/linux/lib/librterrorinf.so /packages/synopsys/vcs_mx/B-2008.12/linux/lib/libsnpsmalloc.so
San Francisco State University
Nano-Electronics & Computing Research Lab
15
/packages/synopsys/vcs_mx/B-2008.12/linux/lib/libvcsnew.so 2008.12/linux/lib/ctype-stubs_32.a -ldl -lz -lm -lc -ldl ../simv up to date
/packages/synopsys/vcs_mx/B-
VirSim B-2008.12-B Virtual Simulator Environment Copyright (C) 1993-2005 by Synopsys, Inc. Licensed Software. All Rights Reserved.
By default the output of compilation would be a executable binary file is named simv. You can specify a different name with the -o compile-time option. For example : vcs –f main_counter.f +v2k –o counter.simv VCS compiles the source code on a module by module basis. You can incrementally compile your design with VCS, since VCS compiles only the modules which have changed since the last compilation. 2. Now, execute the simv command line with no arguments. You should see the output from both vcs and simulation and should produce a waveform file called counter.dump in your working directory. [hkommuru@hafez vcs]$./counter.simv Please see Figure 3.b for output of simv command
Figure 3.b Simulation Result Chronologic VCS simulator copyright 1991-2008 Contains Synopsys proprietary information. Compiler version B-2008.12; Runtime version B-2008.12; Jan 28 19:59 2009 time= time= time= time= time= time= time= time= time= time= time= time= time= time= time= time= time= time=
0 ns, clk=0, reset=0, out=xxxx 10 ns, clk=1, reset=0, out=xxxx 11 ns, clk=1, reset=1, out=xxxx 20 ns, clk=0, reset=1, out=xxxx 30 ns, clk=1, reset=1, out=xxxx 31 ns, clk=1, reset=0, out=0000 40 ns, clk=0, reset=0, out=0000 50 ns, clk=1, reset=0, out=0000 51 ns, clk=1, reset=0, out=0001 60 ns, clk=0, reset=0, out=0001 70 ns, clk=1, reset=0, out=0001 71 ns, clk=1, reset=0, out=0010 80 ns, clk=0, reset=0, out=0010 90 ns, clk=1, reset=0, out=0010 91 ns, clk=1, reset=0, out=0011 100 ns, clk=0, reset=0, out=0011 110 ns, clk=1, reset=0, out=0011 111 ns, clk=1, reset=0, out=0100
San Francisco State University
Nano-Electronics & Computing Research Lab
16
time= 120 ns, clk=0, reset=0, out=0100 time= 130 ns, clk=1, reset=0, out=0100 time= 131 ns, clk=1, reset=0, out=0101 time= 140 ns, clk=0, reset=0, out=0101 time= 150 ns, clk=1, reset=0, out=0101 time= 151 ns, clk=1, reset=0, out=0110 time= 160 ns, clk=0, reset=0, out=0110 time= 170 ns, clk=1, reset=0, out=0110 All tests completed sucessfully
$finish called from file "counter_tb.v", line 75. $finish at simulation time 171.0 ns VCS Simulation Report Time: 171000 ps CPU Time: 0.020 seconds; Data structure size: 0.0Mb Wed Jan 28 19:59:54 2009
If you look at the last page of the tutorial, you can see the testbench code, to understand the above result better. 3. You can do STEP 1 and STEP 2 in one single step below. It will compile and simulate in one single step. Please take a look at the command below: [hkommuru@hafez vcs]$ vcs -V -R -f main_counter.f -o simv In the above command, -V : stands for Verbose -R : command which tells the tool to do simulation immediately/automatically after compilation -o : output file name , can be anything simv, counter.simv etc... -f : specifying file To compile and simulate your design, please write your verilog code, and copy it to the vcs directory. After copying your verilog code to the vcs directory, follow the tutorial steps to simulate and compile.
3.2 DVE TUTORIAL DVE provides you a graphical user interface to debug your design. Using DVE you can debug the design in interactive mode or in postprocessing mode. In the interactive mode, apart from running the simulation, DVE allows you to do the following: • View waveforms • Trace Drivers and loads • Schematic, and Path Schematic view • Compare waveforms • Execute UCLI/Tcl commands • Set line, time, or event break points • Line stepping
San Francisco State University
Nano-Electronics & Computing Research Lab
17
However, in post-processing mode, a VPD/VCD/EVCD file is created during simulation, and you use DVE to: • View waveforms • Trace Drivers and loads • Schematic, and Path Schematic view • Compare waveforms Use the below command line to invoke the simulation in interactive mode using DVE: [hkommuru@hafez vcs]$simv –gui A TopLevel window is a frame that displays panes and views. • A pane can be displayed one time on each TopLevel Window. serves a specific debug purpose. Examples of panes are Hierarchy, Data, and the Console panes. • A view can have multiple instances per TopLevel window. Examples of views are Source, Wave, List, Memory, and Schematic. Panes can be docked on any side to a TopLevel window or left floating in the area in the frame not occupied by docked panes (called the workspace). You can use the above command or you can do everything, which is compile and simulation, open the gui in one step. 1. Invoke dve to view the waveform. At the unix prompt, type : [hkommuru@hafez vcs]$ vcs -V -R -f main_counter.f -o simv -gui –debug_pp Where debug_pp option is used to run the dve in simulation mode. Debug_pp creates a vpd file which is necessary to do simulation. The below window will open up.
San Francisco State University
Nano-Electronics & Computing Research Lab
18
2. In the above window, open up the counter module to view the whole module like below. Click on dut highlighted in blue and drag it to the data pane as shown below. All the signals in the design will show up in the data pane.
San Francisco State University
Nano-Electronics & Computing Research Lab
19
3. In this window, click on “Setup” under the “Simulator” option. A new small window will open up as shown. Inter.vpd is the file, the simulator will use to run the waveform.
San Francisco State University
Nano-Electronics & Computing Research Lab
20
The –debug_pp option in step1 creates this file. Click ok and now the step up is complete to run the simulation shown in the previous page. 4. Now in the data pane select all the signals with the left mouse button holding the shift button so that you select as many signals you want. Click on the right mouse button to open a new window, and click on “Add to group => New group . A new window will open up showing a new group of selected signals below.
You can create any number of signal groups you want so that you can organize the way and you want to see the output of the signals .
San Francisco State University
Nano-Electronics & Computing Research Lab
21
5. 4. Now in the data pane select all the signals with the left mouse button holding the shift button so that you select as many signals you want. Click on the right mouse button to open a new window, and click on “Add to waves New wave view”. A new waveform window will open with simulator at 0ns .
San Francisco State University
Nano-Electronics & Computing Research Lab
22
6. In the waveform window, go to “Simulator menu option” and click on “Start”. The tool now does simulation and you can verify the functionality of the design as shown below.
In the waveform window, the menu option View Set Time Scale can be used to change the display unit and the display precision 7. You can save your current session and reload the same session next time or start a new session again. In the menu option , File Save Session, the below window opens as shown below.
San Francisco State University
Nano-Electronics & Computing Research Lab
23
8. For additional debugging steps, you can go to menu option 1. Scope Show Source code: You can view your source code here and analyze. 2. Scope Show Schematic: You can view a schematic view of the design .
San Francisco State University
Nano-Electronics & Computing Research Lab
24
9. Adding Breakpoints in Simulation. To be able to add breakpoints, you have to use a additional compile option –debug_all –flag when you compile the code as shown below. [hkommuru@hafez vcs]$ vcs -V -R -f main_counter.f -o simv -gui –debug_pp debug_all –flag
-
Go to the menu option, Simulation Breakpoints , will open up a new window as shown below. You need to do this before Step 6, i.e. before actually running the simulation.
You can browse which file and also the line number and click on “Create” button to create breakpoints. Now when you simulate, click on Simulate Start, it will stop at your defined breakpoint, click on Next to continue. You can save your session again and exit after are done with debugging or in the middle of debugging your design.
Verilog Code File : Counter.v module counter ( out, clk, reset ) ;
San Francisco State University
Nano-Electronics & Computing Research Lab
25
input clk, reset; output [3:0] out; reg [3:0]
out;
wire [3:0]
next;
// This statement implements reset and increment assign next = reset ? 4'b0 : (out + 4'b1); // This implements the flip-flops always @ ( posedge clk ) begin out "); clk_50 = 1’b0; // at time 0 rst_l = 0; // reset is active #20 rst_l = 1’b1; // at time 20 release reset end
Initial blocks start executing sequentially at simulation time 0. Starting with the first line between the “begin end pair” each line executes from top to bottom until a delay is reached. When a delay is reached, the execution of this block waits until the delay time has passed and then picks up execution again. Each initial and always block executes concurrently. The initial block in the example starts by printing > to the screen, and initializes the reg types clk_50 and rst_l to 0 at time 0. The simulation time wheel then advances to time index 20, and the value on rst_l changes to a 1. This simple block of code initializes the clk_50 and rst_l reg types at the beginning of simulation and causes a reset pulse from low to high for 20 ns in a simulation. Some system tasks are called. These system tasks are ignored by the synthesis tool, so it is ok to use them. The system task variables begin with a ‘$’ sign. Some of the system level tasks are as follows: a. $Display: Displays text on the screen during simulation b. $Monitor: Displays the results on the screen whenever the parameter changes. c. $Strobe: Same as $display, but prints the text only at the end of the time step. d. $Stop: Halts the simulation at a certain point in the code. The user can add the next set of instructions to the simulator. After $Stop, you get back to the CLI prompt. e. $Finish: Exits the simulator f. $Dumpvar, $Dumpfile: This dumps all the variables in a design to a file. You can dump the values at different points in the simulation.
San Francisco State University
Nano-Electronics & Computing Research Lab
31
Tasks are a used to group a set of repetitive or related commands that would normally be contained in an initial or always block. A task can have inputs, outputs, and inouts, and can contain timing or delay elements. An example of a task is below task load_count; input [3:0] load_value; begin @(negedge clk_50); $display($time, " >", load_value); load_l = 1’b0; count_in = load_value; @(negedge clk_50); load_l = 1’b1; end endtask //of load_count
This task takes one 4-bit input vector, and at the negative edge of the next clk_50, it starts executing. It first prints to the screen, drives load_l low, and drives the count_in of the counter with the load_value passed to the task. At the negative edge of clk_50, the load_l signal is released. The task must be called from an initial or always block. If the simulation was extended and multiple loads were done to the counter, this task could be called multiple times with different load values. The compiler directive `timescale: ‘timescale 1 ns / 100 ps
This line is important in a Verilog simulation, because it sets up the time scale and operating precision for a module. It causes the unit delays to be in nanoseconds (ns) and the precision at which the simulator will round the events down to at 100 ps. This causes a #5 or #1 in a Verilog assignment to be a 5 ns or 1 ns delay respectively. The rounding of the events will be to .1ns or 100 pico seconds. Verilog Test benches use a standard, which contains a description of the C language procedural interface, better known as programming language interface (PLI). We can treat PLI as a standardized simulator (Application Program Interface) API for routines written in C or C++. Most recent extensions to PLI are known as Verilog procedural interface (VPI); Before writing the test bench, it is important to understand the design specifications of the design, and create a list of all possible test cases. You can view all the signals and check to see if the signal values are correct, in the waveform viewer. When designing the test bench, you can break-points at certain times, or can do simulation in a single step way, one can also have Time related breakpoints (Example: execute the simulation for 10ns and then stop) To test the design further, it is good to have randomized simulation. Random Simulation is nothing but supplying random combinations of valid inputs to the simulation tool and run it for a long time. When this random simulation runs for a long time, it could cover all corner cases and we can hope that it will emulate real system behavior. You can create random simulation in the test bench by using the $random variable. San Francisco State University
Nano-Electronics & Computing Research Lab
32
Coverage Metric: A way of seeing, how many possibilities exist and how many of them are executed in the simulation test bench. It is always good to have maximum coverage. a. Line Coverage: It is the percentage of lines in the code, covered by the simulation tool. b. Condition Coverage: It checks for all kinds of conditions in the code and also verifies to see if all the possibilities in the condition have been covered or not. c. State Machine Coverage: It is the percentage of coverage, that checks to see if every sequence of the state transitions that are covered. d. Regression Test Suite: This type of regression testing is done, when a new portion is added to the already verified code. The code is again tested to see if the new functionality is working and also verifies that the old code functionality has not been changed, due to the addition of the new code. Goals of Simulation are: 1. Functional Correctness: To verify the functionality of the design by verifies main test cases, corner cases (Special conditions) etc… 2. Error Handling 3. Performance Basic Steps in Simulation: 1. Compilation: During compilation, the verilog is converted to object code. It is done on a module basis. 2. Linking: This is step where module interconnectivity takes place. The object files are linked together and any kind of port mismatches (if any) occur. 3. Execution: An executable file is created and executed.
3.B.1 Test Bench Example: The following is an example of a simple read, write, state machine design and a test bench to test the state machine. State Machine:
module state_machine(sm_in,sm_clock,reset,sm_out); parameter idle = 2'b00; parameter read = 2'b01; parameter write = 2'b11; parameter wait = 2'b10;
San Francisco State University
Nano-Electronics & Computing Research Lab
33
input sm_clock; input reset; input sm_in; output sm_out; reg [1:0] current_state, next_state;
always @ (posedge sm_clock) begin if (reset == 1'b1) current_state set link_library [ list /packages/process_kit/generic/generic_90nm/updated_Oct2008/SAED_EDK90nm/Digita l_Standard_Cell_Library/synopsys/models/saed90nm_max.db /packages/process_kit/generic/generic_90nm/updated_Oct2008/SAED_EDK90nm/Digita l_Standard_Cell_Library/synopsys/models/saed90nm_min.db /packages/process_kit/generic/generic_90nm/updated_Oct2008/SAED_EDK90nm/Digita l_Standard_Cell_Library/synopsys/models/saed90nm_typ.db ] dc_shell-xg-t > set target_library [ list /packages/process_kit/generic/generic_90nm/updated_Oct2008/SAED_EDK90nm/Digita l_Standard_Cell_Library/synopsys/models/saed90nm_max.db] The command “lappend search path” tells the tool to search for the verilog code in that particular directory ] to the verilog source code directory. The next command “define_design_lib”, creates a Synopsys work directory, and the la last two commands “ set link_library “ and “ set target_library “ point to the standard technology libraries we will be using. The DB files contain wireload models [Wire load modeling allows the tool to estimate the effect of wire length and fanout on the resistance, capacitance, and area of nets, calculate wire delays and circuit speeds], area and timing
information for each standard cell. DC uses this information to optimize the synthesis process. For more detail information on optimization, please refer to the DC manual. 7. The next step is to load your Verilog/VHDL design into Design Compiler. The commands to load verilog are “analyze” and “elaborate”. Executing these commands results in a great deal of log output as the tool elaborates some Verilog constructs and starts to infer some high-level components. Try executing the commands as follows. dc_shell_xg-t > analyze –library WORK –format verilog gray_counter.v dc_shell_xg-t> elaborate –architecture verilog –library WORK graycount Notice, that the graycount is the name of the top module to be synthesized and not the name of the verilog file (gray_counter.v). You can see part of the analyze command in Figure 7.a below
San Francisco State University
Nano-Electronics & Computing Research Lab
49
Figure 4.a : Fragment of analyze command
You can see Figure 7.b, which shows you a part of the elaboration, for the above gray code; the tool has inferred flipflop with 2 bit width. Please make sure that you check your design at this stage in the log to check if any latches inferred. We typically do not want latches inferred in the design. Before DC optimizes the design, it uses Presto Verilog Compiler [for verilog code], to read in the designs; it also checks the code for the correct syntax and builds a generic technology (GTECH) netlist. DC uses this GTECH netlist to optimize the design. You could also use “read_verilog” command, which basically combines both elaborate and analyze command into one. You can use “read_verilog” as long as your design is not parameterized, meaning look at the below example of a register. module dflipflop( inp, clk, outp ); parameter SIZE = 8; input [SIZE-1:0] inp; input clk; output [SIZE-1:0] outp; reg [SIZE-1:0] outp; reg [SIZE-1:0] tmp; always @(clk) if (clk == 0) tmp = inp; else //(clk == 1) out1 check_design Please go through, the check_design errors and warnings. DC cannot compile the design if there are any errors. Many of the warning’s may not an issue, but it is still useful to skim through this output. 9. After the design compile is clean, we need to tell the tool the constraints, before it actually synthesizes. The tool needs to know the target frequency you want to synthesize. Take a look at the “create_clock” command below. dc_shell-xg-t> create_clock clk -name ideal_clock1 -period 5
San Francisco State University
Nano-Electronics & Computing Research Lab
51
The above command tells the tool that the pin named clk is the clock and that your desired clock period is 5 nanoseconds. We need to set the clock period constraint carefully. If the period is unrealistically small, then the tools will spend forever trying to meet timing and ultimately fail. If the period is too large, then the tools will have no trouble but you will get a very conservative implementation. You could also add additional constraints such as constrain the arrival of certain input signals, the drive strength of the input signals, capacitive load on the output signals etc. Below are some examples. These constraints are defined by you, the user; hence we can call them user specified constraints. Set input constraints by defining how much time would be spent by signals arriving into your design, outside your design with respect to clock. dc_shell-xg-t> set_input_delay 2.0 [remove_from_collection [all_inputs] clk ] –clock ideal_clock1 Similarly you can define output constraints, which define how much time would be spent by signals leaving the design, outside the design, before being captured by the same clk. dc_shell-xg-t> set_output_delay 2.0 [all_outputs] –clock ideal_clock1 Set area constraints: set maximum allowed area to 0 , well it’s just to instruct design compiler to use as less area as possible. dc_shell-xg-t > set_max_area 0 Please refer to tutorial on “Basics of Static Timing Analysis” for more understanding of concepts of STA and for more information on the commands used in STA, please refer to the Primetime Manual and DC Compiler Manual at location /packages/synopsys/ 10. Now we are ready to use the compile command to actually synthesize our design into a gate-level netlist. Two of the most important options for the compile command are the map effort and the area effort. Both of these can be set to one of none, low, medium, or high. They specify how much time to spend on technology mapping and area reduction. dc_shell-xg-t> compile -map_effort medium -area_effort medium DC will attempt to synthesize your design while still meeting the constraints. DC considers two types of constraints: user specified constraints and design rule constraints. We looked at the user specified constraints in the previous step. Design rule constraints are fixed constraints which are specified by the standard cell library. For example, there are restrictions on the loads specific gates can drive and on the transition times of certain pins. To get a better understanding of the standard cell library, please refer to Generic 90nm library documents in the below location which we are using in the tutorial.
San Francisco State University
Nano-Electronics & Computing Research Lab
52
/packages/process_kit/generic/generic_90nm/updated_Oct2008/SAED_EDK90nm/Digi tal_Standard_Cell_Library/doc/databook/ Also, note that the compile command does not optimize across module boundaries. You have to use “set flatten” command to enable inter-module optimization. For more information on the compile command consult the Design Compiler User Guide (dc-userguide.pdf) or use man compile at the DC shell prompt. The compile command will report how the design is being optimized. You should see DC performing technology mapping, delay optimization, and area reduction. Figure 7.c shows a fragment from the compile output. Each line is an optimization pass. The area column is in units specific to the standard cell library, but for now you should just use the area numbers as a relative metric. The worst negative slack column shows how much room there is between the critical path in your design and the clock constraint. Larger negative slack values are worse since this means that your design is missing the desired clock frequency by a greater amount. Total negative slack is the sum of all negative slack across all endpoints in the design - if this is a large negative number it indicates that not only is the design not making timing, but it is possible that many paths are too slow. If the total negative slack is a small negative number, then this indicates that only a few paths are too slow. The design rule cost is an indication of how many cells violate one of the standard cell library design rules constraints. You can use the compile command more than once, as many iterations as you want, for example, first iteration you can optimize only timing, but it might come with high area cost, for second iteration, it optimizes area, but could cause the design to no longer meet timing. There is no limit on number of iterations; however each design is different, and you need to do number of runs, to decide how many iterations it needs. We can now use various commands to examine timing paths, display reports, and further optimize the design. Using the shell directly is useful for finding out more information about a specific command or playing with various options.
Figure 4.c: Fragment of Compile command
San Francisco State University
Nano-Electronics & Computing Research Lab
53
4.2.2 Interpreting the Synthesized Gate-Level Netlist and Text Reports In addition to the actual synthesized gate-level netlist, the dc_synth.tcl also generates several text reports. Reports usually have the rpt filename suffix. The following is a list of the synthesis reports. The synth area.rpt report contains area information for each module in the design. 7.d shows a fragment from synth_area.rpt. We can use the synth_area.rpt report to gain insight into how various modules are being implemented. We can also use the area report to measure the relative area of the various modules. You can find all these reports in the below location for your reference. /packages/synopsys/setup/project_dc/synth/reports/ You can also look at command.log , in the synth directory, which will list all the commands used in the current session. synth_area.rpt - Contains area information for each module instance
San Francisco State University
Nano-Electronics & Computing Research Lab
54
Figure 4.d : Fragment of area report Library(s) Used: saed90nm_typ (File: /packages/process_kit/generic/generic_90nm/updated_Oct2008/SAED_EDK90nm /Digital_Standard_Cell_Library/synopsys/models/saed90nm_typ.db) Number Number Number Number
of of of of
ports: nets: cells: references:
5 9 5 3
Combinational area: Noncombinational area: Net Interconnect area:
29.492001 64.512001 undefined
Total cell area: Total area: 1
94.003998 undefined
(No wire load specified)
The synth_cells.rpt - Contains the cells list in the design , as you can see in Figure 4.e . From this report , you can see the breakup of each cell area in the design.
Figure 4.e: Fragment of cell area report Attributes: b - black box (unknown) h - hierarchical n - noncombinational r - removable u - contains unmapped logic Cell Reference Library Area Attributes ----------------------------------------------------------------------U2 AO22X1 saed90nm_typ 11.981000 U3 AO22X1 saed90nm_typ 11.981000 U4 INVX0 saed90nm_typ 5.530000 gcc_out_reg[0] DFFARX1 saed90nm_typ 32.256001 n gcc_out_reg[1] DFFARX1 saed90nm_typ 32.256001 n ------------------------------------------------------------------------------Total 5 cells 94.003998 1
Synth_qor.rpt – Contains summary information on the area , timing, critical paths violations in the design. You can take a look at this report to understand the overall quality of your design. Figure 4.f shows the example. As you can see in Figure 4.f , there is no negative slack in the design that means the design is meeting timing.
San Francisco State University
Nano-Electronics & Computing Research Lab
55
Figure 4.f : Fragment of qor report Timing Path Group 'ideal_clock1' ----------------------------------Levels of Logic: 2.00 Critical Path Length: 0.12 Critical Path Slack: 2.77 Critical Path Clk Period: 5.00 Total Negative Slack: 0.00 No. of Violating Paths: 0.00 ----------------------------------Cell Count ----------------------------------Hierarchial Cell Count: 0 Hierarchial Port Count: 0 Leaf Cell Count: 5 ----------------------------------Area ----------------------------------Combinational Area: 29.492001 Noncombinational Area: 64.512001 Net Area: 0.000000 ----------------------------------Cell Area: 94.003998 Design Area: 94.003998 Design Rules ----------------------------------Total Number of Nets: 9 Nets With Violations: 0 ----------------------------------Hostname: hafez.sfsu.edu Compile CPU Statistics ----------------------------------Resource Sharing: 0.00 Logic Optimization: 0.31 Mapping Optimization: 0.33 ----------------------------------Overall Compile Time: 3.64 1
synth_timing.rpt - Contains critical timing paths You can see below an example of a timing report dumped out from synthesis . You can see at the last line of the Figure 7.f , this paths meets timing. The report lists the critical path of the design. The critical path is the slowest logic path between any two registers
San Francisco State University
Nano-Electronics & Computing Research Lab
56
and is therefore the limiting factor preventing you from decreasing the clock period constraint (and thus increasing performance). The report is generated from a purely static worstcase timing analysis (i.e. independent of the actual signals which are active when the processor is running). In the example below, since it’s a simple gray counter, the crtical path is from the port to the register. Please note that the last column lists the cumulative delay to that node, while the middle column shows the incremental delay. You can see that the datapath is and Inverter, complex gate before it reaches the register which is 0.12ns. From our SDC constraints, we set 2ns delay on the input port. So, the total delay so far is 2.12ns. Notice, however, that the final register file flip-flop has a setup time of 0.11 ns, the clock period is 5ns. Therefore 5ns-0.11ns=4.89ns, is the time before which the register should latch the data. The critical path delay is however only 2.12ns, so there is more than enough time for the path to meet timing.
Figure 4.g: Fragment of Timing report Operating Conditions: TYPICAL Wire Load Model Mode: top
Library: saed90nm_typ
Startpoint: en_count (input port) Endpoint: gcc_out_reg[1] (rising edge-triggered flip-flop clocked by ideal_clock1) Path Group: ideal_clock1 Path Type: max Point Incr Path ----------------------------------------------------------clock (input port clock) (rise edge) 0.00 0.00 input external delay 2.00 2.00 f en_count (in) 0.00 2.00 f U4/QN (INVX0) 0.02 2.02 r U2/Q (AO22X1) 0.10 2.12 r gcc_out_reg[1]/D (DFFARX1) 0.00 2.12 r data arrival time 2.12 clock ideal_clock1 (rise edge) 5.00 5.00 clock network delay (ideal) 0.00 5.00 gcc_out_reg[1]/CLK (DFFARX1) 0.00 5.00 r library setup time -0.11 4.89 data required time 4.89 ----------------------------------------------------------data required time 4.89 data arrival time -2.12 ----------------------------------------------------------slack (MET) 2.77
synth_resources.rpt - Contains information on Design Ware components => In the above example, the file will be empty since the graycounter did not need any of the complex cells.
San Francisco State University
Nano-Electronics & Computing Research Lab
57
**************************************** Report : resources Design : graycount Version: X-2005.09-SP3 Date : Mon Mar 9 21:30:37 2009 **************************************** No resource sharing information to report. No implementations to report No multiplexors to report
synth_check_design.rpt - Contains output from check design command, which is clean in the above example.
Below is the gate-level netlist output of the gray counter RTL code after synthesis.
Figure 4.h : Synthesized gate-level netlist module graycount ( gcc_out, reset_n, clk, en_count ); output [1:0] gcc_out; input reset_n, clk, en_count; wire N8, n1, n4, n5, n6; assign gcc_out[0] = N8; AO22X1 U2 ( .IN1(gcc_out[1]), .IN2(n1), .IN3(en_count), .IN4(N8), .Q(n4) ); AO22X1 U3 ( .IN1(en_count), .IN2(n6), .IN3(N8), .IN4(n1), .Q(n5) ); INVX0 U4 ( .IN(en_count), .QN(n1) ); DFFARX1 \gcc_out_reg[0] ( .D(n5), .CLK(clk), .RSTB(reset_n), .Q(N8) ); DFFARX1 \gcc_out_reg[1] ( .D(n4), .CLK(clk), .RSTB(reset_n), .Q(gcc_out[1]), .QN(n6) ); endmodule
4.2.3 Synthesis Script ###### Synthesis Script ####### ## Give the path to the verilog files and define the WORK directory lappend search_path ../src/gray_counter define_design_lib WORK -path "work"
San Francisco State University
Nano-Electronics & Computing Research Lab
58
## Define the library location set link_library [ list /packages/process_kit/generic/generic_90nm/updated_Oct2008/SAED_EDK90nm /Digital_Standard_Cell_Library/synopsys/models/saed90nm_max.db packages/process_kit/generic/generic_90nm/updated_Oct2008/SAED_EDK90nm/ Digital_Standard_Cell_Library/synopsys/models/saed90nm_typ.db packages/process_kit/generic/generic_90nm/updated_Oct2008/SAED_EDK90nm/ Digital_Standard_Cell_Library/synopsys/models/saed90nm_min.db] set target_library [ list /packages/process_kit/generic/generic_90nm/updated_Oct2008/SAED_EDK90nm /Digital_Standard_Cell_Library/synopsys/models/saed90nm_max.db ] ## read the verilog files analyze -library WORK -format verilog gray_counter.v elaborate
-architecture verilog -library WORK graycount
## Check if design is consistent check_design > reports/synth_check_design.rpt ## Create Constraints create_clock clk -name ideal_clock1 -period 5 set_input_delay 2.0 [remove_from_collection [all_inputs] clk ] –clock ideal_clock1 set_output_delay 2.0 [all_outputs] –clock ideal_clock1 set_max_area 0 ## Compilation ## you can change medium to either low or high compile -area_effort medium -map_effort medium ## Below commands report area , cell, information needed to analyze the design.
qor,
resources,
and
timing
report_area > reports/synth_area.rpt report_cell > reports/synth_cells.rpt report_qor > reports/synth_qor.rpt report_resources > reports/synth_resources.rpt report_timing -max_paths 10 > reports/synth_timing.rpt ## Dump out the constraints in an SDC file write_sdc
const/gray_counter.sdc
## Dump out the synthesized database and gate leedl nedtlist write -f ddc -hierarchy -output output/gray_counter.ddc write -hierarchy -format verilog –output output/gray_counter.v ## You can play with the commands or exit exit
San Francisco State University
Nano-Electronics & Computing Research Lab
59
Note : There is another synthesis example of a FIFO in the below location for further reference. This synthesized FIFO example is used in the physical design IC Compiler Tutorial Location : /packages/synopsys/setup/asic_flow_setup/synth_fifo
APPENDIX 4A: SYNTHESIS OPTIMIZATION TECHNIQUES 4. A.0 Introduction A fully optimized design is one, which has met the timing requirements and occupies the smallest area. The optimization can be done in two stages one at the code level, the other during synthesis. The optimization at the code level involves modifications to RTL code that is already been simulated and tested for its functionality. This level of modifications to the RTL code is generally avoided as sometimes it leads to inconsistencies between simulation results before and after modifications. However, there are certain standard model optimization techniques that might lead to a better synthesized design.
4. A.1 Model Optimization Model optimizations are important to a certain level, as the logic that is generated by the synthesis tool is sensitive to the RTL code that is provided as input. Different RTL codes generate different logic. Minor changes in the model might result in an increase or decrease in the number of synthesized gates and also change its timing characteristics. A logic optimizer reaches different endpoints for best area and best speed depending on the starting point provided by a netlist synthesized from the RTL code. The different starting points are obtained by rewriting the same HDL model using different constructs. Some of the optimizations, which can be used to modify the model for obtaining a better quality design, are listed below.
4.A.1.1 Resource Allocation This method refers to the process of sharing a hardware resource under mutually exclusive conditions. Consider the following if statement. if A = ‘1’ then E = B + C; else E = B + D; end if;
San Francisco State University
Nano-Electronics & Computing Research Lab
60
The above code would generate two ALUs one for the addition of B+C and other for the addition B + D which are executed under mutually exclusive conditions. Therefore a single ALU can be shared for both the additions. The hardware synthesized for the above code is given below in Figure 4A.a.
Figure 4A.a Without resource allocation. The above code is rewritten with only on addition operator being employed. The hardware synthesized is given in Figure 4A.b. if A = ‘1’ then temp := C; // A temporary variable introduced. else temp := D; end if; E = B + temp;
Figure 4A.b. With resource allocation. It is clear from the figure that one ALU has been removed with one ALU being shared for both the addition operations. However a multiplexer is induced at the inputs of the ALU that contributes to the path delay. Earlier the timing path of the select signal goes through the multiplexer alone, but after resource sharing it goes through the multiplexer
San Francisco State University
Nano-Electronics & Computing Research Lab
61
and the ALU datapath, increasing its path delay. However due to resource sharing the area of the design has decreased. This is therefore a trade-off that the designer may have to make. If the design is timing-critical it would be better if no resource sharing is performed. Common sub-expressions and Common factoring It is often useful to identify common subexpressions and to reuse the computed values wherever possible. A simple example is given below. B := R1 + R2; ….. C set_clock_transition 0.2 [get_clocks CLK] pt_shell> set_clock_uncertainty 1.2 –setup [get_clocks CLK] pt_shell> set_clock_uncertainty 0.5 –hold [get_clocks CLK] The above commands specify the port CLK as type clock having a period of 20ns, the clock latency as 2.5ns, and a fixed clock transition value of 0.2ns. The clock latency value of 2.5ns signifies that the clock delay from the input port CLK to all the endpoints is fixed at 2.5ns. In addition, the 0.2ns value of the clock transition forces PT to use the 0.2ns value, instead of calculating its own. The clock skew is approximated with 1.2ns specified for the setup-time, and 0.5ns for the hold-time. Using this approach during prelayout yields a realistic approximation to the post-layout clock network results.
6.6.3 STEPS FOR PRE-LAYOUT TIMING VALIDATION 0. The design example for the rest of this tutorial is a FIFO whose verilog code is available in asic_flow_setup/src/fifo/fifo.v . Please first run the DC synthesis on this file: [hkommuru@hafez ]$ source /packages/synopsys/setup/synopsys_setup.tcl [
[email protected]] $ cd [
[email protected]] $cd asic_flow_setup/synth_fifo [
[email protected]] $cd scripts [
[email protected]] $emacs dc_synth.tcl & [
[email protected]] $cd .. [
[email protected]] $ dc_shell-xg-t and run the scripts in /asic_flow_setup/synth_fifo/scripts/dc_synth.tcl 1. Please source “synopsys_setup.tcl” which sets all the environment variables necessary to run the Primetime . Please type csh at the unix prompt before you source the below script.
San Francisco State University
Nano-Electronics & Computing Research Lab
87
Please source the above file from the below location. [
[email protected]] $ csh [
[email protected]] $ cd [
[email protected]] $ cd /asic_flow_setup/pt [
[email protected]] $ source /packages/synopsys/setup/synopsys_setup.tcl 2. PT may be invoked in the command-line mode using the command pt_shell or in the GUI mode through the command primetime as shown below. Command-line mode: > pt_shell GUI-mode: > primetime
Before doing the next step , open the pre_layout_pt.tcl script and keep it ready which is at location / [
[email protected]]$ vi scripts/pre_layout_pt.tcl 3. Just like DC setup, you need to set the path to link_library and search_path
San Francisco State University
Nano-Electronics & Computing Research Lab
88
pt_shell > set link_library [ list /packages/process_kit/generic/generic_90nm/updated_Oct2008/SAED_EDK90nm/Digita l_Standard_Cell_Library/synopsys/models/saed90nm_typ.db /packages/process_kit/generic/generic_90nm/updated_Oct2008/SAED_EDK90nm/Digita l_Standard_Cell_Library/synopsys/models/saed90nm_max .db/packages/process_kit/gen eric/generic_90nm/updated_Oct2008/SAED_EDK90nm/Digital_Standard_Cell_Library/ synopsys/models/saed90nm_min.db ] pt_shell > set target_library [ list /packages/process_kit/generic/generic_90nm/updated_Oct2008/SAED_EDK90nm/Digita l_Standard_Cell_Library/synopsys/models/saed90nm_max.db] 4. Read the synthesized netlist pt_shell> read_verilog ../synth_fifo/output/fifo.v 5. You need to set the top module name . pt_shell > current_design FIFO 6. Read in the SDC from the synthesis pt_shell> source ../synth_fifo/const/fifo.sdc 7. Now we can do the analysis of the design, as discussed in the beginning of this chapter, general, four types of analysis is performed on the design, as follows: From primary inputs to all flops in the design. From flop to flop. From flop to primary output of the design. From primary inputs to primary outputs of the design. All four types of analysis can be accomplished by using the following commands: pt_shell> report_timing -from [all_inputs] -max_paths 20 -to [all_registers -data_pins] > reports/timing.rpt pt_shell> report_timing -from [all_register -clock_pins] -max_paths 20 -to [all_registers -data_pins] >> reports/timing.rpt pt_shell> report_timing -from [all_registers -clock_pins] -max_paths 20 -to [all_outputs] >> reports/timing.rpt pt_shell> report_timing -from [all_inputs] -to [all_outputs] -max_paths 20 >> reports/timing.rpt
San Francisco State University
Nano-Electronics & Computing Research Lab
89
Please note that the above command write their reports to the file timing.rpt under the reports subdirectory. Please open this file to read the reports and check for any errors. Please notice that -max_paths 20 option above, gives the worst 20 paths in the design. 8. Reporting setup time and hold time. Primetime by default reports the setup time. You can report the setup or hold time by specifying the –delay_type option as shown in below figure. pt_shell> report_timing -from [all_registers -clock_pins] -to [all_registers -data_pins] delay_type max >> reports/timing.rpt If you open and read the timing.rpt file, you will notice that the design meets the setup time.
9. Reporting hold time pt_shell> report_timing -from [all_registers -clock_pins] -to [all_registers -data_pins] delay_type min >> reports/timing.rpt
San Francisco State University
Nano-Electronics & Computing Research Lab
90
If you open and read the timing.rpt file, you will notice that the design meets the setup time.
10. Reporting timing with capacitance and transition time at each level in the path pt_shell > report_timing -transition_time -capacitance -nets -input_pins -from [all_registers -clock_pins] -to [all_registers -data_pins] > reports/timing.tran.cap.rpt 11. You can save your session and come back later if you chose to. pt_shell > save_session output/fifo.session Note: If the timing is not met, you need to go back to synthesis and redo to make sure the timing is clean before you proceed to the next step of the flow that is Physical Implementation.
San Francisco State University
Nano-Electronics & Computing Research Lab
91
IC COMPILER TUTORIAL 8.0 Basics of Physical Implementation 8.1 Introduction As you have seen in the beginning of the ASIC tutorial, after getting an optimized gatelevel netlist, the next step is Physical implementation. Before we actually go into details of ICCompiler, which is the physical implementation tool from Synopsys, this chapter covers the necessary basic concepts needed to do physical implementation. Also, below you can see a more detailed flowchart of ASIC flow.
Figure 8.1.a : ASIC FLOW DIAGRAM
San Francisco State University
Nano-Electronics & Computing Research Lab
92
The Physical Implementation step in the ASIC flow consists of: 1. Floorplanning 2. Placement 3. Routing This document will cover each one of the topics mentioned above one by one.
8.2 Floorplanning At the floorplanning stage, we have a netlist which describes the design and the various blocks of the design and the interconnection between the different blocks. The netlist is the logical description of the ASIC and the floorplan is the physical description of the ASIC. Therefore, by doing floorplanning, we are mapping the logical description of the design to the physical description. The main objectives of floorplanning are to minimize a. Area
San Francisco State University
Nano-Electronics & Computing Research Lab
93
b. Timing (delay) During floorplanning, the following are done: The size of the chip is estimated. The various blocks in the design, are arranged on the chip. Pin Assignment is done. The I/O and Power Planning are done. The type of clock distribution is decided
Figure 8.2.a : Floorplan example I/O pins
Row utilization
t Row Spacing
y
x
Floorplanning is a major step in the Physical Implementation process. The final timing, quality of the chip depends on the floorplan design. The three basic elements of chip are: 1. Standard Cells: The design is made up of standard cells. 2. I/O cells: These cells are used to help signals interact to and from the chip. 3. Macros (Memories): To store information using sequential elements takes up lot of area. A single flip flop could take up 15 to 20 transistors to store one bit. Therefore special memory elements are used which store the data efficiently and also do not occupy much space on the chip comparatively. These memory cells are called macros. Examples of memory cells include 6T SRAM (Static Dynamic Access Memory), DRAM (Dynamic Random Access Memory) etc. The above figure shows a basic floorplan. The following is the basic floorplanning steps (and terminology): 1. Aspect ratio (AR): It is defines as the ratio of the width and length of the chip. From the figure, we can say that aspect ratio is x/y. In essence, it is the shape of the rectangle used for placement of the cells, blocks. The aspect ratio should take into account the number of routing resources available. If there are more
San Francisco State University
Nano-Electronics & Computing Research Lab
94
2.
3.
4.
5.
6.
7.
horizontal layers, then the rectangle should be long and width should be small and vice versa if there are more vertical layers in the design. a. Normally, METAL1 is used up by the standard cells. Usually, odd numbered layers are horizontal layers and even numbered layers are vertical. So for a 5 layer design, AR = 2/2 = 1. b. Example2: For a 6 layer design, AR = 2/3 = 0.66 Concept of Rows: The standard cells in the design are placed in rows. All the rows have equal height and spacing between them. The width of the rows can vary. The standard cells in the rows get the power and ground connection from VDD and VSS rails which are placed on either side of the cell rows. Sometimes, the technology allows the rows to be flipped or abutted, so that they can share the power and ground rails. Core: Core is defined as the inner block, which contains the standard cells and macros. There is another outer block which covers the inner block. The I/O pins are placed on the outer block. Power Planning: Signals flow into and out off the chip, and for the chip to work, we need to supply power. A power ring is designed around the core. The power ring contains both the VDD and VSS rings. Once the ring is placed, a power mesh is designed such that the power reaches all the cells easily. The power mesh is nothing but horizontal and vertical lines on the chip. One needs to assign the metal layers through which you want the power to be routed. During power planning, the VDD and VSS rails also have to be defined. I/O Placement: There are two types of I/O‘s. a. Chip I/O: The chip contains I/O pins. The chip consists of the core, which contains all the standard cells, blocks. The chip I/O placement consists of the placement of I/O pins and also the I/O pads. The placement of these I/O pads depends on the type of packaging also. ( Refer document : Packaging) b. Block I/O: The core contains several blocks. Each block contains the Block I/O pins which communicate with other blocks, cells in the chip. This placement of pins can be optimized. Pin Placement: Pin Placement is an important step in floorplanning. You may not know where to place the pins initially, but later on when you get a better idea, the pin placement can be done based on timing, congestion and utilization of the chip. a. Pin Placement in Macros: It uses up m3 layers most of the time, so the macro needs to be placed logically. The logical way is to put the macros near the boundary. If there is no connectivity between the macro pins and the boundary, then move it to another location. Concept of Utilization: Utilization is defined as the percentage of the area that has been utilized in the chip. In the initial stages of the floorplan design, if the size of the chip is unknown, then the starting point of the floorplan design is utilization. There are three different kinds of utilizations. a. Chip Level utilization: It is the ratio of the area of standard cells, macros and the pad cells with respect to area of chip. Area (Standard Cells) + Area (Macros) + Area (Pad Cells) Area (chip)
San Francisco State University
Nano-Electronics & Computing Research Lab
95
b. Floorplan Utilization: It is defined as the ratio of the area of standard cells, macros, and the pad cells to the area of the chip minus the area of the sub floorplan. Area (Standard Cells) + Area (Macros) + Area (Pad Cells) Area (Chip) – Area (sub floorplan) c. Cell Row Utilization: It is defined as the ratio of the area of the standard cells to the area of the chip minus the area of the macros and area of blockages. Area (Standard Cells) Area (Chip) - Area (Macro) – Area (Region Blockages) 8. Macro Placement: As a part of floorplanning, initial placement of the macros in the core is performed. Depending on how the macros are placed, the tool places the standard cells in the core. If two macros are close together, it is advisable to put placement blockages in that area. This is done to prevent the tool from putting the standard cells in the small spaces between the macros, to avoid congestion. Few of the different kinds of placement blockages are: a. Standard Cell Blockage: The tool does not put any standard cells in the area specified by the standard cell blockage. b. Non Buffer Blockage: The tool can place only buffers in the area specified by the Non Buffer Blockage. c. Blockages below power lines: It is advisable to create blockages under power lines, so that they do not cause congestion problems later. After routing, if you see an area in the design with a lot of DRC violations, place small chunks of placement blockages to ease congestion. After Floorplanning is complete, check for DRC (Design Rule check) violations. Most of the pre-route violations are not removed by the tool. They have to be fixed manually. I/O Cells in the Floorplan: The I/O cells are nothing but the cells which interact in between the blocks outside of the chip and to the internal blocks of the chip. In a floorplan these I/O cells are placed in between the inner ring (core) and the outer ring (chip boundary). These I/O cells are responsible for providing voltage to the cells in the core. For example: the voltage inside the chip for 90nm technology is about 1.2 Volts. The regulator supplies the voltage to the chip (Normally around 5.5V, 3.3V etc). The next question which comes to mind is that why is the voltage higher than the voltage inside the chip? The regulator is basically placed on the board. It supplies voltage to different other chips on board. There is lot of resistances and capacitances present on the board. Due to this, the voltage needs to be higher. If the voltage outside is what actually the chip need inside, then the standard cells inside of the chip get less voltage than they actually need and the chip may not run at all. So now the next question is how the chips can communicate between different voltages? The answer lies in the I/O cells. These I/O cells are nothing but Level Shifters. Level Shifters are nothing but which convert the voltage from one level to another The Input I/O cells reduce the voltage coming form the outside to that of the voltage needed inside
San Francisco State University
Nano-Electronics & Computing Research Lab
96
the chip and output I/O cells increase the voltage which is needed outside of the chip. The I/O cells acts like a buffer as well as a level shifter.
8.3 Concept of Flattened Verilog Netlist Most of the time, the verilog netlist is in the hierarchical form. By hierarchical I mean that the design is modeled on basis of hierarchy. The design is broken down into different sub modules. The sub modules could be divided further. This makes it easier for the logic designer to design the system. It is good to have a hierarchical netlist only until Physical Implementation. During placement and routing, it is better to have a flattened netlist. Flattening of the netlist implies that the various sub blocks of the model have basically opened up and there are no more sub blocks. There is just one top block. After you flatten the netlist you cannot differentiate between the various sub block, but the logical hierarchy of the whole design is maintained. The reason to do this is: In a flat design flow, the placement and routing resources are always visible and available. Physical Design Engineers can perform routing optimization and can avoid congestion to achieve a good quality design optimization. If the conventional hierarchical flow is used, then it can lead to sub-optimal timing for critical paths traveling through the blocks and for critical nets routed around the blocks. The following gives and example of a netlist in the hierarchical mode as well as the flattened netlist mode:
8.3.a Hierarchical Model: module top (a , out1 ) input a; output out1; wire n1; SUB1 U1 (.in (a), .out (n1)) SUB1 U2 (.in (n1), .out (out1)) endmodule module SUB1 ( b , outb ) input b; output outb; wire n1, n2; INVX1 V1 (.in (b), .out (n1)) INVX1 V2 (.in (n1), .out (n2))
San Francisco State University
Nano-Electronics & Computing Research Lab
97
INVX1 V3 (.in (n2), .out (outb)) endmodule In verilog, the instance name of each module is unique. In the flattened netlist, the instance name would be the top level instance name/lower level instance name etc… Also the input and output ports of the sub modules also get lost. In the above example the input and output ports; a, out1, b and outb get lost. The above hierarchical model, when converted to the flattened netlist, will look like this:
8.3.b Flattened Model: module top ( in1, out1 ) input in1; output out1; wire topn1; INVX1 U1/V1 (.in (in1), .out (V1/n1) INVX1 U1/V2 (.in (V1/n1), .out (V2/n2 ) INVX1 U1/V3 (.in (V2/n2), .out (topn1 ) INVX1 U2/V1 (.in (n1), .out (V1/n1 ) INVX1 U2/V2 (.in (V1/n1), .out (V2/n2 ) INVX1 U2/V3 (.in (V2/n2), .out ( out1 ) endmodule
The following figure shows the summary of floorplanning:
Figure 8.c Floorplanning Flow Chart
San Francisco State University
Nano-Electronics & Computing Research Lab
98
Floorplanning Summary
Bind the Physical Library to netlist Create the Initial Core Create the I/O pin placement, pad ring Place the macros, standard cells Create Placement Blockages, readjust Macro Placement Specify Power and Ground nets Create Power and Macro rings Create power , ground rails, meshes Route Power and Ground nets Check floorplan visually and for any other violations
Is floorplan ok? No
Yes Placement
8.4 Placement Placement is a step in the Physical Implementation process where the standard cells location is defined to a particular position in a row. Space is set aside for interconnect to each logic/standard cell. After placement, we can see the accurate estimates of the capacitive loads of each standard cell must drive. The tool places these cells based on the algorithms which it uses internally. It is a process of placing the design cells in the floorplan in the most optimal way. What does the Placement Algorithm want to optimize? The main of the placement algorithm is 1. Making the chip as dense as possible ( Area Constraint) 2. Minimize the total wire length ( reduce the length for critical nets)
San Francisco State University
Nano-Electronics & Computing Research Lab
99
3. The number of horizontal/vertical wire segments crossing a line. Constraints for doing the above are: The placement should be routable (no cell overlaps; no density overflow). Timing constraints are met There are different algorithms to do placement. The most popular ones are as follows: 1. Constructive algorithms: This type of algorithm uses a set of rules to arrive at the optimized placement. Example: Cluster growth, min cut, etc. 2. Iterative algorithms: Intermediate placements are modified in an attempt to improve the cost function. It uses an already constructed placement initially and iterates on that to get a better placement. Example: Force-directed method, etc 3. Nondeterministic approaches: simulated annealing, genetic algorithm, etc. Min-Cut Algorithm This is the most popular algorithm for placement. This method uses successive application of partitioning the block. It does the following steps: 1. Cuts the placement area into two pieces. This piece is called a bin. It counts the number of nets crossing the line. It optimizes the cost function. The cost function here would be number of net crossings. The lesser the cost function, the more optimal is the solution. 2. Swaps the logic cells between these bins to minimize the cost function. 3. Repeats the process from step 1, cutting smaller pieces until all the logic cells are placed and it finds the best placement option. The cost function not only depends on the number of crossings but also a number of various other factors such as, distance of each net, congestion issues, signal integrity issues etc. The size of the bin can vary from a bin size equal to the base cell to a bin size that would hold several logic cells. We can start with a large bin size, to get a rough placement, and then reduce the bin size to get a final placement. There are two steps in the Placement process. 1. Global Placement 2. Detail Placement
8.5 Routing After the floorplanning and placement steps in the design, routing needs to be done. Routing is nothing but connecting the various blocks in the chip with one an other. Until now, the blocks were only just placed on the chip. Routing also is spilt into two steps 1. Global routing: It basically plans the overall connections between all the blocks and the nets. Its main aim is to minimize the total interconnect length, minimize the critical path delay. It determines the track assignments for each interconnect. The chip is divided into small blocks. These small blocks are called routing bins. The size of the routing bin depends on the algorithm the tool uses. Each routing bin is also called a gcell. The size of this gcell depends on the tool.
San Francisco State University
Nano-Electronics & Computing Research Lab
100
Each gcell has a finite number of horizontal and vertical tracks. Global routing assigns nets to specific gcells but it does not define the specific tracks for each of them. The global router connects two different gcells from the centre point of each gcell. Track Assignment: The Global router keeps track of how many interconnections are going in each of direction. This is nothing but the routing demand. The number of routing layers that are available depend on the design and also, if the die size is more, the greater the routing tracks. Each routing layer has a minimum width spacing rule, and its own routing capacity. For Example: For a 5 metal layer design, if Metal 1, 4, 5 are partially up for inter-cell connections, pin, VDD, VSS connections, the only layers which are routable 100% are Metal2 and Metal3. So if the routing demand goes over the routing supply, it causes Congestion. Congestion leads to DRC errors and slow runtime. 2. Detailed Routing: In this step, the actual connection between all the nets takes place. It creates the actual via and metal connections. The main objective of detailed routing is to minimize the total area, wire length, delay in the critical paths. It specifies the specific tracks for the interconnection; each layer has its own routing grid, rules. During the final routing, the width, layer, and exact location of the interconnection are decided.
Figure 8.5.a : Routing grid Routing grid
Gcell
After detailed routing is complete, the exact length and the position of each interconnect for every net in the design is known. The parasitic capacitance, resistance can now is extracted to determine the actual delays in the design. The parasitic extraction is done by extraction tools. This information is back annotated and the timing of the design is now calculated using the actual delays by the Static Timing Analysis Tool. After timing is met and all other verification is performed such as LVS, etc, the design is sent to the foundry to manufacture the chip.
San Francisco State University
Nano-Electronics & Computing Research Lab
101
8.6 Packaging Depending on the type of packaging of the chip, the I/O cells, pad cells are designed differently during the Physical Implementation. There are two types of Packaging style: a. Wire-bond: The connections in this technique are real wires. The underside of the die is first fixed in the package cavity. A mixture of epoxy and a metal (aluminum, sliver or gold) is used to ensure a low electrical and thermal resistance between the die and the package. The wires are then bonded one at a time to the die and the package. Below is a illustration of Wire Bond packaging.
Figure 8.6.a : Wire Bond Example
b. Flip-Chip: Flip Chip describes the method of electrically connecting the die to the package carrier. This is a direct chip-attach technology, which accommodates dies that have several bond pads placed anywhere on the surfaces at the top. Solder balls are deposited on the die bond pads usually when they are still on the wafer, and at corresponding locations on the board substrate. The upside-down die (Flip-chip) is then aligned to the substrate. The advantage of this type of packaging is very short connections (low inductance) and high package density. The picture below is an illustration of flip-chip type of packaging.
San Francisco State University
Nano-Electronics & Computing Research Lab
102
Figure 8.6.b : Flip Chip Example
8.7 IC TUTORIAL EXAMPLE 8.7.1 Introduction The physical design stage of the ASIC design flow is also known as the “place and route” stage. This is based upon the idea of physically placing the circuits, which form logic gates and represent a particular design, in such a way that the circuits can be fabricated. This is a generic, high level description of the physical design (place/route) stage. Within the physical design stage, a complete flow is implemented as well. This flow will be described more specifically, and as stated before, several EDA companies provide software or CAD tools for this flow. Synopsys® software for the physical design process is called IC Compiler. The overall goal of this tool/software is to combine the inputs of a gate-level netlist, standard cell library, along with timing constraints to create and placed and routed layout. This layout can then be fabricated, tested, and implemented into the overall system that the chip was designed for. The first of the main inputs into ICC are : 1. Gate-level netlist, which can be in the form of Verilog or VHDL. This netlist is produced during logical synthesis, which takes place prior to the physical design stage( discussed in chapter 3 ). 2. The second of the main inputs into ICC is a standard cell library. This is a collection of logic functions such as OR, AND, XOR, etc. The representation in the library is that of the physical shapes that will be fabricated.
San Francisco State University
Nano-Electronics & Computing Research Lab
103
This layout view or depiction of the logical function contains the drawn mask layers required to fabricate the design properly. However, the place and route tool does not require such level of detail during physical design. Only key information such as the location of metal and input/output pins for a particular logic function is needed. This representation used by ICC is considered to be the abstract version of the layout. Every desired logic function in the standard cell library will have both a layout and abstract view. Most standard cell libraries will also contain timing information about the function such as cell delay and input pin capacitance which is used to calculated output loads. This timing information comes from detailed parasitic analysis of the physical layout of each function at different process, voltage, and temperature points (PVT). This data is contained within the standard cell library and is in a format that is usable by ICC. This allows ICC to be able to perform static timing analysis during portions of the physical design process. It should be noted that the physical design engineer may or may not be involved in the creating of the standard cell library, including the layout, abstract, and timing information. However, the physical design engineer is required to understand what common information is contained within the libraries and how that information is used during physical design. Other common information about standard cell libraries is the fact that the height of each cell is constant among the different functions. This common height will aid in the placement process since they can now be linked together in rows across the design. This concept will be explained in detail during the placement stage of physical design. 3. The third of the main inputs into ICC are the design constraints. These constraints are identical to those which were used during the front-end logic synthesis stage prior to physical design. These constraints are derived from the system specifications and implementation of the design being created. Common constraints among most designs include clock speeds for each clock in the design as well as any input or output delays associated with the input/output signals of the chip. These same constraints using during logic synthesis are used byICC so that timing will be considered during each stage of place and route. The constraints are specific for the given system specification of the design being implemented. In the below IC compiler tutorial example, we will place & route the fifo design synthesized. STEPS 1. As soon as you log into your engr account, at the command prompt, please type “csh “as shown below. This changes the type of shell from bash to c-shell. All the commands work ONLY in c-shell. [hkommuru@hafez ]$csh 2. Please copy the whole directory from the below location [hkommuru@hafez ]$ cp –rf /packages/synopsys/setup/asic_flow_setup ./
San Francisco State University
Nano-Electronics & Computing Research Lab
104
This ccreate directory structure as shown below. It will create a directory called “asic_flow_setup ”, under which it creates the following directories namely
asic_flow_setup src/ : for verilog code/source code vcs/ : for vcs simulation for counter example synth_graycounter/ : for synthesis of graycounter example synth_fifo/ : for fifo synthesis pnr_fifo/ : for Physical design of fifo design example extraction/: for extraction pt/: for primetime verification/: final signoff check The “asic_flow_setup” directory will contain all generated content including, VCS simulation, synthesized gate-level Verilog, and final layout. In this course we will always try to keep generated content from the tools separate from our source RTL. This keeps our project directories well organized, and helps prevent us from unintentionally modifying the source RTL. There are subdirectories in the project directory for each major step in the ASIC Flow tutorial. These subdirectories contain scripts and configuration files for running the tools required for that step in the tool flow. For this tutorial we will work exclusively in the vcs directory. 3. Please source “synopsys_setup.tcl” which sets all the environment variables necessary to run the VCS tool. Please source them at unix prompt as shown below [hkommuru@hafez ]$ source /packages/synopsys/setup/synopsys_setup.tcl Please Note : You have to do steps 1 and 3 above everytime you log in. 4. Go to the pnr directory . [
[email protected]] $cd asic_flow_setup/pnr_fifo [
[email protected]] $cd scripts [
[email protected]] $emacs init_design_icc.tcl & [
[email protected]] $cd .. At the unix prompt type “icc_shell “, it will open up the icc window. [
[email protected]] $icc_shell Next, to open the gui, type “gui_start”, it opens up gui window as shown in the next page . icc_shell > gui_start
San Francisco State University
Nano-Electronics & Computing Research Lab
105
Before a design can be placed and routed within ICC, the environment for the design needs to be created. The goal of the design setup stage in the physical design flow is to prepare the design for floorplanning. The first step is to create a design library. Without a design library, the physical design process using will not work. This library contains all of the logical and physical data that will need. Therefore the design library is also referenced as the design container during physical design. One of the inputs to the design library which will make the library technology specific is the technology file.
CREATING DESIGN LIBRARY 4.a Setting up the logical libraries. The below commands will set the logical libraries and define VDD and VSS icc_shell > lappend search_path “/packages/process_kit/generic/generic_90nm/updated_Oct2008/SAED_EDK90n m/Digital_Standard_Cell_Library/synopsys/models” icc_shell > set link_library “ * saed90nm_max.db saed90nm_min.db saed90nm_typ.db”
San Francisco State University
Nano-Electronics & Computing Research Lab
106
icc_shell > set target_library “ saed90nm_max.db” icc_shell > set mw_logic0_net VSS icc_shell > set mw_logic1_net VDD icc_shell> set_tlu_plus_files -max_tluplus /packages/process_kit/generic/generic_90nm/updated_Oct2008/SAED_EDK90n m/Digital_Standard_Cell_Library/process/star_rcxt/tluplus/saed90nm_1p9m_1t_ Cmax.tluplus -min_tluplus /packages/process_kit/generic/generic_90nm/updated_Oct2008/SAED_EDK90n m/Digital_Standard_Cell_Library/process/star_rcxt/tluplus/saed90nm_1p9m_1t_ Cmin.tluplus -tech2itf_map /packages/process_kit/generic/generic_90nm/updated_Oct2008/SAED_EDK90n m/Digital_Standard_Cell_Library/process/astro/tech/tech2itf.map 4.b Creating Milkway database icc_shell> create_mw_lib -technology /packages/process_kit/generic/generic_90nm/updated_Oct2008/SAED_EDK90n m/Digital_Standard_Cell_Library/process/astro/tech/astroTechFile.tf mw_reference_library /packages/process_kit/generic/generic_90nm/updated_Oct2008/SAED_EDK90n m/Digital_Standard_Cell_Library/process/astro/fram/saed90nm_fr/ FIFO_design.mw notice the space between saed90nm_fr/ and FIFO_design.mw, which is the design name. You can choose your own design name. 4.c Open the newly created Milkyway database icc_shell > open_mw_lib FIFO_design.mw 4.d Read in the gate level synthesized verilog netlist. It opens up a layout window , which contains the layout information as shown below. You can see all the cells in the design at the bottom, since we have not initialized the floorplan yet or done any placement. icc_shell > read_verilog ../synth_fifo/output/fifo.v
San Francisco State University
Nano-Electronics & Computing Research Lab
107
4.e Uniquify the design by using the uniquify_fp_mw_cel command. The Milkyway format does not support multiply instantiated designs. Before saving the design in Milkyway format, you must uniquify the design to remove multiple instances. icc_shell> uniquify_fp_mw_cel 4.f Link the design by using the link command (or by choosing File > Import > Link Design in the GUI). icc_shell> link 4.g Read the timing constraints for the design by using the read_sdc command (or by choosing File > Import > Read SDC in the GUI). icc_shell > read_sdc ../synth_fifo/const/fifo.sdc
San Francisco State University
Nano-Electronics & Computing Research Lab
108
4.h Save the design. icc_shell > save_mw_cel –as fifo_inital
FLOORPLANNING Open file /scripts/floorplan_icc.tcl 5. Initalize the floorplan with below command icc_shell > initialize_floorplan -core_utilization 0.6 -start_first_row left_io2core 5.0 -bottom_io2core 5.0 -right_io2core 5.0 -top_io2core 5.0 pin_snap You can see in the layout window, the floorplan size and shape. Since we are still in the floorplan stage all the cells in the design are outside of the floorplan . You can change the above options to play around with the floorplan size.
San Francisco State University
Nano-Electronics & Computing Research Lab
109
6. Connect Power and Ground pins with below command icc_shell > derive_pg_connection -power_net VDD –ground_net VSS icc_shell > derive_pg_connection -power_net VDD –ground_net VSS -tie
7. ICC automatically places the pins around the boundary of the floorplan evenly, if there are no pin constraints given. You can constrain the pins around the boundary [ the blue color pins in the above figure ] , using a TDF file. You can look at the file /const/fifo.tdf You need to create the TDF file in the following format pin PINNAME layer width height pinside [ pin Order ] pin PINNAME layer width height pinside [ pin Offset ] Example with pin Order pin Clk M3 0.36 0.4 right 1 In this tutorial example, the tool is placing the pins automatically. Hence, you do not have to run this step. 8. Power Planning: First we need to create rectangular power ring around the floorplan.
San Francisco State University
Nano-Electronics & Computing Research Lab
110
##Create VSS ring icc_shell>create_rectangular_rings -nets {VSS} -left_offset 0.5 left_segment_layer M6 -left_segment_width 1.0 -extend_ll -extend_lh right_offset 0.5 -right_segment_layer M6 -right_segment_width 1.0 extend_rl -extend_rh -bottom_offset 0.5 -bottom_segment_layer M7 bottom_segment_width 1.0 -extend_bl -extend_bh -top_offset 0.5 top_segment_layer M7 -top_segment_width 1.0 -extend_tl -extend_th ## Create VDD Ring icc_shell>create_rectangular_rings -nets {VDD} -left_offset 1.8 left_segment_layer M6 -left_segment_width 1.0 -extend_ll -extend_lh right_offset 1.8 -right_segment_layer M6 -right_segment_width 1.0 extend_rl -extend_rh -bottom_offset 1.8 -bottom_segment_layer M7 bottom_segment_width 1.0 -extend_bl -extend_bh -top_offset 1.8 top_segment_layer M7 -top_segment_width 1.0 -extend_tl -extend_th ## Creates Power Strap icc_shell>create_power_strap -nets { VDD } -layer M6 -direction vertical width 3 icc_shell>create_power_strap -nets { VSS } -layer M6 -direction vertical width 3 See in the figure below.
San Francisco State University
Nano-Electronics & Computing Research Lab
111
10. Save the design . icc_shell> save_mw_cel –as fifo_fp
PLACEMENT open /scripts/place_icc.tcl During the optimization step, the place_opt command introduces buffers and inverters tofix timing and DRC violations. However, this buffering strategy is local to some critical paths.The buffers and inverters that are inserted become excess later because critical paths change during the course of optimization. You can reduce the excess buffer and inverter counts after place_opt by using the set_buffer_opt_strategy command, as shown icc_shell> set_buffer_opt_strategy -effort low This buffering strategy will not degrade the quality of results (QoR). Also, by default, IC Compiler performs automatic high-fanout synthesis on nets with a fanout greater than or equal to 100 and does not remove existing buffer or inverter trees.
San Francisco State University
Nano-Electronics & Computing Research Lab
112
You can control the medium- and high-fanout thresholds by using the -hf_thresh and mf_thresh options, respectively. You can control the effort used to remove existing buffer and inverter trees by using the -remove_effort option.
Setting TLUplus files: TLUPlus models are a set of models containing advanced process effects that can be used by the parasitic extractors in Synopsys place-and-route tools for modeling. These files need to be set using the set_tlu_plus_files command as shown below: icc_shell> set_tlu_plus_files -max_tluplus /packages/process_kit/generic/generic_90nm/updated_Oct2008/SAED_EDK90n m/Digital_Standard_Cell_Library/process/star_rcxt/tluplus/saed90nm_1p9m_1t_ Cmax.tluplus -min_tluplus /packages/process_kit/generic/generic_90nm/updated_Oct2008/SAED_EDK90n m/Digital_Standard_Cell_Library/process/star_rcxt/tluplus/saed90nm_1p9m_1t_ Cmin.tluplus -tech2itf_map /packages/process_kit/generic/generic_90nm/updated_Oct2008/SAED_EDK90n m/Digital_Standard_Cell_Library/process/astro/tech/tech2itf.map 11. Goto Layout Window , Placement Core Placement and Optimization . A new window opens up as shown below . There are various options, you can click on what ever option you want and say ok. The tool will do the placement. Alternatively you can also run at the command at icc_shell . Below is example with congestion option. icc_shell > place_opt –congestion
When you want to add area recovery, execute : # place_opt -area_recovery -effort low
San Francisco State University
Nano-Electronics & Computing Research Lab
113
# When the design has congestion issues, you have following choices : # place_opt -congestion -area_recovery -effort low # for medium effort congestion removal # place_opt -effort high -congestion -area_recovery # for high eff cong removal ## What commands do you need when you want to optimize SCAN ? # read_def < def file > # check_scan_chain > $REPORTS_DIR/scan_chain_pre_ordering.rpt # report_scan_chain >> $REPORTS_DIR/scan_chain_pre_ordering.rpt # place_opt -effort low -optimize_dft
## What commands do you need when you want to reduce leakage power ? # set_power_options -leakage true # place_opt -effort low -area_recovery -power
## What commands do you need when you want to reduce dynamic power ? # set_power_options -dynamic true -low_power_placement true # read_saif –input < saif file > # place_opt -effort low -area_recovery –power # Note : option -low_power_placement enables the register clumping algorithm in # place_opt, whereas the option -dynamic enables the # Gate Level Power Optimization (GLPO)
## When you want to do scan opto, leakage opto, dynamic opto, and you have congestion issues, ## use all options together : # read_def < scan def file > # set_power_options -leakage true -dynamic true -low_power_placement true # place_opt -effort low -congestion -area_recovery -optimize_dft -power -num_cpus
12. After the placement is done, all the cells would be placed in the design and it would the below window.
San Francisco State University
Nano-Electronics & Computing Research Lab
114
13. You can report the following information after the placement stage. icc_shell> save_mw_cel –as fifo_place ### Reports icc_shell>report_placement_utilization > output/fifo_place_util.rpt icc_shell>report_qor_snapshot > output/fifo_place_qor_snapshot.rpt icc_shell>report_qor > output/fifo_place_qor.rpt ### Timing Report icc_shell>report_timing -delay max -max_paths 20 > output/fifo_place.setup.rpt icc_shell>report_timing -delay min -max_paths 20 > output/fifo_place.hold.rpt
After placement, if you look at the fifo_cts.setup.rpt and fifo_cts.hold.rpt, in the reports directory, they meet timing.
CLOCK TREE SYNTHESIS
San Francisco State University
Nano-Electronics & Computing Research Lab
115
open scripts/ cts_icc.tcl Before doing the actual cts, you can set various optimization steps. In the Layout window, click on “Clock “, you will see various options, you can set any of the options to run CTS. If you click on Clock Core CTS and Optimization .
14. Save the Cell and report timing icc_shell>save_mw_cel -as fifo_cts icc_shell> report_placement_utilization > reports/fifo_cts_util.rpt icc_shell> report_qor_snapshot > reports/fifo_cts_qor_snapshot.rpt icc_shell> report_qor > reports/fifo_cts_qor.rpt icc_shell> report_timing –max_paths 20 –delay max > reports/fifo_cts.setup.rpt icc_shell> report_timing –max_paths 20 –delay min > reports/fifo_cts.hold.rpt
CTS POST OPTIMIZATION STEPS ##Check for hold time and setup time and do incremental if there are any violations ## setup time fix ## clock_opt -only_psyn San Francisco State University
Nano-Electronics & Computing Research Lab
116
## clock_opt -sizing ## hold_time fix ## clock_opt -only_hold_time ## Save cel again and report paths save_mw_cel -as fifo_cts_opt ### Timing Report report_timing -delay max -max_paths 20 > reports/fifo_cts_opt.setup.rpt report_timing -delay min -max_paths 20 > reports/fifo_cts_opt.hold.rpt
ROUTING open scripts/route_icc.tcl 14 . In the layout window, click on Route Core Routing and Optimization, a new window will open up as shown below
San Francisco State University
Nano-Electronics & Computing Research Lab
117
You can select various options, if you want all the routing steps in one go, or do global routing first, and then detail, and then optimization steps. It is up to you. icc_shell> route_opt Above command does not have optimizations. You can although do an incremental optimization by clicking on the incremental mode in the above window after route_opt is completed. View the shell window after routing is complete. You can see that there are no DRC violations reported, indicating that the routing is clean:
San Francisco State University
Nano-Electronics & Computing Research Lab
118
15. Save the cel and report timing icc_shell > save_mw_cel –as fifo_route icc_shell> report_placement_utilization > reports/fifo_route_util.rpt icc_shell> report_qor_snapshot > reports/fifo_route_qor_snapshot.rpt icc_shell> report_qor > reports/fifo_route_qor.rpt icc_shell> report_timing –max_paths 20 –delay max > reports/fifo_route.setup.rpt icc_shell> report_timing –max_paths 20 –delay min > reports/fifo_route.hold.rpt
POST ROUTE OPTIMIZATION STEPS 16. Goto Layout Window, Route Verify Route, it opens up a new window as shown below, click ok.
San Francisco State University
Nano-Electronics & Computing Research Lab
119
The results are clean , as you can see in the window below:
If results are not clean, you might have to do post route optimization steps, like incremental route. Verify, clean, etc.
San Francisco State University
Nano-Electronics & Computing Research Lab
120
EXTRACTION 9.0 Introduction In general, almost all layout tools are capable of extracting the layout database using various algorithms. These algorithms define the granularity and the accuracy of the extracted values. Depending upon the chosen algorithm and the desired accuracy, the following types of information may be extracted: Detailed parasitics in DSPF or SPEF format. Reduced parasitics in RSPF or SPEF format. Net and cell delays in SDF format. Net delay in SDF format + lumped parasitic capacitances. The DSPF (Detailed Standard Parasitic Format) contains RC information of each segment (multiple R’s and C’s) of the routed netlist. This is the most accurate form of extraction. However, due to long extraction times on a full design, this method is not practical. This type of extraction is usually limited to critical nets and clock trees of the design. The RSPF (Reduced Standard Parasitic Format) represents RC delays in terms of a pi model (2 C’s and 1 R). The accuracy of this model is less than that of DSPF, since it does not account for multiple R’s and C’s associated with each segment of the net. Again, the extraction time may be significant, thus limiting the usage of this type of information. Target applications are critical nets and small blocks of the design. Both detailed and reduced parasitics can be represented by OVI’s (Open Verilog International) Standard Parasitic Exchange Format (SPEF). The last two (number 3 and 4) are the most common types of extraction used by the designers. Both utilize the SDF format. However, there is major difference between the two. Number 3 uses the SDF to represent both the cell and net delays, whereas number 4 uses the SDF to represent only the net delays. The lumped parasitic capacitances are generated separately. Some layout tools generate the lumped parasitic capacitances in the Synopsys set_load format, thus facilitating direct back annotation to DC or PT.
Extraction steps for the tutorial example: open scripts/extract_icc.tcl 17. Go to Layout Window, Route Extract RC, it opens up a new window as shown below, click ok.
San Francisco State University
Nano-Electronics & Computing Research Lab
121
Alternatively, you can run this script on the ICC shell: icc_shell > extract_rc -coupling_cap -routed_nets_only -incremental ##write parasitic to a file for delay calculations tools (e.g PrimeTime). icc_shell > write_parasitics -output ./output/fifo_extracted.spef -format SPEF The above script will produce the min and max files, which can be used for delay estimation using PrimeTime tool. ##Write Standard Delay Format (SDF) back-annotation file icc_shell > write_sdf ./output/fifo_extracted.sdf ##Write out a script in Synopsys Design Constraints format icc_shell > write_sdc ./output/fifo_extracted.sdc ##Write out a hierarchical Verilog file for the current design, extracted from layout icc_shell > write_verilog ./output/fifo_extracted.v The extracted verilog netlist can be used to double-check the netlist by running a simulation on it using VCS 18. Report timing icc_shell> report_timing –max_paths 20 –delay max > reports/fifo_extracted.setup.rpt icc_shell> report_timing –max_paths 20 –delay min > reports/fifo_extracted.hold.rpt
San Francisco State University
Nano-Electronics & Computing Research Lab
122
19. Report power icc_shell> report_power > reports/fifo_power.rpt If you open the generated fifo_power.rpt, you will notice both total dynamic power (active mode) and cell leakage power (standby mode) being reported. 20. Save the design icc_shell> save_mw_cel -as fifo_extracted
Post-Layout Timing Verification Using PrimeTime After extraction of RC parasitics (.spef file) and the enlist (.V) from layout, we can run primetime to perform timing verification on the extracted netlist. The steps will be similar to the step we used to run prime time on the verilog netlist obtained after DC synthesis, except that we need to use the post layout netlist as well as the parasitic information. 1. Please source “synopsys_setup.tcl” which sets all the environment variables necessary to run the Primetime . Please type csh at the unix prompt before you source the below script. Please source the above file from the below location. [
[email protected]] $ csh [
[email protected]] $ cd [
[email protected]] $ cd /asic_flow_setup/pt_post [
[email protected]] $ source /packages/synopsys/setup/synopsys_setup.tcl 2. PT may be invoked in the command-line mode using the command pt_shell or in the GUI mode through the command primetime as shown below. Command-line mode: > pt_shell GUI-mode: > primetime Before doing the next step, open the post_layout_pt.tcl script and keep it ready which is at location /scripts/post_layout_pt.tcl [
[email protected]]$ vi scripts/post_layout_pt.tcl 3. Just like DC setup, you need to set the path to link_library and search_path pt_shell > set link_library [ list /packages/process_kit/generic/generic_90nm/updated_Oct2008/SAED_EDK90nm/Digita l_Standard_Cell_Library/synopsys/models/saed90nm_typ.db
San Francisco State University
Nano-Electronics & Computing Research Lab
123
/packages/process_kit/generic/generic_90nm/updated_Oct2008/SAED_EDK90nm/Digita l_Standard_Cell_Library/synopsys/models/saed90nm_max .db/packages/process_kit/gen eric/generic_90nm/updated_Oct2008/SAED_EDK90nm/Digital_Standard_Cell_Library/ synopsys/models/saed90nm_min.db ] pt_shell > set target_library [ list /packages/process_kit/generic/generic_90nm/updated_Oct2008/SAED_EDK90nm/Digita l_Standard_Cell_Library/synopsys/models/saed90nm_max.db] 4. Read the extracted netlist pt_shell> read_verilog ../pnr_fifo/output/fifo_extracted.v 5. You need to set the top module name. pt_shell > current_design FIFO 6. Read extracted parasitics pt_shell> read_parasitics -format SPEF ../pnr_fifo/output/fifo_extracted.spef.max 7. Read in the SDC from the ICC pt_shell> read_sdc ../pnr_fifo/output/fifo_extracted.sdc 8. Now we can do the analysis of the design. Generally, four types of analysis is performed on the design, as follows: From primary inputs to all flops in the design. From flop to flop. From flop to primary output of the design. From primary inputs to primary outputs of the design. All four types of analysis can be accomplished by using the following commands: pt_shell> report_timing -from [all_inputs] -max_paths 20 -to [all_registers -data_pins] > reports/timing.rpt pt_shell> report_timing -from [all_register -clock_pins] -max_paths 20 -to [all_registers -data_pins] >> reports/timing.rpt pt_shell> report_timing -from [all_registers -clock_pins] -max_paths 20 -to [all_outputs] >> reports/timing.rpt pt_shell> report_timing -from [all_inputs] -to [all_outputs] -max_paths 20 >> reports/timing.rpt
San Francisco State University
Nano-Electronics & Computing Research Lab
124
The results are reported to the timing.rpt file under the reports subdirectory. Please open the file to see if the design meets the timing or if there are any errors. 9. Reporting setup time and hold time. Primetime by default reports the setup time. You can report the setup or hold time by specifying the –delay_type option as shown in below figure. pt_shell> report_timing -from [all_registers -clock_pins] -to [all_registers -data_pins] delay_type max >> reports/timing.rpt The report is added to the timing.rpt file. Please read the file. 10. Reporting hold time pt_shell> read_parasitics -format SPEF ../pnr_fifo/output/fifo_extracted.spef.min pt_shell> report_timing -from [all_registers -clock_pins] -to [all_registers -data_pins] delay_type min >> reports/timing.rpt The report is added to the timing.rpt file. Please read the file.
11. Reporting timing with capacitance and transition time at each level in the path pt_shell > report_timing -transition_time –capacitance –nets -input_pins –from [all_registers –clock_pins ] –to [ all_registers –data_pins ] > reports/timing.tran.cap.rpt The report is added to the timing.tran.cap.rpt file. Please read the file for results. 12. You can save your session and come back later if you chose to. pt_shell > save_session output/fifo.session
San Francisco State University
Nano-Electronics & Computing Research Lab
125
APPENDIX A: Design for Test A.0 Introduction What do we do to test the chip after it is manufactured? Why do we need DFT? Consider a scenario where a million chips are produced. It is time consuming and an extremely costly process of trying to test each of these million chips. The design being correct does not guarantee that the manufactured chip is operational. It could have a lot of manufacturing defects. For example for 0.13nm technology, the percentage of chips that are good is about 60%. Also it is very difficult to ascertain that the chip manufactured will function correctly for all possible inputs and various other conditions. Moreover even we do test the chip; we can only see the inputs and the output pins. A designer will not be able to see what is happening at the intermediate steps before the signal reaches the output pins. To overcome this problem DFT was started. This is the second best thing we can do. It increases the probability of the chip working in a real system. To perform Design for Test, very small changes in the design are needed. In CMOS technology, the transistor consists of both NMOS and PMOS transistors. If we take an example of and inverter, we see that PMOS is connected to VDD and NMOS is connected to VSS. Inverter inverts the given input. PMOS transistor is on when the input to the gate is zero. It charges up the capacitor to the VDD value and the opposite e happened for NMOS. So basically NMOS acts alike a pull down device and PMOS acts like a pull up device. SO sometimes what happens is that these pull up and pull down devices don’t work properly in some transistors and a fault occurs. This fault is called as ‘Stuck at Fault’. The logic could be stuck at zero permanently or at ‘1’ permanently without depending on the input values. The next topic covers Test techniques.
A.1 Test Techniques A.1.1 Issues faced during testing 1. Consider a combinatorial circuit which has N inputs. To validate the circuit, we need to exhaustively apply all possible input test vectors and observe the responses. Therefore for N inputs we need to generate 2 to the power of N inputs. If the number of inputs is too high, we still can manage to it, but it would take a long time. Test vector: A set of input vectors to test the system. 2. Now consider a Sequential circuit, for a sequential circuit, the output of the circuit depends on the inputs as well as the state value. To test such a circuit, it would take extremely long long time and is practically impossible to do it. To overcome the above issue, a Scan-based Methodology was introduced
A.2 Scan-Based Methodology To begin with, there are two important concepts we need to understand. They are: 2. Controllability: It is the ability to control the nodes in a circuit by a set of inputs. For a given set of input and output pins, when we give the system a set of input San Francisco State University
Nano-Electronics & Computing Research Lab
126
test vectors, we should be able to control each node we want to test. The higher the degree of controllability, the better. 3. Observability: It is the ease with which we can observe the changes in the nodes (gates). Like in the previous case the higher the observability, the better. What I mean by saying higher is that, we can see the desired state of the gates at the output in lesser number of cycles. It is easy to test combinational circuits using the above set of rules. For sequential circuits, to be able to the above, we need to replace the flip flops (FF) with ‘Scan-FF’. These Scan Flip Flops are a special type of flip flops; they can control and also check the logic of the circuits. There are two methodologies: 1. Partial Scan: Only some Flip-Flops are changed to Scan-FF. 2. Full Scan: Entire Flip Flops in the circuit are changed to these special Scan FF. This does mean that we can test the circuit 100%. What does the Scan-FF consist of and how does it work? The Scan-FF is nothing but a Multiplexer added to the Flip-Flop. We can control the input to the flip-flops by using the select pin of the multiplexer to do it. Therefore using the select pin, the circuit can run in two modes, functional mode and scan mode. In the scan mode, the select input is high and the input test vectors are passed to the system. So now we have controlled the circuit and we can therefore see how the circuit is going to behave for the specific set of input test vectors which were given. After the input vectors are in the exact place we want them to be in the circuit, the select pin is changed to low and the circuit is now in functional mode. We can now turn back the select pin to Scan Mode and the output vectors can be seen at the output pins and a new set of input test vectors are flushed into the system. We can check the output vectors to see whether they are expected results or not. Some Flip-Flops cannot be made scanable like Reset pins, clock gated Flip Flops Typical designs might have hundreds of scan chains... The number of scan chains depends on the clock domains. (Normally within a domain, it is not preferable to have different clocks in each scan chain) Example: If there are 10 clock domains, then it means the minimum number of scan chains would be 10. Scan chains test logic of combinational gates Scan chains test sequential Flip-Flops through the vectors which pass through them. Any mismatch in the value of the vectors can be found. Manufacturing tests: These include functional test and performance test. Functional test checks whether the manufactured chip is working according to what is actually designed and performance test checks the performance of the design (speed). After the chip comes back from the foundry, it sits on a load board to be tested. The equipment which tests these chips is called Automatic Test Equipment (ATE). The socket is connected to the board. The chip is placed on a socket. A mechanical arm is used to place the chip on the socket.
San Francisco State University
Nano-Electronics & Computing Research Lab
127
A test program tells the ATE what kind of vectors needs to be loaded. Once the vectors are loaded, the logic is computed and the output vectors can be observed on the screen. The output pattern should match the expected output. When an error is found, you can exactly figure out which flip-flop output is not right Through the Automatic Test Pattern Generator, we can point out the erroneous FF. Failure Analysis analyzes why the chip failed. This is a whole new different field. Fault Coverage: It tells us that for a given set of vectors, how many faults are covered. Test Coverage: It is the coverage of the testable logic; meaning how much of the circuit can be tested. The latest upcoming technology tests the chips at the wafer level (called wafer sort (with probes))
A.3 Formal Verification Formal Verification verifies the circuit without changing the logic of the circuit. It is the defacto standard used today in the industry. Some of the tools which use formal verification today in the industry are CONFORMAL (from cadence), FORMALITY (from Synopsys). Formal verification is an algorithmic-based approach to logic verification that exhaustively proves functional properties about a design. The algorithms formal verification uses are: Binary Decision Diagram (BDD): It is a compact data structure of Boolean logic. It can represent the logic state encoded as a Boolean function. Symbolic FSM Traversal Typically, the following are the types of formal verification: 1.Equivalence Checking: Verifies the functional equivalence of two designs that are at the same or different abstraction levels (e.g., RTL-to-RTL, RTL-to-Gate, or Gate-toGate). It checks combinatorial and sequential elements. (Basically checks if two circuits are equivalent). For sequential elements, it checks if the specific instance name occurs in both the circuits or not. 2. Model Checking: Verifies that the implementation satisfies the properties of the design. Model checking is used early in the design creation phase to uncover functional bugs. Compare Point: [Cadence Nomenclature]; it is defined as any input of a sequential element and any primary output ports.
APPENDIX B: EDA Library Formats B.1 Introduction In the EDA industry, library is defined as a collection of cells (gates). These cells are called standard cells. There are different kinds of libraries which are used at different steps in the whole ASIC flow. All the libraries used contain standard cells. The libraries contain the description of these standard cells; like number of inputs, logic functionality, propagation delay etc. The representation of each standard cell in each library is different.
San Francisco State University
Nano-Electronics & Computing Research Lab
128
There is no such library which describes all the forms of standard cells. For example: the library used for timing analysis contains the timing information of each of the standard cells; the library used during Physical Implementation contains the geometry rules. Standard Cell Libraries determine the overall performance of the synthesized logic. The library usually contains multiple implementations of the same logic-function, differing by area and speed. For example few of the basic standard cells could be a NOR gate, NAND gate, AND gate, etc. The standard cell could be a combination of the basic gates etc. Each library can be designed to meet the specific design constraints. The flowing are some library formats used in the ASIC flow:
LEF: Library Exchange Format: LEF is used to define an IC process and a logic cell library. For example, you would use LEF to describe a gate array: the base cells, the logic macros with their size and connectivity information, the interconnect layers and other information to set up the database that the physical design tools need. DEF: Design Exchange format: DEF is used to describe all the physical aspects of a particular chip design including the netlist and physical location of cells on the chip. For example, if you had a complete placement from a floorplanning tool and wanted to exchange this information with another tool, you would use DEF. EDIF: (Electronic Design Interchange Format) It is used to describe both schematics and layout. GDSII: Generic Data Structures Library: This file is used by foundry for fabricating the ASIC. SPICE: (Simulation Program with Integrated Circuits Emphasis) SPICE is a circuit simulator. It is used to analyze the behavior of the circuits. It is mostly used in the design of analog and mixed signal IC design. The input to SPICE is basically at netlist, and the tool analyzes the netlist information and does what it is asked to do. PDEF: Physical Design Exchange Format: It is a proprietary file format used by Synopsys to describe placement information and the clustering of logic cells. SPF: Standard Parasitic Format This file is generated by the Parasitic Extraction Tool. It contains all the parasitic information of the design such as capacitance, resistance etc. This file is generated after the layout. It is back annotated and the timing analysis of the design is performed again to get the exact timing information. .lib: Liberty Format This library format is from Synopsys.
San Francisco State University
Nano-Electronics & Computing Research Lab
129
.plib: Physical Liberty Format This library format is from Synopsys. It is mainly used for Very Deep Sub Micron Technology. This library is an extension of the Liberty format; it contains extensive, advanced information needed for Physical Synthesis, Floorplanning, Routing and RC Extraction SPEF: Standard Parasitic Exchange Format Standard Parasitic Exchange Format (SPEF) is a standard for representing parasitic data of wires in a chip in ASCII format. Resistance, capacitance and inductance of wires in a chip are known as parasitic data. SPEF is used for delay calculation and ensuring signal integrity of a chip which eventually determines its speed of operation. SDC: Synopsys Design Constraints File SDC is a Tcl Based format-constraining file. It provides the timing information, constraints regarding the design to the tool. The tool uses the SDC file when performing timing analysis. SDF: Standard Delay Format Primetime writes out SDF for gate level simulation purposes. It describes the gate delay and also the interconnect delay. SDF can also be used with floorplanning and synthesis tools to backannotate the interconnect delay. A synthesis tool can us this information to improve the logic structure. Fragment of SDF file: (TIMESCALE 100ps) (INSTANCE B) (DELAY (ABSOLUTE (NETDELAY net1 (0.6))) (INSTANCE B) (DELAY (ABSOLUTE (INTERCONNECT A.INV8.OUT B.DFF1.Q (:0.6:) (:0.6:)))) In this example the rising and falling delay is 60 ps (equal to 0.6 units multiplied by the time scale of 100 ps per unit specified in a TIMESCALE construct. The delay is specified between the output port of an inverter with instance name A.INV8 in block A and the Q input port of a D flip-flop (instance name B.DFF1) in block B
San Francisco State University
Nano-Electronics & Computing Research Lab
130