ASSESSMENT OF THE CHANGE DETECTION PROCEDURE DEDICATED TO FLOOD MONITORING USING ENVISAT WIDE SWATH MODE DATA ANDREOLI Rémi & YESOU Hervé SERTIT, Université Louis Pasteur, Bld Sébastien Brant, BP 10413 F-67412 Illkirch-Graffenstaden, France; email:
[email protected] ABSTRACT The aim of this paper is to assess the change detector r specifically elaborated to analyse ENVISAT ASAR Wide Swath Mode (WSM) data pairs for plain flood changes detection. The algorithm relies on an enhanced ratio for strong changes over large homogeneous and flat areas combined with a ratio calculated from the two raw images. The change detection assessment was conducted on 14 image pairs exploiting the ENVISAT WSM database set up over the Poyang Lake within the framework of the Flood DRAGON Project. The best results were obtained by performing a supervised classification on a colour composite combining the change detector r, the before and after images. Change extraction accuracy reaches 86.3% and is very robust despite the differences in data polarization combinations. Mainly focused on plain flood changes, the proposed change detection procedure is also sensitive to changes relative to intensive shipping, rice cycles and wetland vegetation growth.
concern large surfaces; and (c) plain floods occur in relatively flat areas [11, 12]. In this way, the change detector is based on a enhance ratio taking into account strong changes over large homogeneous areas. If a first visual inspection of the results quality had already been carried out, the aim of this paper is to quantitatively assess the proposed change detection methodology for large plain flood mapping and monitoring using ENVISAT WSM data. 2.
CHANGE DETECTION PROCEDURE
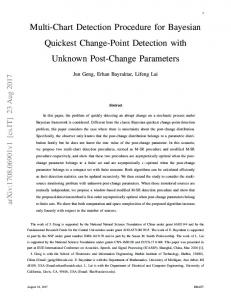
The change detector used is based on an enhanced ratio which includes two levels of analysis (Fig. 1). A macroscale analysis based on a first ratio with the aim of highlighting changes over large homogeneous areas is combined with a second ratio calculated from the two raw images what highlights major positive and negative changes while keeping thematic precision of raw data. Using a DEM this procedure takes account of slope and aspect during the processing (Fig. 1).
Keywords: Change detection, ENVISAT Wide Swath Mode, plain floods, assessment, accuracy, Poyang Lake. 1.
INTRODUCTION
Floods regularly cause large numbers of casualties with increasing economic loss as one of the widespread natural disasters. The remote sensing's capabilities in flood mapping and monitoring had already been well demonstrated. Furthermore, if optical data's utility in flood detection depends on cloud cover, radar remote sensing, with “all weather” monitoring capability and its large coverage, is an important tool in flood monitoring [1, 2, 3, 4, 5, 6]. Soon after the launch of the European ENVISAT satellite in March 2002, ENVISAT Advanced-SAR (ASAR) data were exploited to map and to monitor the 2002 summer Central Europe flood event [7, 8]. Despite the appropriateness of its wide coverage (400 km x 4000 km maximum for a stripe) and its revisit potential (from 3 to 10 days), the ENVISAT ASAR Wide Swath Mode (WSM) data appears underexploited for large plain flood mapping and monitoring [9], all the more so since the great potential of ENVISAT WSM data for monitoring inland water bodies was highlighted [10]. A change detection procedure for plain flood recognition using ENVISAT WSM data was proposed relying on the facts that: (a) floods correspond to the immersion of surfaces by water; (b) plain floods often _____________________________________________________ Proc. Dragon 1 Programme Final Results 2004–2007, Beijing, P.R. China 21– 25 April 2008 (ESA SP-655, April 2008)
Figure 1: Change detection procedure According to this, the change detection procedure includes four main steps: (a) data calibration and filtering; (b) change calculation; (c) topographic effects elimination; and (d) flood changes enhancement. 2.1.
Data calibration and filtering
Change detection based on ratioing requires much data preparation including data orthorectification and data calibration [13]. The antenna pattern was corrected and data were converted into linear backscattering values
using the Backscattering Image Generation tool in BEST software. Data orthorectification was performed using an SRTM DEM (90m resolution) with the PCI Geomatica v9.1 orthorectification tool. In addition, a texture filtering step is included to highlight homogeneous areas. These ones were enhanced using iterative processing with a growing window size relying on the alternate calculation of two sub-filters based on a moving median filter. Empirically, 3 iterations were found to work best (Eqs. 1-3): • for k = 1: p = 5 and n = 25
The distribution of rh values was assumed to be unimodal centred on 1 (mean ≈ mode ≈ median ≈ 1), with a small standard deviation of around 0.01 [11, 12]. In this case, major changes are expressed when rh >> 1 (drawoff) or rh σ 1 + m1 Either I1 = mˆ1 if ⎨ 0 or I1 = I 0 ⎩ I 0 < σ 1 − m1
(1)
• for k = 2 : p = 9 and n = 81 Either I 2 = mˆ 2 if σ 2 − m2 < I1 < σ 2 + m2 or I 2 = I1
(2)
× rh if
−q