Abstract. This paper presents a fully automated brain segmentation method that has been applied to a group of patients with infratento- rial ependymoma.
Atlas-based segmentation of the brain for 3-dimensional treatment planning in children with infratentorial ependymoma Pierre-Fran¸cois D’Haese1,2 , Valerie Duay1 , Thomas E. Merchant3 , Benoit Macq1 , Benoit M. Dawant1 1
Vanderbilt University, Nashville, TN, USA Universit´e Catholique de Louvain, Louvain-la-Neuve, Belgique Department of Radiation Oncology, St Jude Children’s Research Hospital, Memphis, TN, USA 2
3
Abstract. This paper presents a fully automated brain segmentation method that has been applied to a group of patients with infratentorial ependymoma. The purpose of the study was to test the hypothesis that fully-automated atlas-based segmentation methods provide useful normal tissue dosimetry from which dose-volume modeling may be performed in a manner equivalent to dose-volume data obtained from manual contouring. To test this hypothesis, we compared the integrated average dose for three small (chiasm, pituitary, hypothalamus) and three large (temporal lobes and total brain) normal tissue structures from ten patients using automated and manual contouring. There was no significant difference in the calculated average dose for the structures of interest. The greatest difference was noted for smaller structures which were located along the midline and in the gradient of dose. The results of this study form the basis of an ongoing larger study involving similar patients to evaluate automated and manual contouring as well as the clinical significance of any differences using dose-volume modeling.
1
Introduction
Systematic definition of target volumes and normal tissue structures is critical to the application of 3-dimensional radiation therapy treatment planning techniques in patients with brain tumors (Merchant et al. [1]). Normal tissue dosimetry plays an important role in treatment optimization using forward or inverse planning methods. The dosimetry of specific normal tissue volumes may be used to model the effects of radiation when correlated with outcome measures that depend on the functional elements of the defined volume (Merchant et al. [2]). Three-dimensional planning techniques are time consuming and because they rely on manual target volume definition and iterative evaluation of target coverage, normal tissue contouring is seldom performed in a consistent manner and for a sufficient number of structures to achieve a proper level of significance. A number of techniques have been proposed to segment medical images automatically or semi-automatically but for our application, which necessitates the
segmentation of internal structures and substructures, atlas-based methods are the most appropriate. These methods rely on the existence of a reference image volume (the atlas) in which structures of interest have been carefully segmented, possibly by hand. To segment a new image volume, a transformation that registers the atlas to this volume is first computed. This transformation is then used to project labels assigned to structures from the atlas onto the image volume to be segmented. Techniques that permit the computation of transformations capable of warping one brain onto the other have been proposed over the years (see for instance Meyer et al. [3], Rueckert et al. [4]). These methods have been used for the creation of statistical atlases, for the comparison of morphological characteristics between populations, or for segmentation. But with few exceptions, (Dawant et al. [5] and Bach et al. [6]) these studies have been conducted on image volumes that do not contain tumors or lesions which can alter the anatomy of the brain considerably. The objective of the study presented herein is to assess the validity of atlas-based techniques for the automatic segmentation of most structures delineated for typical radiation therapy applications.
2 2.1
Methods Data
The technique we propose has been tested on a group of children with a median age of 2.33 years (range 1.05-10.35 years) with infratentorial ependymoma.. This group was chosen because infratentorial tumor location is common among children with brain tumors, surgical resection has limited impact on the deformation of the supratentorial normal tissues, and these patients were among those treated on a prospective study of radiation-related CNS effects where outcome measures will be available (Merchant et al. [7]). The data set is particularly challenging because brain morphology was found to be more variable in younger children than in adults. Some of the subjects included in this data set had enlargement of the ventricular system due to obstructive hydrocephalus which, despite improvement after surgery or CSF shunting, necessitated large deformations of the atlas. The imaging studies included post-operative studies which were acquired for evaluation of residual tumor and for the purpose of planning radiation therapy. The imaging studies were performed on Siemens Vision and Symphony 1.5T MR systems. Each volume consisted of about 60 axial slices with an image matrix of 256x256 pixels and voxels dimensions are 0.78x0.78x3 mm3. This data set has a low spatial resolution but each volume was resampled to a 256x256x256 1mm3 isotropic volume before processing. The resampling allows us to deal with images having the same size. This, in turn, allows us to keep the same registration parameters for all the volumes. The volume used as an atlas was chosen among the volumes used in the study. It was visually selected as being representative of the population (average brain size or shape and average ventricular size). For each structure to be segmented, a radiation oncologist [TM] delineated contours on each individual slice in the atlas. Delineation was performed on the axial slices using an interactive environment we developed for this purpose. Because
it is difficult for a human operator to draw contours on consecutive slices that lead to smooth 3D shapes, these were post-processed using a surface smoothing spline approach to generate smooth surface models in the atlas. For this data set, structures of interest include the brain stem, cerebellum, chiasm, pituitary, and hypothalamus, the left and right thalamus, occipital lobes, mesial temporal lobes, temporal lobes, and frontal lobes.
2.2
Atlas to subject registration
Registration was performed in two steps. First, the atlas was registered to the volume of interest with a nine degrees of freedom transformation using an independent implementation of a mutual-information based technique similar to the one proposed by Maes et al. [8]. In this study, we have used two resolutions (128x128x128) and (256x256x256) and 64 bins for the reference and target image histograms. In the second step, a recently developed non rigid registration algorithm was used (Rohde et al. [9]). In this method that has been inspired by the work of Rueckert et al. [4] and Meyer et al. [3], the deformation that registered one image onto the other is modeled with a linear combination of radial basis functions with finite support. The similarity measure used to drive the registration process is the mutual information between the images. We have implemented several improvements over existing mutual information-based non-rigid registration algorithm [9]. These include working on an irregular grid, adapting the compliance of the transformation locally, decoupling a very large optimization problem into several smaller ones, and deriving schemes to guarantee the topological correctness of the computed transformations. Our algorithm computes the final deformation field iteratively across scales and resolutions (in this context, resolution means the spatial resolution of the image while the scale is related to the transformation itself). A standard image pyramid is created to apply the algorithm at different resolutions. At each resolution, the scale of the transformation is adapted by modifying the region of support and the number of basis functions since the scale of the transformation is related to the bases’ region of support. Following this approach, the final deformation field is computed as the sum of the deformation fields at each level, with one level referring to a particular combination of scale and resolution. Parameters needed by this algorithm were selected on a few volumes and kept fixed for the entire study. The algorithm was applied at two resolutions (64x64x64 and 128x128x128). For our application we did not find any significant improvement when using the full image resolution and we elected not to use it to speed up the process. 3D binary masks generated from the structure models created using the atlas were deformed using the complete deformation fields obtained by composing the two transformations computed to register the atlas to each volume. The masks where also projected using the same deformation fields on the doses repartition volume data to permit computation of the dose absorbed by each structure of interest.
3
Validation
The ultimate objective of this study was to compare normal tissue dosimetry obtained from automated and manual contouring techniques. For this purpose we compared the integrated average dose for three small (chiasm, pituitary, hypothalamus) and three large (temporal lobes and total brain) normal tissue structures from ten patients obtained using automated and manual structure delineation.
4
Results
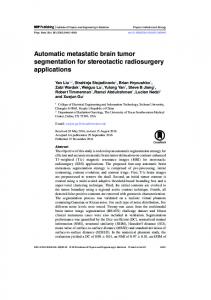
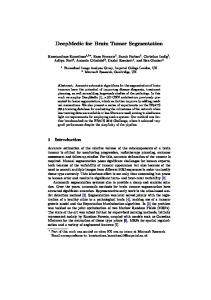
Segmentation was performed for 10 subjects which were used for validation using the doses distribution analysis. Representative automated contours appear in Figure 1 for qualitative validation. Tables 1 and 2 present doses in cGy absorbed by manually and automatically delineated structures for large and small structures. Figure 2 presents dose differences for each of the six structures in the following order: brain, temporal lobes, hypothalamus, chiasm and pituitary. There was no significant difference in the integrated average dose calculated for the total brain, right and left temporal lobes, optic chiasm, hypothalamus and pituitary (Figure 2). The greatest variance in the differences was noted for the smaller structures which were located along the midline and often in the gradient of dose for the group of patients included in this report.
36 37 57 74 87 100 102 120 127 133
Brain Auto M anual 1439.29 1367.48 2016.94 1918.32 1420.97 1424.05 1263.21 1276.80 1114.73 1047.67 2025.36 2008.86 1643.92 1598.47 1539.80 1535.60 1602.43 1658.53 2397.89 2342.54
T empLef t Auto M anual 2163.52 2579.58 3561.36 3597.29 2516.37 2624.72 1881.15 1965.81 1902.00 1534.71 1985.45 1810.60 2606.45 2736.08 1754.72 1842.78 2070.64 2048.27 3709.88 4163.47
T empRight Auto M anual 2095.86 2862.75 3777.31 3671.92 2545.58 2917.52 2270.58 2525.93 1383.25 1179.59 3177.22 3064.12 2775.98 2883.06 2139.50 1977.98 2321.30 2616.19 2725.57 3142.38
M ean 1646.45 1617.83 2415.15 2490.33 2521.21 2684.14 StdError 39.18 38.28 69.82 84.17 65.31 68.70 Table 1. Table presenting doses comparison for large structures (whole brain, left and right temporal lobes).
Fig. 1. Automatic segmentation results for the following structures: temporal, frontal and occipital lobes, brain stem, cerebellum, ventricles, hypothalamus, chiasm, pituitary, eyes, optical nerves, thalamus and mesio temporal lobes. Results are shown for some representative subjects of the data set that show the type of abnormality we have encountered (resection, ventricles enlargement).
36 37 57 74 87 100 102 120 127 133
Hypothal Auto M anual 336.83 656.06 4230.72 2403.65 380.40 1171.56 473.82 812.45 192.73 215.26 1791.08 3152.75 309.67 686.15 291.72 421.45 354.28 587.92 4705.72 5825.93
Chiasm Auto M anual 481.08 824.30 4572.27 4141.34 600.06 1793.96 560.17 797.76 325.60 441.73 1128.66 1102.00 578.13 526.56 335.50 408.83 511.74 539.74 6076.51 6082.67
P ituitary Auto M anual 1845.28 2209.02 5372.85 5448.58 1980.84 1691.20 1529.34 1339.73 2398.14 1078.28 2390.55 3573.04 2650.73 3145.82 1275.12 630.76 2056.44 711.98 6073.06 6068.04
M ean 1306.69 1593.31 1516.97 1665.88 2757.23 2589.64 StdError 173.21 175.67 204.97 191.70 162.41 193.53 Table 2. Table presenting doses comparison for smaller structures (chiasm, hypothalamus and pituitary).
Fig. 2. Chart comparing average absorbed doses for each structure (brain, right temporal lobe, left temporal lobe, chiasm, hypothalamus, pituitary); Light gray: manual; Dark gray: automatic.
5
Discussion
The development of three-dimensional radiation therapy treatment planning permits a more accurate determination of dose to normal tissues structures. This information may be used to optimize treatment plans and evaluate normal tissue effects. The value of this information depends on the timely and accurate delineation of normal tissues for which dose-volume and treatment-effect correlations are known (Merchant [2]). Realizing the value of normal tissue dose-volume data has lagged behind the observed clinical improvements noted for patients treated with 3-dimensional treatment planning techniques. Contouring normal tissues in a systematic fashion is time consuming and falls between the responsibilities of physicians and dosimetry staff. The demands involved in the contouring of normal tissue structures depend on the site of treatment, the resolution and type of the treatment planning data sets and the objectives of the overall treatment plan. The objective of this study was to validate an automated atlas-based segmentation technique for treatment planning in children with infratentorial ependymoma. The results showed no significant difference between the manual and automated contours in terms of the integrated average dose. The best results were observed for the largest structures, brain and temporal lobes, which were found to have the smallest differences and variance in measurements. With the manual contour serving as the reference, the average difference between the au-
tomated and manual large structure contours was less than 10%. Temporal lobe contour variation can be attributed to the range of ages for the patients included in this study. The overall shape and size of the temporal lobes can be expected to vary among the youngest patients especially those who may have had a lengthy course of tumor-related hydrocephalus. We have shown in previous reports that larger structures have relatively good concordance when comparing manual and automated contours [10]. The greatest difference was noted for the smallest structures which were often located in the gradient of dose. Since these patients were treated focally to the posterior fossa using non-coplanar beam arrangements and often with the objective of avoiding the chiasm and hypothalamic-pituitary unit it is not surprising that they should fall in the gradient of dose and in most cases these structures received low doses. The largest variation was noted for the pituitary and hypothalamus which are anatomically connected. The pituitary is small and the hypothalamus is prone to displacement by the effects of hydrocephalus on the IIIrd ventricle. There is also a lack of contrast between these and surrounding structures, including the chiasm. The size of the structure should be considered in applying these techniques. The chiasm, hypothalamus and pituitary are very small and visible on very few images. Enhancing the delineation of these structures requires imaging studies performed with greater spatial resolution. The results from this study form the basis of an ongoing study involving 67 patients with infratentorial ependymoma to evaluate statistically automated and manual contouring as well as the clinical significance of any observed differences. We are in the process of modeling the effects of dose and volume on cognition, endocrine and neurologic effects. These models will provide a system in which to test automated contouring and the effects of any differences between automated and manual contours. Future studies will focus on other tumors with infratentorial location including medulloblastoma and patients with supratentorial tumors with limited distortion of anatomy due to tumor or surgery.
6
Acknowledgements
Pierre-Fran¸cois D’Haese is working towards a Ph.D. degree with awards from FRIA and FNRS (Belgian Science Foundation). Supported in part by grants from the National Institutes of Health NIH/NCI 1R21 CA89657-01A2, American Cancer Society RPG-99-25201CCE and the American Lebanese Syrian Associated Charities (ALSAC).
References 1. Merchant, T.E., Pritchard, D.L., Vargo, J.A., Sontag, M.R.: Radiation therapy for the treatment of childhood medulloblastoma: The rationale for current techniques, strategies, and dose-volume considerations. In: Electro Medica. Volume 69. (2001) pp. 69–71
2. Merchant, T.E., Goloubeva, O., Pritchard, D.L., Gaber, M.W., Xiong, X., Danish, R.K., Lustig, R.H.: Multimodality image registration by maximization of mutual information. In: Int J Radiat Oncol Biol Phys. Volume 52. (2002) pp. 1264–1270 3. Meyer, C.R., Boes, J.L., Kim, B., Bland, P.: Probabilistic brain atlas construction: Thin-plate spline warping via maximization of mutual information. In: LNCS: Proceedings of MICCAI ’99. Volume 1679. (1999) pp. 631–637 4. Rueckert, D., Sonoda, L.I., Hayes, C., Hill, D.L., Leach, M.O., Hawkes, D.J.: Nonrigid registration using free-form deformations: Application to breast mr images. In: IEEE Transactions on Medical Imaging. Volume 18. (1999) pp. 712–721 5. Dawant, B.M., Hartmann, S.L., Gadamsetty, S.: Brain atlas deformation in the presence of large space-occupying tumors. In: LNCS: Proceedings of MICCAI ’99. Volume 1679. (1999) pp. 589–596 6. Bach Cuadra, M., Gomez, J., Hagmann, P., Pollo, C., Villemure, J., Dawant, B.M., Thiran, J.P.: Atlas-based segmentation of pathological brains using a model of tumor growth. In: LNCS: Proceedings of MICCAI ’02. Volume 16. (2002) pp. 380–387 7. Merchant, T.E., Zhu, Y., Thompson, S.J., Sontag, M.R., Heideman, R.L., Kun, L.E.: Preliminary results from a phase II trial of conformal radiation therapy for pediatric patients with localized low-grade astrocytoma and ependymoma. In: Int J Radiat Oncol Biol Phys. Volume 52. (2002) pp. 325–332 8. Maes, F., Collignon, A.: Multimodality image registration by maximization of mutual information. In: IEEE Transactions on Medical Imaging. Volume 16. (1997) pp. 187–198 9. Rohde, G.K., Akram, A., Dawant, B.M.: The adaptive bases algorithm for intensity based nonrigid image registration. In: IEEE Transactions on Medical Imaging, (In press). (2003) 10. D’Haese, P.F., Duay, V., Li, R., du Bois d’Aische, A., Cmelak, A., Donnelly, E., Niermann, K., Merchant, E., Macq, B., Dawant, B.M.: Automatic segmentation of brain structures for radiation therapy planning. In: Medical Imaging 2003: Image Processing, Proceedings of the SPIE. Volume 5032. (2003) pp. 517–526