Accepted Article
MR. BJÖRN RULIK (Orcid ID : 0000-0002-2808-9305)
Article type
: Research Article
Handling editor: Dr. Douglas Yu
Using taxonomic consistency with semi-automated data preprocessing for high quality DNA barcodes
Short running title: Taxonomic consistency for high quality Barcodes
Björn Rulik1*, Jonas Eberle2*, Laura von der Mark1, Jana Thormann1, Manfred Jung3, Frank Köhler4, Wolfgang Apfel5, Andreas Weigel5, Andreas Kopetz5, Jonas Köhler6, Frank Fritzlar7, Matthias Hartmann5, Karl Hadulla8, Joachim Schmidt9, Thomas Hörren10, Detlef Krebs5, Florian Theves11, Ute Eulitz12, André Skale5, Dirk Rohwedder2, Andreas Kleeberg13, Jonas J. Astrin1, Matthias F. Geiger1, J. Wolfgang Wägele2, Peter Grobe2, Dirk Ahrens2*
* Correspondence authors. E-mail:
[email protected],
[email protected],
[email protected] 1
Zoologisches Forschungsmuseum Alexander Koenig, Zentrum für molekulare
Biodiversitätsforschung (zmb), Adenauerallee 160, D-53113 Bonn, Germany This article has been accepted for publication and undergone full peer review but has not been through the copyediting, typesetting, pagination and proofreading process, which may lead to differences between this version and the Version of Record. Please cite this article as doi: 10.1111/2041-210X.12824 This article is protected by copyright. All rights reserved.
Zoologisches Forschungsmuseum Alexander Koenig, Zentrum für Taxonomie und Evolution
Accepted Article
2
(ZTE), Adenauerallee 160, D-53113 Bonn, Germany 3
Hauptstraße 26a, D-38822 Athenstedt, Germany
4
Strombergstr. 22a, D- 53332 Bornheim, Germany
5
Naturkundemuseum Erfurt, Große Arche 14, D-99084 Erfurt, Germany
6
Rochusstraße 82, D-53123 Bonn, Germany
7
Kernbergstraße 73, D-07749 Jena, Germany
8
Oberstraße 51, D-53844 Troisdorf, Germany
9
Lindenstr. 3a, D–18211 Admannshagen, Germany
10
Meidericher Straße 47, D-45476 Mülheim an der Ruhr, Germany
11
Branderhofer Weg 103, D-52066 Aachen, Germany
12
c/o Senckenberg Naturhistorische Sammlungen Dresden, Museum für Tierkunde,
Königsbrücker Landstr. 159, D-01109 Dresden, Germany 13
Zum Alten Windmühlenberg 26, D-12524 Berlin, Germany
Abstract 1. In recent years, large-scale DNA barcoding campaigns have generated an enormous amount of COI barcodes, which are usually stored in NCBI's GenBank and the official Barcode of Life database (BOLD). BOLD data are generally associated with more detailed and better curated meta-data, because a great proportion is based on expertverified and vouchered material, accessible in public collections. In the course of the initiative German Barcode of Life (GBOL), data were generated for the reference library of 2,846 species of Coleoptera from 13,516 individuals.
This article is protected by copyright. All rights reserved.
Accepted Article
2. Confronted with the high effort associated with the identification, verification and data validation, a bioinformatic pipeline, "TaxCI" was developed that i) identifies taxonomic inconsistencies in a given tree topology (optionally including a reference data set), ii) discriminates between different cases of incongruence in order to identify contamination or misidentified specimens, iii) graphically marks those cases in the tree, which finally can be checked again and, if needed, corrected or removed from the dataset. For this, "TaxCI" may use DNA-based species delimitations from other approaches (e.g., mPTP) or may perform implemented threshold-based clustering. 3. The data-processing pipeline was tested on a newly generated set of barcodes, using the available BOLD records as a reference. A data revision based on the first run of the TaxCI tool resulted in the second TaxCI analysis in a taxonomic match ratio very similar to the one recorded from the reference set (92 vs 94%). The revised dataset improved by nearly 20% through this procedure compared to the original, uncorrected one. 4.
Overall, the new processing pipeline for DNA barcode data allows for the rapid and easy identification of inconsistencies in large datasets, which can be dealt with before submitting them to public data repositories like BOLD or GenBank. Ultimately, this will increase the quality of submitted data and the speed of data submission, while primarily avoiding the deterioration of the accuracy of the data repositories due to ambiguously identified or contaminated specimens.
Keywords: DNA barcoding, GBOL, Germany, species identification, reference library, data quality, Coleoptera
This article is protected by copyright. All rights reserved.
Accepted Article
Introduction
DNA barcoding can provide an efficient tool for rapid biodiversity assessments, because
it meets needs for rapid and reproducible specimen identification in the era of massive habitat destruction, biodiversity loss, and climate change (Hebert & Gregory 2005; Valentini, Pompanon & Taberlet 2009). Despite some well-known shortcomings (Funk & Omland 2003; Ballard & Whitlock 2004; Hebert & Gregory 2005; Dowton et al. 2014; Ross 2014), barcoding is currently possibly the fastest and most straightforward way to assess the vast diversity of organisms such as invertebrates, which play a crucial role in ecosystem function, but are often poorly known taxonomically (Hebert & Gregory 2005). Using standardized genetic markers in DNA barcoding allows connecting the identities of different life stages such as eggs, larvae or adults – often a major difficulty in morphology-based taxonomy (e.g., Ahrens, Monaghan & Vogler 2007; Šipek & Ahrens 2011; García-Robledo et al. 2013; Freitag 2013; Etzler et al. 2014). Barcoding has been successfully applied to a vast number of taxa in many different geographic regions (www.boldsystems.org). It has become obvious that validated, comprehensive species libraries are the most fundamental basis for optimal barcode-based taxon identification (Kvist 2013). Since the early days of DNA barcoding, barcodes have also been used for direct estimation of species boundaries (Templeton 2001; Pons et al. 2006; Meier et al. 2006; Puillandre et al. 2012; Ratnasingham & Hebert 2013; Zhang et al. 2013; Carstens et al. 2013). Most of these methods attempt to infer species boundaries from the discontinuum between intraspecific and interspecific sequence variation, either visible as a 'barcode gap', or as a shift in branching rates (GMYC) or number of substitutions per branch (PTP). Therefore, barcode reference libraries should cover the genetic variation within species as comprehensive as possible. Bergsten et al. (2012) revealed
This article is protected by copyright. All rights reserved.
Accepted Article
increasing difficulties in specimen determination using DNA barcodes when scaling up the geographic scope from local or regional to continental focus. They found that in diving beetles (Dytiscidae) a minimum of 70 specimens needs to be analysed per species to sample 95% of its intraspecific variation. Consequently, building a proper barcode reference library that sufficiently reflects intraspecific variation and is thus able to correctly detect species boundaries is expected to be an elaborate procedure. Completing existing barcode libraries and uploading larger datasets to the Barcode of Life Database (BOLD) can be challenging, particularly when a vast amount of barcode data already exists in public libraries. It is important to make sure that the newly submitted data match the existing data in order to avoid taxonomic confusion. Among different sources for inconsistencies, most likely are specimen misidentifications, altering nomenclature or misspellings, contaminations (with admixed alien DNA), sample confusion, or low-quality sequences. Especially in very diverse groups, checking big data (several thousand barcodes) requires major efforts. Recently, the Barcode Index Number (BIN) System, a DNA-based registry for all animal species (Ratnasingham & Hebert 2013), has been implemented within BOLD which helps to detect taxonomic inconsistencies. However, once the data are imported into BOLD, the effort to revise and correct them online is higher than having done this beforehand and on user's personal system. Depositing only high-quality sequences correctly annotated with correct species names in BOLD would be the "golden standard" and is crucial for keeping the global barcode library functional and reliable (Collins & Cruickshank 2013). A variety of tools for quality assessment of specimen's taxonomy already exist. Some
approaches do their taxonomy assessment based on threshold clustering (Kõljalg et al. 2005, 2013; Meier et al. 2006; Ratnasingham and Hebert 2007, 2013). Others detect inconsistencies (of
This article is protected by copyright. All rights reserved.
Accepted Article
node or terminal labels) based on tree topology alone (McDonald et al. 2012; Kozlov et al. 2016). In both latter approaches the species boundaries are not inferred from the sequencing data, but are defined by the user in form of terminal node annotations, and used as a topological constraint. However, generally a consistent and straightforward automated flagging and filtering for problematic or inconsistent cases, which is useful for fast processing large amount of data, is missing yet. Therefore, and based on the previously successful use of taxonomic consistency in
different phylogenetic studies to uncover conflicts between classification and phylogenetic tree topology (Ahrens & Vogler 2008; Hunt & Vogler 2008; Quicke et al. 2012), an R-package (TaxCI) was developed that helps to check data for inconsistencies before submission to BOLD. Optionally, the data check can be done with reference data from BOLD, in order to
increase data quality and to detect problems with the new barcodes in a semi-automatic manner. This analysis pipeline was used to assist the publication of a second (see Hendrich et al. 2015) very large set of barcodes of beetles (Coleoptera) in Germany and central Europe that was created during the ‘German Barcode of Life (GBOL)’ project, comprising nearly 2,900 species and more than 13,000 specimens.
Material and Methods
Sampling, sequencing and deposition Sampling organized with the help of the GBOL web portal (https://www.bolgermany.de; Geiger et al. 2016), voucher treatment, and the taxonomy used (see Supplement File 5) were similar to
This article is protected by copyright. All rights reserved.
Accepted Article
Hendrich et al. (2015). DNA extraction, polymerase chain reaction and sequencing followed standard protocols (Astrin et al. 2016) and are described together with the newly developed specific primers in detail in Supplement File 5. All data are deposited in BOLD (http://dx.doi.org/10.5883/GCOLZFMK) and GenBank (accession numbers KU906118 KU919633) respectively.
Data analysis Our newly generated barcode data were counterchecked for taxonomic consistency
against a reference data set. As a reference a first larger data set of German Coleoptera barcodes (3,514 species, 15,948 individuals) was used (Hendrich et al. 2015). Since the reference contained many short sequences (< 500 bp), tree searches were performed using five different data sets (Table 1) with FastTree 2 (Price, Dehal, & Arkin 2010): 1) newly generated data only, 2) all reference data, 3) reference data including only sequences longer than 500 bp, 4) combined new data and reference data including all sequences, and 5) combined new data and reference data including only sequences longer than 500 bp. Analyses were conducted on each full set of data (sets 1 to 5) and on separate families except for the monotypic Myxophagan family Sphaeriusidae (species poor families were combined with others in regard to their systematic position; Supplement Table 2). Tree searches used the GTR+CAT model. Midpoint rooting was applied before further processing using the R-packages phangorn (Schliep 2011) and ape (Paradis, Claude & Strimmer 2004). In order to pinpoint misidentifications, contaminations, mislabelling, but also potential
cases of introgression, incomplete lineage sorting and instances of polyphyly, the phylogenetic
This article is protected by copyright. All rights reserved.
Accepted Article
trees obtained were used as phylogenetic backbone to investigate the consistency of the barcoded species, i.e., the monophyly of a priori assigned morphospecies. In a second step, a distancebased clustering was used as implemented in the R-package spider (v.1.3.0.; Brown et al. 2012) to gain further evidence for conspecificity or even stronger genetic differentiation (i.e., cryptic diversity). These procedures were implemented in a new R-package ‘TaxCI’ which is open‐source
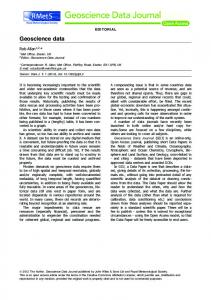
and freely available at https://github.com/eberlejonas/TaxCI. This newly developed analysis tool had as input i) a rooted dendrogram (FastTree tree), ii) the underlying DNA sequence alignment (PHYLIP format), and iii) a data sheet linking the dendrogram’s tip-labels to the a priori given taxonomic information (i.e., assignment of family, genus and species). Based on the input tree topology and five consecutive evaluation steps, a penalty score for all specimens is returned that marks potentially misidentified or contaminated samples (Fig. 2): Step 1), the topology of the dendrogram is analysed with reference to monophyly of the a
priori identified species. In analogy to the examination of homoplasy in morphological characters, the membership to a certain a priori identified species was coded as trait state "1" instead of trait state "0". The consistency index (Kluge & Farris 1969) explores the degree of homoplasy of a trait (or here, of an a priori defined species), and is thus a good expression of "how polyphyletic" a species is in a given tree. All individuals of a given species not grouped as monophylum are marked and assigned with a tci penalty score. They also get highlighted during this step (Figs. 3, 4; 1st box), also those residing in a taxonomically and homogeneously composed clade. Members of the respective species within a heterogeneous cluster get an additional mark in the second step (2nd box). An approach similar to this step was used recently to detect non-monophyly in phylogenetic trees and to ascertain the incidence of species non-
This article is protected by copyright. All rights reserved.
Accepted Article
monophyly in COI barcode sequences (Mutanen et al. 2016). Although species monophyly is not a stringent criterion of species validity (Zhang et al. 2011), it has been widely shown that most species are monophyletic at least for the barcode gene COI (e.g., Funk & Omland 2003; Ross 2014; Mutanen et al. 2016). Step 2), the TaxCI package uses the function localMinima from the R package spider
(Brown et al. 2012) and derives a distance threshold (choice of evolutionary model for distance calculation selectable; here used the default option: K80) from the aligned sequence data for clustering. The actual value corresponds to the first dip in the density of pairwise distances and indicates the transition between intra- and inter-specific distances following the general concept of the barcoding gap. The newly derived clusters are then analysed for their a priori defined taxonomic composition, and all individuals within a cluster of mixed species are highlighted (2nd box). The function also detects species not conspicuous during the first step, e.g., if they form a monophylum in the backbone tree, which is part of a heterogeneous distance-based cluster (Figs 3, 4). As an alternative to barcode clustering with spider, users can supply their own, externally obtained clusters (see package documentation for details). A function for directly parsing output files of the species delimitation program mPTP (v0.2.1, Kapli et al. 2016) is implemented in TaxCI. Step 3), all individuals within a heterospecific cluster are tagged if – and only if – there
are other individuals of this species in at least one additional cluster (3rd box). All individuals marked during step two get also marked in the 3rd box, if this condition is fulfilled. Step 4) calculates the relative abundance of a nominal a priori identified species in a
heterogeneous cluster as proportion of its individuals relative to the total number of specimens in this cluster. If a particular species has a lower relative abundance than any of the other species in
This article is protected by copyright. All rights reserved.
Accepted Article
the mixed cluster, all its individuals are tagged in the 4th box (Fig. 3). A penalty score of 1–RA (RA - relative abundance of the species) is assigned. This step might be helpful to infer which of the specimens might be contaminants or wrongly identified. Step 5), all individuals of a species in a homogeneous cluster with members in at least
one other homogeneous cluster are marked in the 5th box. This step might indicate wrong identifications but also cryptic diversity. All results for the specimens that were found to be conspicuous in any of the five steps
are written into a text file table along with a penalty score based on the above five steps. For each analysis,
we
estimated
additionally
a
match
ratio
(Ahrens
et
al.
2016):
MR=2∗Nmatch/(Ncluster+Nmorph), where Nmatch is the number of species with exact matches, that is all specimens of one morphospecies (and only these) belong to one cluster entity, and Ncluster and Nmorph are the number of clusters and morphospecies). The initially loaded dendrogram is plotted as text-searchable PDF file (without length limitations), now enriched with the details of the taxonomic congruence checks (Boxes 1–5). Thus, the modified tree file can easily be inspected visually on any computer and decoupled from the analysis platform. This is an important aspect for involving external collaborators or multiple project partners during the validation of taxon identifications. The output of the TaxCI analysis was used to re-inspect the affected specimens, to correct the species ID data, or to exclude specimens (temporally for further revision of ID, or definitively, in case of contaminations). Finally, the TaxCI analysis was run again with the cleaned data set to assess the level of improvement in congruence.
This article is protected by copyright. All rights reserved.
Accepted Article
Results A full-length DNA barcode (658 bp) was obtained from 99.4% of the 14,330 specimens
from a priori identified species representing 102 of the 103 beetle families known from Germany. The remaining 0.6% of sequences are between 657 and 557 base pairs. In the initial phylogenetic analysis and subsequent TaxCI run all 14,330 specimens were included representing 2,970 a priori defined species of 102 families. Based on poor TaxCI results we removed 120 species in 814 specimens from the BOLD submission pipeline, of which six specimens proved to be contaminations, three specimens had typing errors in their names, while 804 specimens were preliminary excluded to verify once again carefully the identification by a taxonomic specialist. In 32 cases taxonomic inconsistencies were found due to changes in nomenclature since 2012 (in these cases only the metadata file for Tax CI analysis was corrected, but not the terminal name in the tree; see supplement file 1 for reference of taxon nomenclature in 2012 vs. 2015). In 67 cases a taxonomic inconsistency was detected in the reference data (i.e., Hendrich et al. 2015). 579 specimens were kept in the new dataset despite problems with taxonomic consistency as data do not allow for rejection of the sample as in the above cases (potential cases of introgression, incomplete lineage sorting, cryptic diversity). These cases require further research, ideally based on an integrative taxonomy toolset, in some cases possibly even resulting in comprehensive taxonomic revisions. In total, 13,516 specimens in 2,846 species were added to the BOLD library, which now includes > 4,000 species of beetles occurring in Germany. The TaxCI run 1 detected, among the newly generated data of 2,978 morphospecies,
more than 23% of the species (n = 703) that were affected by taxonomic inconsistencies (Table 1). This percentage was reduced through dataset pruning and metadata (ID label) correction in
This article is protected by copyright. All rights reserved.
Accepted Article
the second TaxCI run to only 1.5% of the species. Accordingly, the number of homogeneous clusters increased by nearly 300 while the heterogeneous clusters dropped by more than 400. The overall match ratio increased from 0.73 (1st run) to 0.94. The same applies to the combined data, where the match ratio improved from 0.74 to 0.92. Most of the remaining taxonomic inconsistency can be ascribed to deep genetic differentiation. The numbers of species in multiple homogeneous genetic clusters remained relatively high (644 vs. 375), and increased particularly with the combination of the sampling of the reference and new data (n = 567). This must be either attributed to cryptic diversity and stronger divergence between populations due to historical isolation (e.g., in glacial refugia) or to possibly inaccurate clustering threshold and/or missing barcoding gap and/or sensitivity to the taxon sampling. The number of resulting distance-based clusters is not comparable between the full and
single family analyses, as the derived threshold for the different families differs strongly (Table 1, Supplement Table 2). Therefore, different total numbers of clusters between both approaches were found (4621 vs. 4494 for full and family analysis (2nd run), respectively). Nevertheless, match ratios were improved for nearly all families in the 2nd run as well (Supplement Table 2). According to the BOLD BIN report, our data set contained 337 globally new BINs (with
716 specimens), while 2,758 BINs were already present in the BOLD system (comprising 12,796 specimens from our new dataset and a total of 53,874 specimens) (see Supplement Table 1). A detailed overview of the resulting BINs, trees and taxonomic inconsistencies is given in Supplement Table 1 and Supplement Files 1 and 2.
Discussion
This article is protected by copyright. All rights reserved.
Accepted Article
According to the widely accepted generalized lineage concept (GLC; de Queiroz 1998, 2005, 2007), which is now commonly applied in DNA-based and integrative species delimitation (O'Meara et al. 2006; Knowles & Carstens 2007; Ence & Carstens 2011; Carstens et al. 2013; Yang & Rannala 2010, 2014; Camargo et al. 2012; Edwards & Knowles 2014; Jones, Aydin & Oxelman 2015; Jones 2015), monophyly is not an essential prerequisite for a valid species. However, since a monophyletic species is with a certain probability also more likely a valid species (e.g., Kizirian & Donnelly 2004), this criterion was used to explore our data for inconsistencies. Therefore, the topology of the obtained gene tree was analysed with reference to the degree of monophyly of the a priori identified species (step 1 of our pipeline). Species detected during this step are non-monophyletic. This can be caused by several natural phenomena (e.g., hybridization, incomplete lineage sorting) but can arise – as an artefact – also from human errors within the barcoding pipeline (e.g., contamination or misidentification of a sample). What is not detected in step 1 are a) contaminated or misidentified singletons, b) entire monophyla that appear as sister group of another clade within a cluster (Figure 3J, taxon "E"), or c) specimens that mirror cryptic diversity (Fig. 3M). The use of a simple distance-based clustering in the steps following the monophyly
assessment is because this pipeline was designed for extremely large datasets with thousands of specimens. Methodologically more appropriate methods like statistical parsimony analysis (Templeton 2001), Poisson tree process modelling (Zhang et al. 2013), and General Mixed Yule Coalescent modelling (Pons et al. 2006) could potentially replace the distance-based clustering as they might be more accurate and also more appropriate since they follow a defined species concept (i.e., phylogenetic species concept). However, they are computationally much more demanding and thus time-consuming. As our approach is intended for data pre-processing, we
This article is protected by copyright. All rights reserved.
Accepted Article
opted for speed rather than accuracy, and implemented a distance clustering approach as default option. However, alternative species delimitations obtained from external programs can easily be implemented as they get more scalable like the recently developed mPTP (Kapli et al. 2016). The indication of the presence of additional specimens (step 2 and 3) and their abundance
(step 4) in another cluster may help to decide whether there is a case of contamination and which of the specimens are affected by contamination, mislabelling, or misidentification. This latter step is especially helpful to find misidentified singletons. The final analysis step (step 5) indicates those potential misidentifications that have gone unnoticed through steps 1-4 or that might be used as indicators for cryptic diversity or strong mtDNA differentiation among populations. Thus, the output from step 5 will be especially valuable for future studies to explore additional evidence on these observed patterns of differentiation. Data quality, i.e., the match ratio of morphospecies vs. barcode clusters, greatly improved
with the fast screening and the subsequent revision of the data and IDs from roughly 73 and 74% to 94 and 92% for our new data and all German beetle barcodes, respectively. This is a significant improvement considering that the taxonomic consistency of the reference data was also 94%. Using multi-rate poison tree processing as external method with TaxCI resulting in a lower match ratio of 88% and 87% accompanied with lower amount of homogeneous clusters, but with more heterogeneous clusters than in our standard approach (Table 1). Mainly well separated singletons were lumped by the mPTP clustering method (Supplement File 1 & 5). The inclusion of the reference dataset helped to find more taxonomic problems, which
would remain undetected with the new dataset alone. This is especially true for wrongly identified or contaminated singletons. Starting with initial 829 singletons in our BNall dataset, only 316 remained still as singletons after check with reference data, while 379 singleton cases
This article is protected by copyright. All rights reserved.
Accepted Article
were solved. However, 134 of the former singletons were now tci positive in the combined analysis. Only the analysis of entire data set will reveal potential contaminations across family levels, because such specimens as far as in homogenous clusters will not be noticed in the family analysis alone (1059 less tci positives in the family analysis compared to the combined analysis). Family trees are suited for inspection by external collaborators. Given the opportunity to perform these quality assessments on-site within 24 hours allows for a proper and timely data curation by the data provider itself. Tools of quality assessment of specimen's taxonomy do already exist in UNITE (Kõljalg et al. 2005, 2013; https://unite.ut.ee/index.php), in SpeciesIdentifier (Meier et al. 2006), and in the BOLD systems (Ratnasingham & Hebert 2007; http://www.boldsystems.org). Taxonomy assessments in these are exclusively based on threshold clusters, while monophyly and taxonomic consistency beyond clusters is not considered in detail. A flagging of problematic specimens is performed only in BOLD systems. Furthermore, other tools with similar tasks so far used for microorganisms exist (McDonald et al. 2012; Kozlov et al. 2016). The Tax2tree approach (McDonald et al. 2012) refers to topological constraints and does not implement the inference of species boundaries (e.g., by threshold clustering) as it was designed to transfer an existing taxonomy to newly generated sequences rather than critically checking species assignments of different sources of data critically against each other. SATIVA (Kozlov et al. 2016) detects inconsistencies (of node or terminal labels) based on the tree topology (i.e., taxon monophyly) considering various classification levels (except species) based on arbitrary threshold clustering, as species level often lacking in metadata annotations of Cyanobacteria. In both approaches the species boundary is taken as topological constraint given of terminals in relation to tree topology, rather than an inference of such a limit from the sequence data, and thus
This article is protected by copyright. All rights reserved.
Accepted Article
lacking the possibility to infer "cryptic diversity". In all cases an automated straightforward highthroughput filtering for problematic or inconsistent cases, which is useful for large amount of data, is not yet performed. BIN assignments from the BOLD system, similarly able to help with data quality assessment (in terms of correct species name assignments), generally have a turnaround time of several weeks. Furthermore, data curation – once uploaded to BOLD – requires additional work from submitters and data curators. Another advantage of our TaxCI analysis pipeline lies in its capacity to produce tree files
in a PDF format that is text-searchable and without page limitation, a feature that is lacking or only fragmentarily available in most above mentioned approaches. Even most current standalone tree editing programs do not allow this or have strong limitations for tree length. In the form of such portable files, readable on any desktop computer and also by in terms of molecular systematics untrained taxonomists or citizen scientists, they represent the most valuable linking element for using barcodes. This increases the acceptance and audience for these approaches and issues linked with the data (e.g., taxonomical problems, inconsistencies). Finally, TaxCI offers a more complex output for different ways of data control (numerical, graphical) which allows an either automatized and computer-based but also manual/ visual data inspection.
Conclusions The presented analysis pipeline for a semi-automatic data quality assessment and check,
with subsequent revision and re-check, may provide a helpful tool when processing large to very large datasets that can be handled manually only with great difficulty and considerable time
This article is protected by copyright. All rights reserved.
Accepted Article
investment. While several so far existing tools or web portals offer partly similar functions, our pipeline combines in efficient way the presentation of data (tree output) with useful flagging of problematic samples, high data throughput, and the complex aspects of Molecular Operational Taxonomic Unit (MOTU) capture relying on tree based species delimitation as well as on fast clustering with distance-based algorithms. TaxCI will prove to be a useful tool that helps to generate at forehand high quality barcode data that keep away high correction workload from large reference databases, like BOLD systems, and to bring more people towards an integrative taxonomy where barcode data play a crucial role in biodiversity research, but also, where traditional taxonomy is deeply involved in biodiversity exploration.
Acknowledgments This project was funded by the German Federal Ministry of Education and Research
(work package GBOL1; FKZ: 01LI1101A / 01LI1501A). We are thankful to various students, who helped process the beetle specimens in our barcode pipeline. We are thankful also to the following colleagues who helped to complete the specimen library with additional samples: J. Beller, R. Bellstedt, R. Buchbach, H. Bußler, S. Chapuis, I. Brunk, C. Fehse, B. Feldmann, L. Friman, K.-H. Grübel, G. Haas, C. Herbig, O. Jäger, T. Klug, M. Koch, C. Morkel, M. Niehuis, H.-P. Reike, E. Rößner, and A. Schäfer. Finally, we are thankful to M. Balke, L. Hendrich, and J. Morinière who inspired us for this paper. Our colleague J. Decher kindly checked and improved the English in this paper. We thank the two anonymous referees for their helpful comments on the manuscript. The 1KITE project (1KITE consortium: www.1kite.org) kindly provided access
This article is protected by copyright. All rights reserved.
Accepted Article
to mitogenome data for hundreds of samples that greatly helped in designing the new degenerate primers LCO1490-JJ3 and HCO2198-JJ3.
Data Accessibility Sequence data analysed in this paper are available at BOLD (https://dx.doi.org/10.5883/DSGCOLZFMK and at GenBank (accession numbers: KU906118 - KU919633). The code used in this paper is available on Github at https://github.com/eberlejonas/TaxCI.
Author contributions D.A., J.E., & B.R. designed this study; B.R. led project administration and data curation together with D.A., M.F.G., P.G., L.M. & J.T.; D.A., W.A., J.E., U.E., F.F., K.H., M.H., T.H., M.J., A.K., A.K., D.K., J.K., F.K, A.S., B.R., D.R J.S., F.T. & A.W. collected / identified samples and provided meta-data; L.M. & J.T. conducted laboratory work; J.E. programmed TaxCI; J.E. & B.R. improved part of code and tested all scripts with the different data sets; D.A., J.E., M.F.G. & B.R. compiled the data and conducted the data analyses; D.A., J.J.A., J.E., M.F.G., B.R. & J.W.W. drafted the manuscript; All authors contributed critically to the MS draft and gave final approval for publication.
References Ahrens, D., Monaghan, M.T. & Vogler, A.P. (2007) DNA-based taxonomy for associating adults and larvae in multi-species assemblages of chafers (Coleoptera: Scarabaeidae). Molecular Phylogenetics and Evolution, 44, 436-449.
This article is protected by copyright. All rights reserved.
Accepted Article
Ahrens, D. & Vogler, A.P. (2008) Towards the phylogeny of chafers (Sericini): analysis of alignment-variable sequences and the evolution of segment numbers in the antennal club. Molecular Phylogenetics and Evolution, 47, 783-798.
Ahrens, D., Fujisawa, T., Krammer, H.-J., Eberle, J., Fabrizi, S. & Vogler A.P. (2016) Rarity and Incomplete Sampling in DNA-based Species Delimitation. Systematic Biology, 65, 478494.
Astrin J.J., Höfer H., Spelda J., Holstein J., Bayer S., Hendrich L., Huber, B.A., Kielhorn, K.H., Krammer, H.J., Lemke, M., Monje, J.C., Morinière, J., Rulik, B., Petersen, M., Janssen, H., & Muster, C. (2016) Towards a DNA Barcode Reference Database for Spiders and Harvestmen of Germany. PLoS ONE 11(9), e0162624. doi:10.1371/journal.pone.0162624
Ballard, J.W. & Whitlock, M.C. (2004) The incomplete natural history of mitochondria. Molecular Ecology, 13(4), 729-744.
Blagoev, G.A., deWaard, J.R., Ratnasingham, S., deWaard, S.L., Lu, L., Robertson, J., Telfer, A.C. & Hebert, P.D.N. (2016) Untangling taxonomy: a DNA barcode reference library for Canadian spiders. Molecular Ecology Resources, 16, 325-341.
Bergsten, J., Bilton, D.T., Fujisawa, T., Elliott, M., Monaghan, M.T., Balke, M., Hendrich, L., Geijer, J., Herrmann, J., Foster, G.N., Ribera, I., Nilsson, A.N., Barraclough, T.G. & Vogler, A.P. (2012) The Effect of Geographical Scale of Sampling on DNA Barcoding. Systematic Biology, 61(5), 851-869. doi: 10.1093/sysbio/sys037
Brown, S.D.J., Collins, R.A., Boyer, S., Lefort, M.-C., Malumbres-Olarte, J., Vink, C. J. & Cruickshank, R.H. (2012) SPIDER: an R package for the analysis of species identity and
This article is protected by copyright. All rights reserved.
Accepted Article
evolution with particular reference to DNA barcoding. Molecular Ecology Resources, 12, 562-565.
Camargo, A., Morando, M., Avila, L.J. & Sites, J.W. Jr. (2012) Species delimitation with ABC and other coalescent-based methods: a test of accuracy with simulations and an empirical example with lizards of the Liolaemus darwinii complex (Squamata: Liolaemidae). Evolution, 66(9), 2834-2849.
Carstens, B.C., Pelletier, T.A., Reid, N.M. & Satler, J.D. (2013) How to fail at species delimitation. Molecular Ecology, 22(17), 4369-4383.
Collins, R. A. & Cruickshank, R. H. (2013) The seven deadly sins of DNA barcoding. Molecular Ecology Resources, 13, 969-975. doi: 10.1111/1755-0998.12046
de Queiroz, K. (1998) The general lineage concept of species, species criteria, and the process of speciation. Endless Forms: Species and Speciation (Howard SJ BS ed). Oxford University Press, New York.
de Queiroz, K. (2005) Ernst Mayr and the modern concept of species. Proceedings of the National Academy of Sciences USA, 102, 6600-6607.
de Queiroz, K. (2007) Species concepts and species delimitation. Systematic Biology, 56(6), 879886.
Dowton, M., Meiklejohn, K., Cameron, S.L. & Wallman, J. (2014) A Preliminary Framework for DNA Barcoding, Incorporating the Multispecies Coalescent. Systematic Biology, 63, 639644.
Edwards, D.L. & Knowles, L.L. (2014) Species detection and individual assignment in species delimitation: Can integrative data increase efficacy? Proceedings of the Royal Society B, 281, 20132765
This article is protected by copyright. All rights reserved.
Accepted Article
Ence, D.D. & Carstens, B.C. (2011) SpedeSTEM: a rapid and accurate method for species delimitation. Molecular Ecology Resources, 11(3), 473-480.
Etzler, F.E., Wanner, K.W., Morales-Rodriguez, A. & Ivie, M.A. (2014) DNA Barcoding to Improve the Species-Level Management of Wireworms (Coleoptera: Elateridae). Journal of Economic Entomology, 107, 1476-1485.
Freitag, H. (2013) Ancyronyx Erichson, 1847 (Coleoptera, Elmidae) from Mindoro, Philippines, with description of the larvae and two new species using DNA sequences for the assignment of the developmental stages. ZooKeys, 321, 35-64.
Funk, D.J. & Omland, K.E. (2003). Species-level paraphyly and polyphyly: frequency, causes, and consequences, with insights from animal mitochondrial DNA. Annual Review of Ecology, Evolution, and Systematics, 34, 397-423.
García-Robledo, C., Kuprewicz, E.K., Staines, C.L., Kress, W.J. & Erwin, T.L. (2013) Using a comprehensive DNA barcode library to detect novel egg and larval host plant associations in a Cephaloleia rolled-leaf beetle (Coleoptera: Chrysomelidae). Biological Journal of the Linnean Society, 110, 189-198.
Geiger, M.F.G., Astrin, J.J., Borsch, T., Burkhardt, U., Grobe, P., Hand, R., Hausmann, A., Hohberg, K., Krogmann, L., Lutz, M., Monje, C., Misof, B., Morinière, J., Müller, K.F., Pietsch, S., Quandt, D., Rulik, B., Scholler, M., Traunspurger, W., Haszprunar, G. & Wägele, W. (2016) How to tackle the molecular species inventory for an industrialized nation – lessons from the first phase of the German Barcode of Life initiative GBOL (2012-2015). Genome, 59(9): 661-670. doi: 10.1139/gen-2015-0185
Hebert, P.D.N. & Gregory, T.R. (2005) The promise of DNA barcoding for taxonomy. Systematic Biology, 54, 852-859.
This article is protected by copyright. All rights reserved.
Accepted Article
Hendrich, L., Morinière, J., Haszprunar, G., Hebert, P.D.N., Hausmann, A., Köhler, F. & Balke, M. (2015) A comprehensive DNA barcode database for Central European beetles with a focus on Germany: Adding more than 3,500 identified species to BOLD. Molecular Ecology Resources, 15, 795-818.
Hunt, T. & Vogler, A.P. (2008) A protocol for large-scale rRNA sequence analysis: towards a detailed phylogeny of Coleoptera. Molecular Phylogenetics and Evolution, 47, 289–301.
Jones, G (2015) Species delimitation and phylogeny estimation under the multispecies coalescent. bioRxiv, http://dx.doi.org/10.1101/010199 [accessed 1 March 2016]
Jones, G., Aydin, Z. & Oxelman, B. (2015) DISSECT: an assignment-free Bayesian discovery method for species delimitation under the multispecies coalescent. Bioinformatics, 31(7), 991-998.
Kapli, P., Lutteropp, S., Zhang, J., Kobert, K., Pavlidis, P., Stamatakis, A. & Flouri, T.T. (2016) Multi-rate Poisson Tree Processes for single-locus species delimitation under Maximum Likelihood and Markov Chain Monte Carlo. bioRxiv, 063875. https://doi.org/10.1093/bioinformatics/btx025
Kizirian, D. & Donnelly, M. A. (2004) The criterion of reciprocal monophyly and classification of nested diversity at the species level. Molecular Phylogenetics and Evolution; 32, 10721076.
Kluge, A. G. & Farris, J. S. (1969) Quantitative phyletics and the evolution of anurans. Systematic Zoology, 18, 1-32.
Knowles, L.L. & Carstens, B.C. (2007) Delimiting species without monophyletic gene trees. Systematic Biology, 56(6), 887-895.
This article is protected by copyright. All rights reserved.
Accepted Article
Köhler, F. & Klausnitzer, B. (1998) Verzeichnis der Käfer Deutschlands. Entomologische Nachrichten und Berichte Supplement, 4, 1-185.
Kõljalg, U., Larsson, K.-H., Abarenkov, K., Nilsson, R.H., Alexander, I.J., Eberhardt, U., Erland, S., Høiland, K., Kjøller, R., Larsson, E., Pennanen, T., Sen, R., Taylor, A.F.S., Tedersoo, L., Vrålstad, T. & Ursing, B.M. (2005) UNITE: a database providing web-based methods for the molecular identification of ectomycorrhizal fungi. New Phytologist, 166, 10631068.
Kõljalg, U., Nilsson, R.H., Abarenkov, K., Tedersoo, L., Taylor, A.F.S., Bahram, M., Bates, S.T., Bruns, T.D., Bengtsson-Palme, J., Callaghan, T.M., Douglas, B., Drenkhan, T., Eberhardt, U., Dueñas, M., Grebenc, T., Griffith, G.W., Hartmann, M., Kirk, P.M., Kohout, P., Larsson, E., Lindahl, B.D.
cking, R., Martín, M.P., Matheny, P.B.,
Nguyen, N.H., Niskanen, T., Oja, J., Peay, K.G., Peintner, U., Peterson, M., Põldmaa, K., Saag, L., Saar, I.
ch
ler, A., Scott, J.A., Senés, C., Smith, M.E., Suija, A., Taylor,
D.L., Telleria, M.T., Weiß, M. & Larsson, K.-H. (2013) Towards a unified paradigm for sequence-based identification of Fungi. Molecular Ecology, 22, 5271-5277.
Kozlov, A.M., Zhang, J., Yilmaz, P., Glöckner, F.O. & Stamatakis, A. (2016) Phylogeny-aware identification and correction of taxonomically mislabeled sequences. Nucleic Acids Research, 2016 doi: 10.1093/nar/gkw396
Kvist, S. (2013) Barcoding in the dark?: a critical view of the sufficiency of zoological DNA barcoding databases and a plea for broader integration of taxonomic knowledge. Molecular Phylogenetics and Evolution, 69, 39-45.
Löbl, I. & Smetana, A. (2003-2011) Catalogue of Palaearctic Coleoptera. Vol. 1-7. Apollo Books, Kopenhagen.
This article is protected by copyright. All rights reserved.
Accepted Article
McDonald, D., Price, M.N., Goodrich, J., Nawrocki, E.P., DeSantis, T.Z., Probst, A., Andersen, G.L., Knight, R. & Hugenholtz, P. (2012) An improved Greengenes taxonomy with explicit ranks for ecological and evolutionary analyses of bacteria and archaea. The International Society for Microbial Ecology Journal, 6, 610-618.
Meier, R., Shiyang, K., Vaidya, G. & Ng, P.K.L. (2006) DNA Barcoding and taxonomy in Diptera: A tale of high intraspecific variability and low identification success. Systematic Biology, 55, 715-728.
Mutanen, M., Kivel, S.M., Vos, R.A., Doorenweerd, C., Ratnasingham, S., Hausmann, A., Huemer P. Dincă V. Nieukerken E.J. van
opez-Vaamonde, C., Vila, R., Aarvik, L.,
Decaens, T., Efetov, K.A., Hebert, P.D.N., Johnsen, A., Karsholt, O., Pentinsaari, M., Rougerie, R., Segerer, A., Tarmann, G., Zahiri, R. & Godfray, H.C.J. (2016) SpeciesLevel Para- and Polyphyly in DNA Barcode Gene Trees: Strong Operational Bias in European Lepidoptera. Systematic Biology, 65(6), 1024-1040. doi: 10.1093/sysbio/syw044
O'Meara, B.C., Ane, C., Sanderson, M.J. & Wainwright, P.C. (2006) Testing for different rates of continuous trait evolution using likelihood. Evolution, 60(5), 922-933.
Paradis, E., Claude, J. & Strimmer, K. (2004) APE: analyses of phylogenetics and evolution in R language. Bioinformatics, 20, 289-290.
Pons, J., Barraclough, T.G., Gomez-Zurita, J., Cardoso, A., Duran, D. P., Hazell, S., Kamoun, S., Sumlin, W. D. & Vogler, A. P. (2006) Sequence-based species delimitation for the DNA taxonomy of undescribed insects. Systematic Biology, 55, 595-609.
Price, M.N., Dehal, P.S. & Arkin, A.P. (2010) FastTree 2 – Approximately MaximumLikelihood Trees for Large Alignments. PLoS ONE 5, e9490.
This article is protected by copyright. All rights reserved.
Accepted Article
Puillandre, N., Lambert, A., Brouillet, S. & Achaz, G. (2012) ABGD, Automatic Barcode Gap Discovery for primary species delimitation. Molecular Ecology, 21, 1864-1877.
Quicke, D. L. J., Smith, M.A., Janzen, D.H., Hallwachs, W., Fernandez-Triana, J., Laurenne, N. M., Zaldivar-Riveron, A., Shaw, M. R., Broad, G. R., Klopfstein, S., Shaw, S.R., Hrcek, J., Hebert, P.D.N., Miller, S.E., Rodriguez, J.J., Whitfield, J.B., Sharkey, M.J., Sharanowski, B.J., Jussila, R., Gauld, I.D., Chesters, D. & Vogler, A.P. (2012) Utility of the DNA barcoding gene fragment for parasitic wasp phylogeny (Hymenoptera: Ichneumonoidea): data release and new measure of taxonomic congruence. Molecular Ecology Resources, 12, 676-685.
R Core Team (2014) R: A language and environment for statistical computing. R Foundation for Statistical Computing. Vienna. Austria. http://www.R-project.org/. [accessed 1 November 2015]
Ratnasingham, S. & Hebert, P.D. (2007) BOLD: The Barcode of Life Data System (www.barcodinglife.org). Molecular Ecology Notes, 7(3), 355-364.
Ratnasingham, S. & Hebert, P.D.N. (2013) A DNA-based registry for all animal species: the Barcode Index Number (BIN) System. PLoS ONE, 8, e66213.
Ross, H.A. (2014) The incidence of species-level paraphyly in animals: a re-assessment. Molecular Phylogenetics and Evolution, 76, 10-17.
Schliep, K.P. (2011) phangorn: phylogenetic analysis in R. Bioinformatics, 27, 592-593. Šipek, P. & Ahrens, D. (2011) Inferring larval taxonomy and morphology in Maladera species (Coleoptera: Scarabaeidae: Sericini) using DNA taxonomy tools. Systematic Entomology, 36, 628-643.
This article is protected by copyright. All rights reserved.
Accepted Article
Templeton, A.R. (2001) Using phylogeographic analyses of gene trees to test species status and processes. Molecular Ecology, 10, 779-791.
Valentini, A., Pompanon, F. & Taberlet, P. (2009) DNA barcoding for ecologists. Trends in Ecology & Evolution, 24, 110-117.
Yang, Z. & Rannala, B. (2010) Bayesian species delimitation using multilocus sequence data. Proceedings of the National Academy of Sciences USA, 107, 9264-9269.
Yang, Z. & Rannala, B. (2014) Unguided species delimitation using DNA sequence data from multiple loci. Molecular Biology and Evolution, 31, 3125-3135.
Zhang, C., Zhang, D-X., Zhu, T. & Yang, Z. (2011) Evaluation of a Bayesian coalescent method of species delimitation. Systematic Biology, 60, 747-761.
Zhang, J., Kapli, P., Pavlidis, P. & Stamatakis, A. (2013) A general species delimitation method with applications to phylogenetic placements. Bioinformatics, 29, 2869-2876.
This article is protected by copyright. All rights reserved.
Accepted Article
Table 1. Number of morphospecies genetic barcode clusters (“OTUs”) tci positive species, homogeneous and heterogeneous cluster, species in multiple homogeneous cluster and the match ratio between genetic cluster and morphospecies from the initial and second TaxCI run on the reference data (Ref data), the newly generated barcodes (new data), and both combined (Comb).
Morpho-
tci-positive
Cluster
Cluster
Species in multiple
Match ratio
species
Cluster
species
homogen.
heterogen.
homogen. clusters
Ref data (all)
3513
3883
50
3835
48
358
0.94
Ref data (>500bp)
3510
3884
48
3837
47
358
0.94
New data (all)
2978
3399
703
2959
440
644
0.73
Comb
4117
4673
984
4079
594
831
0.74
Comb (>500bp)
4115
4676
982
4081
595
834
0.74
Ref data (all)
3506
3883
51
3836
47
362
0.94
Ref data (>500bp)
3503
3884
50
3838
46
362
0.94
New data (all)
2846
3272
42
3249
23
375
0.94
Comb
4002
4621
168
4528
93
567
0.92
Comb (>500bp)
4000
4623
167
4531
92
567
0.92
Ref data (all)
3506
3401
51
3197
204
161
0.88
Ref data (>500bp)
3503
3392
50
3178
214
159
0.88
New data (all)
2846
2768
42
2605
163
151
0.87
Comb
4002
4211
168
3985
226
412
0.87
Comb (>500bp)
4000
4222
167
4003
219
411
0.87
Run 1
Run 2
Run 2 with mPTP
This article is protected by copyright. All rights reserved.
Accepted Article
Figures and legends
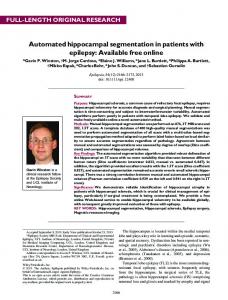
Figure 1. Map of Germany with the sample locations for the reference data from Hendrich et al. (2014; red circles) and newly added barcode data (blue triangles) (this study).
This article is protected by copyright. All rights reserved.
Accepted Article
Figure 2. Flow chart of principle procedures of the TaxCI script summarizing the four R functions tci(), plot.param.tci(), bc.cluster(), and plot.param.bcc().
This article is protected by copyright. All rights reserved.
Accepted Article
Figure 3. Simulated tree topologies with hypothetical nominal taxa (terminals A-E) used to explore the test cases for the TaxCI-based data pre-processing.
This article is protected by copyright. All rights reserved.
Accepted Article
Figure 4. Example of tree output from the empirical barcode data from the first pre-processing analysis.
Supplement Files
Supplement Table 1. Specimen collection data of the final cleared data set submitted to Barcode of Life database (BOLD) along voucher number, taxon names, and BOLD bin numbers including unique BINs as of 18th February 2016. (Excel file).
Supplement Table 2. Summary of the family-based analysis of the final combined data (>500 bp). Nmorph– number of morphospecies; Ntci+ - number of tci-positive species; Ncl number of cluster; NBIN - number of BINs; Nclho - number of homogeneous cluster; Nclhe - number of heterogeneous cluster; Nx - number of species in multiple cluster; Ny - number of species in multiple homogeneous cluster; T - threshold; MR - match ratio.
This article is protected by copyright. All rights reserved.
Accepted Article
Supplement File 1. Final species trees (pdf-format) with the cleared data set from all specimen data (New data, reference data, and all data combined; see Table 1), as well as from the single families of the combined data set (see Supplement Table 2).
Supplement File 2. Output from initial TaxCI runs (tree and results files) with the 5 data sets (see Table 1).
Supplement File 3. R code of the TaxCI analysis pipeline.
Supplement File 4. Species classification used for this study derived from Klausnitzer & Köhler (1998) and http://www.coleokat.de/de/fhl/ (status: 2012) and current classification applied in German's Coleopterist's community (status: 2015; http://www.coleokat.de/de/fhl/).
Supplement File 5. Details on sampling, vouchers, taxonomy, DNA extraction and sequencing
This article is protected by copyright. All rights reserved.