It included 34 passages selected from the list of exemplar texts provided in .... These two features are Nominalizations, and Average Characters per Word.
Research Report
Generating Automated Text Complexity Classifications That Are Aligned with Targeted Text Complexity Standards
Kathleen M. Sheehan Irene Kostin Yoko Futagi Michael Flor
December 2010 ETS RR-10-28
Listening. Learning. Leading.®
Generating Automated Text Complexity Classifications that are Aligned with Targeted Text Complexity Standards
Kathleen M. Sheehan, Irene Kostin, Yoko Futagi, and Michael Flor ETS, Princeton, New Jersey
December 2010
As part of its nonprofit mission, ETS conducts and disseminates the results of research to advance quality and equity in education and assessment for the benefit of ETS’s constituents and the field. To obtain a PDF or a print copy of a report, please visit: http://www.ets.org/research/contact.html
Technical Review Editor: Don Powers Technical Reviewers: Isaac Bejar and Jana Sukkarieh
Copyright © 2010 by Educational Testing Service. All rights reserved. ETS, the ETS logo, and LISTENING. LEARNING. LEADING. are registered trademarks of Educational Testing Service (ETS).
Abstract The Common Core Standards call for students to be exposed to a much greater level of text complexity than has been the norm in schools for the past forty years. Textbook publishers, teachers, and assessment developers are being asked to refocus materials and methods to ensure that students are challenged to read texts at steadily increasing complexity levels as they progress through school so that all students remain on track to achieve college and career readiness by the end of 12th grade. Although automated text analysis tools have been proposed as one method for helping educators achieve this goal, research suggests that existing tools are subject to three limitations: inadequate construct coverage; overly narrow criterion variables; and inappropriate treatment of genre effects. Modeling approaches developed to address these limitations are described. Recommended approaches are incorporated into a new text analysis system called SourceRater. Validity analyses implemented on an independent sample of texts suggest that, compared to existing approaches, SourceRater’s estimates of text complexity are more reflective of the complexity classifications given in the new Standards. Implications for the development of learning progressions designed to help educators organize curriculum, instruction and assessment in reading are discussed. Key words: text complexity, readability, genre, reading comprehension
i
Table of Contents Page Background ......................................................................................................................................1 Limitation #1: Construct Coverage ............................................................................................2 Limitation #2: Criterion Variables .............................................................................................5 Limitation #3: Genre Effects .....................................................................................................7 Method .............................................................................................................................................9 Study 1: Defining Construct-relevant Measures of Text Variation ...........................................9 Study 2: Evaluating Text Genre Effects. .................................................................................11 Study 3: Investigating Alignment with Targeted Complexity Standards ................................12 Corpora ..........................................................................................................................................12 Results ............................................................................................................................................14 Study 1: Defining Construct-Relevant Measures of Text Variation ........................................14 Dimension #1: Spoken vs. Written Language. ..................................................................17 Dimension #2: Academic Orientation.. .............................................................................17 Dimension #3: Syntactic Complexity ................................................................................18 Dimension #4: Narrative Style...........................................................................................18 Dimension #5: Overt Expression of Persuasion. ...............................................................18 Dimension #6: Vocabulary Difficulty. ..............................................................................19 Dimension #7: Negation ....................................................................................................19 Study 2: Evaluating Text Genre Effects ..................................................................................19 Study 3: Investigating Alignment with Targeted Text Complexity Standards ........................24 Discussion ......................................................................................................................................34 Technique #1: Ensuring Adequate Construct Coverage ..........................................................35 Technique #2: Defining Criterion Variables............................................................................35 Technique #3: Accounting for Text Genre Effects ..................................................................36 Implications for Organizing Instruction and Assessment ........................................................36 Directions for Additional Research .........................................................................................36 References ......................................................................................................................................38
ii
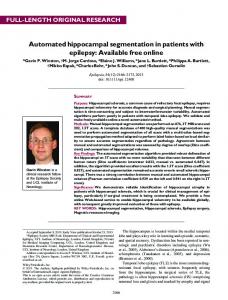
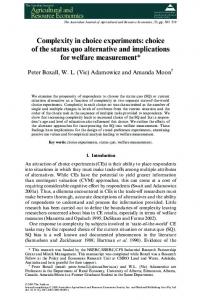
List of Figures Page Figure 1. Distribution of average sentence length scores for informational and literary texts (top) and trends in Average Grade Level plotted conditional on Average Sentence Length (bottom). ..........................................................................................................22 Figure 2. Distribution of average ETS Word Frequency scores for informational and literary texts (top) and trends in average Grade Level plotted conditional on average ETS Word Frequency scores (bottom).................................................................................23 Figure 3. Mean complexity scores plotted conditional on Human GL Judgments. .......................27 Figure 4. Scatter plot of SourceRater GL predictions vs. Common Core GL classifications for informational texts (top) and literary texts (bottom)....................................................30 Figure 5. Scatter plot of Flesch-Kincaid GL predictions vs. Common Core GL classifications for informational texts (top) and literary texts (bottom). .............................................31 Figure 6. Scatter plot of Lexile Scores vs. Common Core GL classifications for informational texts (top) and literary texts (bottom). .........................................................................32 Figure 7. A SourceRater analysis of a candidate literary text for a grade 4 reading assessment. ...................................................................................................................34
iii
List of Tables Page Table 1 Numbers of Passages Included in the SourceRater Training Corpus, by Grade and Genre. .............................................................................................................................13 Table 2 Numbers of Passages Included in the Validation Corpus, by Grade Band and Genre. .........................................................................................................................................14 Table 3 Major Dimensions of Text Variation with Sample Features, Loadings and Marker Variable Status ................................................................................................................15 Table 4 Model Coefficients, Significance Probabilities and Expected Genre Biases for Measures of Vocabulary Difficulty, Syntactic Complexity, Academic Orientation, and Topic Development .................................................................................................20 Table 5 Regression Coefficients for Genre-specific Prediction Models......................................25 Table 6 Summary of Validity Results, by Genre, for Three Different Text Complexity Models Evaluated on 548 Passages Selected from High-Stakes State Reading Assessments ...................................................................................................................26 Table 7 Summary of Validity Results, by Genre, for Three Different Text Complexity Models Evaluated on 34 Texts Selected from Appendix B of the Common Core Standards ........................................................................................................................29
iv
Background Although the ability to comprehend complex text is considered to be essential for success in college and careers, significant gaps have been reported between the complexity levels of texts that students are asked to read in high school, and those of texts that they will be required to read either in college or in workforce training programs (Williamson, 2006; ACT, 2006). The Common Core State Standards for Reading (CCSSO, 2010) argue that eliminating such gaps is critically important if students are to be adequately prepared for the more demanding jobs of the 21st century. A key goal of the Standards, then, is to ensure that students are challenged to read texts at steadily increasing complexity levels as they progress through school so that, in time, text complexity gaps can be reduced or eliminated. Concerns about possible complexity gaps, combined with recent increases in the availability of large collections of electronic text, have contributed to a renewed interest in automated approaches for assessing text complexity. This interest has yielded several important innovations, e.g., new approaches for assessing variation due to differences in syntactic complexity (Heilman, Collins-Thompson, & Eskenazi, 2008; Lu, 2010); new approaches for assessing variation due to differences in text cohesion (Graesser, McNamara, Louwerse, & Cai, 2004); and new approaches for selecting texts that are appropriately challenging for readers with lower or higher levels of reading ability (Stenner et al., 1996). Despite these advances, research summarized below suggests that existing approaches for automatically assessing text complexity are subject to three limitations: inadequate construct coverage; overly narrow criterion variables; and inappropriate treatment of genre effects. This paper presents innovative modeling techniques developed to address each limitation. Recommended techniques are incorporated into a new text analysis system called SourceRater. Analyses of exemplar texts selected from Appendix B of the Common Core Standards suggest that, compared to existing approaches, text complexity estimates obtained via SourceRater are more closely aligned with the grade level (GL) expectations specified in the Standards.
1
Existing Approaches: Limitations and Proposed Solutions Existing approaches for automatically assessing text complexity are reviewed below. Specific limitations are described, and innovative approaches developed to address each limitation are proposed. Limitation #1: Construct Coverage Early approaches for modeling variation due to differences in text complexity are reviewed in Klare (1984). Four popular approaches are described: the Flesch Reading Ease Index (Flesch, 1948), the Dale-Chall Readability Formula (Chall & Dale, 1948), the Fry Index (Fry, 1968), and the Flesch-Kincaid Grade Level (GL) Score (Kincaid, et al., 1975). These four approaches, also called readability formulas, are alike in that, in each case, text complexity is determined from just two independent variables: a single measure of syntactic complexity, and a single measure of semantic difficulty. In all four approaches average sentence length is taken as the single measure of syntactic complexity. The approaches differ in terms of the specific features selected for use in measuring semantic difficulty. In three of the approaches, i.e., Flesch, Flesch-Kincaid, and Fry, semantic difficulty is assessed via average word length measured in syllables. In the Dale-Chall formula, semantic difficulty is assessed via the average frequency of words expected to be familiar to young readers. A number of additional readability formulas have been published. These include the Powers, Sumner, Kearl Readability Formula (Dubay, 2004), the Coleman Liau Formula (Coleman & Liau, 1975), the Bormuth Formula (Dubay, 2004) and the Gunning FOG formula (Gunning, 1952). As in the four formulas discussed above, these additional formulas also assess just two dimensions of text variation: syntactic complexity measured via average sentence length, and semantic difficulty measured via average word length and/or average word familiarity. In 1988, Stenner, Horabin, Smith, and Smith introduced an alternative text analysis system designed to exploit the conjoint measurement properties of the Rasch Model (Rasch, 1960). This new system, termed the Lexile Framework for Reading, is now widely used in elementary and middle school classrooms throughout the United States. Like the early readability formulas discussed above, however, the Lexile Framework considers just two dimensions of text variation: syntactic complexity and semantic difficulty. Syntactic complexity 2
is assessed via log average sentence length, and semantic difficulty is assessed via a word frequency index developed from a large corpus of texts believed to be representative of the reading materials typically considered by students in grades kindergarten through college. Although many of the systems described above have been praised for being both helpful and easy to use, limitations have also been noted. For example, Sawyer (1991) argued that the early readability formulas were “misleading and overly simplistic” (p. 309). Similarly, Coupland (cited in Klare, 1984) noted that “the simplicity of … readability formulas … does not seem compatible with the extreme complexity of what is being assessed” (p. 15). Holland (1981) reported a similar conclusion, “While sentence length and word frequency do contribute to the difficulty of a document, a number of equally important variables elude and sometimes run at cross purposes to the formulas …” (p. 15) Perhaps the most worrisome criticisms have been voiced by researchers who attempted to manipulate text difficulty by manipulating sentence length and word familiarity. For example, Davidson and Kantor (1982) showed that texts that were revised to include shorter sentences yielded decreases in comprehension rather than increases. Similar results are reported in Beck, McKeown and Worthy (1995), Britton and Gulgoz (1991), and Pearson and Hamm (2005). Recently, researchers have attempted to explain the unexpected results reported above by positing a third dimension of text variation termed the cohesion dimension. Like syntactic complexity and semantic difficulty, cohesion is a theoretical construct believed to be involved in the determination of reading ease or difficulty. Two particular measures of text cohesion are frequently included in automated text analysis systems: referential cohesion and causal cohesion. Referential cohesion refers to the degree to which words, phrases or concepts are repeated across a text. Causal cohesion refers to the degree to which causal relationships are explicitly stated in a text, for example, using connectives such as because, therefore, and consequently. Early attempts to measure variation due to differences in referential and causal cohesion are described in Graesser, McNamara, Louwerse, and Cai (2004). Forty candidate measures were implemented and incorporated into a web-based tool called Coh-Metrix. McNamara, et al. (2010) examined the performance of these indices relative to the goal of detecting intentional cohesion manipulations made by experts in text comprehension. Two versions of each of 19 different texts were analyzed: a low-cohesion version and a high3
cohesion version. The performance of each index relative to the task of distinguishing between these two versions was examined. Significant differences were observed for 28 of the 40 indices. An additional analysis of one particular Coh-Metrix cohesion feature is reported in Crossley, Greenfield, and McNamara (2008). That study considered whether the Coh-Metrix cohesion feature called content word overlap would yield improved estimates of text complexity when complexity was measured via a cloze fill-in approach. Results confirmed that the targeted feature contributed to the predictive accuracy of a model that already included measures of syntactic complexity and semantic difficulty. Although the extreme complexity of the reading comprehension process suggests that additional dimensions of text variation may be needed to adequately explain variation in text complexity, models involving more than three dimensions are rare. This surprising result may be due to the difficulty of accounting for the strong intercorrelations that are likely to exist among many important text features. The problem of combining multiple correlated indicators of text variation is discussed in Biber (1986, 1988) and Biber, Conrad, Reppen, Byrd, Helt, and Clark (2004). A two-step solution is proposed. First, corpus-based multidimensional techniques are used to locate clusters of features that simultaneously exhibit high within-cluster correlation and low between-cluster correlation. Second, linear combinations defined in terms of the identified feature clusters are employed for text characterization. Biber and his colleagues (2004) justify this approach by noting that, because many important aspects of text variation are not well captured by individual linguistic features, investigation of such characteristics requires a focus on “constellations of co-occurring linguistic features” as opposed to individual features (p. 45). Several applications of the Biber et al. approach have been described in the literature. For example, Sheehan, Kostin, and Futagi (2007) employed a corpus-based multidimensional technique to define independent variables for use in SourceFinder, an automated text filtering application designed to help test developers locate source material for use in developing reading comprehension passages targeted at specific reading proficiency levels. Similarly, Sheehan, Kostin and Futagi (2008b) employed a corpus-based multidimensional technique to develop D-tree, an early prototype of the SourceRater system. This paper provides a more 4
complete description of the corpus-based multidimensional analysis implemented to define text complexity measures for use in SourceRater. Limitation #2: Criterion Variables Three approaches for defining criterion variables for use in text analysis applications have been described in the literature. In one approach, text complexity is defined via a cloze fill-in technique. This approach is employed in the Bormuth formula (Dubay, 2004), the Dale-Chall formula (Chall & Dale, 1995), and the Coh-Metrix L2 Readability Index (Crossley, Greenfield, & McNamara, 2008). In one popular version of the approach, passages are administered with every fifth word deleted and gradations of text complexity are determined by calculating the probability of a correct fill-in. Thus, a highly complex text is defined as one for which the probability of guessing the missing word is low, and a less complex text is defined as one for which the probability of guessing the missing word is high. Shanahan, Kamil, and Tobin (1983) evaluated this approach by comparing students’ performances on cloze items administered under four different passage conditions: (a) intact passages, (b) scrambled passages (with sentences randomly reordered); (c) intermingled passages (with sentences from different passages interspersed); and (d) eclectic passages (collections of unrelated sentences). After observing similar cloze fill-in rates under all four conditions, Shanahan et al. (1983) concluded that the cloze fill-in approach does not provide useful information about “intersentential” comprehension, that is, comprehension that requires integrating information across sentence boundaries. This finding was later replicated by Leys, Fielding, Herman, and Pearson (1983). A similar finding is reported in Kintsch and Yarborough (1982). These studies suggest that text complexity measures developed via cloze training techniques may not be reflective of the broad range of complexity criteria considered in published state reading standards. Modified cloze techniques have also been used to define criterion variables for use in text analysis systems. Stenner (1996) described the modified cloze technique employed during the development of the Lexile Framework as follows. First, paragraphs were sampled from texts targeted at students in grades 2 through 12. Second, a multiple choice item was constructed for each paragraph. Each item included two parts: (a) a continuation sentence presented with a single word blanked out; and (b) a list of four possible option words, i.e., the 5
correct word and three distractors. Third, the items were administered to examinees in grades 2 through 12, and a Rasch Model was fit to the resulting examinee response matrix. The vector of paragraph difficulty parameters obtained via the Rasch calibration was then taken as the criterion measure to consider in subsequent investigations. In the Lexile Framework, then, a highly complex paragraph is defined as one for which the probability of selecting the correct option word is low, and a less complex paragraph is defined as one for which the probability of selecting the correct option word is high. In evaluating this approach it is useful to recall that many important reading skills require integrating information across paragraph boundaries, e.g., inferring the central idea or theme of a text, analyzing an argument from multiple perspectives and evaluating the soundness of reasoning (Schmeiser & Welch, 2006). When reading stimuli are constrained to include no more than a single paragraph of text, however, variation due to text features that might facilitate or hinder such processing may not be captured. This suggests that the Lexile criterion measure may not accurately represent the complexity constructs targeted by many K–12 reading assessments. A third approach for establishing a quantitative criterion measure is described in Heilman, et al. (2007, 2008). In this approach, passages are downloaded from web sites believed to be targeted at students in specific U.S. grades and the GL listed on the web site is taken as the “true” GL of the passage. Although this approach is capable of capturing a broader range of complexity variation, additional limitations may apply. For example, users have no assurance that the selected web sites were developed in accordance with published state reading standards, and there is no preset process for detecting and correcting classification errors. SourceRater employs an alternative approach for developing criterion variables for use in text complexity investigations. In this approach, the “true” complexity level of a text is determined via a set of judgments provided by experienced educators, as follows. First, passages are selected from high-stakes, standards-based reading assessments such as those mandated by the federal NCLB legislation. Second, an “inheritance principle” is used to assign a GL classification to each passage (see Sheehan et al., 2008a, 2008b, 2009). For example, if Passage X was developed for use on a Grade 5 assessment, its true GL classification would be set to Grade 5. Note that resulting GL classifications offer all of the 6
following advantages: each is based on published reading standards which, in turn, are based on published research; each has been reviewed by experienced educators with first-hand knowledge of applicable state standards; each reflects multiple sources of complexity variation, including intrasentential variation, inter-sentential variation and inter-paragraph variation; and finally, in many cases, classifications also reflect analyses of passage pretest data collected from hundreds of examinees in the targeted populations. While criterion variables developed via this new approach undoubtedly contain some degree of uncertainty, analyses summarized below suggest that they are precise enough to yield practically useful information about those aspects of text complexity that vary systematically across GLs. Limitation #3: Genre Effects The 2009 NAEP Reading Framework (American Institutes for Research, 2008) distinguishes two broad categories of texts: informational texts and literary texts. These categories refer to the idealized norms of a genre, not the source of the stimulus material per se (Fludernik, 2000). The informational category includes texts structured to inform or persuade, e.g., excerpts from science and social studies text books, expository articles extracted from high interest magazines, historical documents and newspaper editorials. The literary category includes texts structured to provide a rewarding literary experience, e.g., folk tales, short stories, excerpts from novels, and well crafted nonfiction with strong literary characteristics. Previous research suggests that many important indicators of reading difficulty function differently within these two types of texts. For example, differences have been reported in the number of propositions recalled (Graesser et al., 1980); in the types of comprehension strategies utilized (Kukan & Beck, 1997); in word reading rates (Zabrucky & Moore, 1999); in the frequency of “core” vocabulary words (Lee, 2001); in the types of inferences generated during reading (van den Broek et al., 2002); in the type of prior knowledge accessed during inference generation (Best, Floyd, & McNamara, 2004); in the way that cohesion relations are expressed (McCarthy, Graesser, & McNamara, 2006), in the rate at which rare words are repeated (Hiebert, 2009), and in the type of brain activity detected via electroencephalograms (EEGs) (Baretta et al., 2009). Several explanations for these differences have been proposed. In one view, literary texts are said to require different processing strategies because they deal with more familiar 7
concepts and ideas (Graesser, McNamara, & Louwerse, 2003). For example, while many literary texts employ familiar story grammars that are known to even extremely young children, informational texts tend to employ less well known structures such as cause-effect, comparison-contrast, and problem-resolution. Genre-specific processing differences have also been attributed to differences in the types of vocabularies employed. To better understand this phenomenon, Lee (2001) examined differences in the use of core vocabulary within a corpus of informational and literary texts that included over one million words downloaded from the British National Corpus. Core vocabulary was defined in terms of a list of 2,000 common words classified as appropriate for use in the dictionary definitions presented in the Longman Dictionary of Contemporary English, Second Edition. The analyses demonstrated that core vocabulary usage was higher in literary texts than in informational texts. For example, when literary texts such as fiction, poetry and drama were considered, the percent of total words classified as “core” vocabulary ranged from 81% to 84%. By contrast, when informational texts such as science and social studies texts were considered, the percent of total words classified as “core” vocabulary ranged from 66% to 71%. In interpreting these results Lee suggested that the creativity and imaginativeness typically associated with literary writing may be less closely tied to the type or level of vocabulary employed and more closely tied to the way that core words are used and combined. Explanations have also been cast in terms of differences in the rate at which rare words are repeated. For example, Walker (cited in Hiebert, 2009) found that rare words in science texts are repeated more frequently than are rare words in narratives. Since each repetition provides an additional opportunity to connect to prior knowledge, texts that exhibit high rare word repetition rates may present a less challenging comprehension problem compared to similarly structured texts that do not exhibit high rare word repetition rates. While few would dispute the informational/literary distinctions noted above, text complexity models that account for such differences are rare. In particular, approaches such as the Flesch-Kincaid GL Score (Kincaid et al., 1975); the Lexile Framework (Stenner et al., 1988), the Coh-Metrix L2 Readability Index (Crossley et al., 2008), and the Degrees of Reading Power score (Carver, 1985) each provide a single prediction equation that is assumed to hold for both informational and literary texts. 8
Investigations focused on the variation captured by particular types of text features have also tended to ignore genre effects. For example, even though the corpus considered in McNamara et al. (2010) included both informational and literary texts, genre effects were not investigated. In contrast to the genre-blind approaches summarized above, this paper demonstrates that many important linguistic features function differently within informational and literary texts. SourceRater accounts for these differences by providing two distinct prediction models: one optimized for application to informational texts, and one optimized for application to literary texts. Method The innovative modeling approaches described above have been incorporated into a new text analysis system called SourceRater. This paper describes SourceRater development and validation via a series of three studies. Study 1 documents the Principal Components Analysis (PCA) conducted to define independent variables for use in SourceRater’s two prediction models, i.e., the informational model and the literary model. Study 2 focuses on the issue of text type bias (also called genre bias). The study demonstrates that many popular linguistic features function differently within informational and literary texts, and that text analysis systems that fail to account for these differences run the risk of generating complexity estimates that are consistently too high for informational texts, and consistently or too low for literary texts. Study 3 evaluates SourceRater performance relative to the goal of generating text complexity classifications that are aligned with the Common Core State Standards for Reading. The study demonstrates that, compared to existing approaches, SourceRater’s estimates of text complexity are more closely aligned with the classifications given in the new Standards. Study 1: Defining Construct-relevant Measures of Text Variation A multidimensional technique similar to the one described in Biber et al. (2004) was used to develop construct-relevant measures of text variation for use in SourceRater. Three modifications to the Biber et al. approach were adopted. First, while all of Biber’s investigations considered variation in both written and spoken texts, we elected to restrict our attention to written texts only. This modification was designed to ensure that the resulting 9
dimension scores would be optimally configured to characterize variation in written language as opposed to variation that spans both written language and spoken language. Second, because the primary goal of the analysis was to develop independent variables for use in model development, a principal components analysis (PCA) was implemented rather than a Factor Analysis. Third, because genre annotations were not available for the texts in our corpus, an alternative dimension identification approach was implemented. That is, in each of Biber’s previous analyses referenced above, individual texts were classified as belonging to particular registers and genres, e.g., spoken texts, written texts, mystery fiction, science fiction, academic prose, official documents, etc. Because such annotations were not available for the texts in our corpus, dimension identification was instead accomplished via a “marker variable” approach. Marker variables are variables that can be reasonably expected to provide relatively pure measurement of specific targeted dimensions (Tabachnick and Fidell, 2001, p. 587). Since many of the features considered in the analyses had been previously shown to be of use in measuring specific dimensions of variation, these features helped us to identify and label the dimensions obtained in the current analysis. The current analysis was conducted in phases. In the first phase, more than 100 linguistic features believed to be indicative of variation in text complexity were extracted from each text. Feature definitions were based on research documented in Biber, et al. (2004) and Sheehan, Kostin and Futagi (2007, 2008a, 2008b). Feature extraction was accomplished in five steps, as follows: First, a sentence segmenter was applied; second, a part of speech (POS) tagger was applied; third, a syntactic parser was applied; fourth, individual features were extracted; and fifth, all count-based features were re-expressed on a log frequency per 1,000 words scale. Note that this approach ensures that all features that are specific to a particular POS consider only those instances that conform to the targeted POS. These analyses were subject to an important limitation: because the corpus considered in the analyses did not include accurate paragraph markings, features requiring such markings could not be extracted. Consequently, the PCA did not include any features classified as requiring accurate paragraph segmentation information. Features in this category include some features designed to characterize the degree of lexical cohesion detected in a text, and features designed to characterize differences in the degree to which topics are
10
developed or elaborated. As is reported below, features from these categories were reincorporated into the model at a later stage of the analysis. Study 2: Evaluating Text Genre Effects. Psychometric investigations of new measurement instruments frequently include analyses of possible differences in predictive validity for examinees in different subgroups. For example, Poteat, Wuensch, and Gregg (1988) investigated whether IQ scores were similarly predictive of grades in school for independent samples of black and white students who had been referred for special education evaluation. Sheehan et al. (2008a) employed a similar approach to investigate whether popular measures of text complexity are similarly predictive of text GL for two different types of texts: informational texts and literary texts. This study presents a similar analysis of informational and literary passages selected from a set of high-stakes, standards-based reading assessments. Five types of text complexity measures are evaluated: measures designed to characterize differences in syntactic complexity, measures designed to characterize differences in vocabulary difficulty, measures designed to characterize differences in degree of academic orientation, measures designed to characterize differences in topic development, and measures designed to characterize differences in overall readability. Following Poteat et al. (1988), the predictive validity of each measure is evaluated by fitting the following linear model:
Yˆ b0 b1 X b2G b3G * X ,
(1)
where Yˆ is the predicted value of the criterion variable (in this case, the GL at which the passage was administered), X is a measure of text complexity (e.g., average sentence length measured in log words), and G is a categorical variable coded as G = 0 for informational passages, and G = 1 for literary passages. The hypothesis of equivalent genre effects is evaluated by testing whether 2 and 3 are significantly different from zero. When the hypothesis that 2 0 is rejected we have evidence of unequal intercepts. When the hypothesis that 3 0 is rejected we have evidence of unequal slopes. The practical significance of the estimated genre effects is also evaluated. This is accomplished by first estimating the above model with 2 and 3 fixed at zero to obtain a non-genre-specific yˆi 11
for each text, and then calculating mean differences separately for informational and literary texts as follows:
Bias ( Inf ) 1/ n ( yˆi yi ), for i 1,..., n Bias ( Lit ) 1/ m ( yˆ k yk ), for k 1,..., m
(2)
where n and m are the number of informational and literary passages included in the analyses, respectively. Note that a positive bias value is indicative of a prediction equation that systematically overestimates test complexity (compared to human ratings), and a negative bias value is indicative of a prediction equation that systematically underestimates text complexity. Study 3: Investigating Alignment with Targeted Complexity Standards This study examines SourceRater performance relative to the goal of generating GL classifications that are aligned with the Common Core State Standards for Reading (CCSSO, 2010). The evaluation is conducted in two steps. First, two distinct prediction models are estimated, one optimized for application to informational texts, and one optimized for application to literary texts. Second, the resulting models are applied to an independent sample of texts selected from Appendix B of the Common Core State Standards. Two measures of model performance are reported: the correlation between GL classifications generated via SourceRater and those specified by the standards writers, and the average bias estimated via Equation 2. In order to provide a basis for comparison, similar performance statistics are presented for scores generated via the Flesch-Kincaid GL formula and the Lexile Framework. Corpora Three collections of passages were assembled for use in this research. The first collection included 12,476 texts selected for use in defining independent variables that capture construct-relevant aspects of text variation. Individual texts were selected from a version of the Lexile Corpus provided by the Metametrics Corporation. The selected subset included the first 1,000 words of all texts with Lexile scores between 520 and 1300, a subset that roughly corresponds to the 3rd through 12th grade range. The resulting corpus included more than 12 million words of running text distributed across a total of 12,476 documents. 12
A second corpus was developed for use in examining genre effects, and in estimating SourceRater’s genre-specific complexity models. This second corpus included 548 passages selected from high stakes reading assessments developed to represent the published reading standards in 17 different states. Human judgments of genre (informational vs. literary) and GL were available for each text. In most cases, these were provided by professional educators with access to pretest data collected from hundreds of examinees in the targeted populations. Table 1 Numbers of Passages Included in the SourceRater Training Corpus, by Grade and Genre Grade 3
Informational Passages 34
Literary Passages
Total
44
78
4
31
54
85
5
31
30
61
6
23
22
45
7
26
43
69
8
39
34
73
9
22
16
38
10
22
40
62
11
12
20
32
12
3
2
5
243
305
548
Total
The third corpus was developed for use in evaluating alignment with the Common Core State Standards. It included 34 passages selected from the list of exemplar texts provided in Appendix B of the Standards. Since several of the designated texts were quite long, passagelength texts were created by starting with the excerpt listed in the Appendix, and then adding enough surrounding text to yield a passage of approximately 1,000 words (except in the case of short texts like the Gettysburg Address which, in total, include fewer than 1,000 words.) Table 2 shows the number of informational and literary texts included at each grade band. Because
13
numeric complexity classifications are more amenable for analysis, the mean GL within a grade band was taken as the true complexity classification for each text.1. Table 2 Numbers of Passages Included in the Validation Corpus, by Grade Band and Genre Grade Band
Literary Passages
Total
2-3
Informational Passages 2
3
5
4-5
2
3
5
6-8
4
4
8
9-10
6
3
9
11-12
3
4
7
Total
17
17
34
Results Study 1: Defining Construct-Relevant Measures of Text Variation This study documents the PCA implemented to define construct-relevant measures of text variation for use in SourceRater. Initial stages of the analysis considered more than 100 features, including many of the features described in Biber et al. (2004) and all of the features described in Sheehan et al. (2007). Since this initial analysis indicated that many of the specified features were either redundant, or were only weakly correlated with the major dimensions of variation underlying the bulk of the features, the feature set was further reduced to a subset of 48 prime features. A second PCA focused on the 48 retained features suggested that, at most, seven dimensions of variation were being measured. Since all seven components appeared to be construct-relevant, a seven-component solution was extracted. Taken together, these seven components accounted for more than 60% of the shared variance. The specific aspects of text variation addressed by these seven dimensions were determined by considering the loadings obtained for the available marker variables and the other highly weighted features within each dimension. Results are summarized in Table 3. The table shows the actual loadings obtained for each feature as well as their “Marker Variable Status.” The codes in the “Marker Variable Status” column show which features were included in each of five previous corpus-based analyses, abbreviated as follows: B86 14
= Biber (1986), B88 = Biber (1988), B99 = Biber, et al. (1999), B04 = Biber, et al. (2004), and R01 = Reppen (2001). Numbers in parentheses refer to specific previously identified dimensions. Thus, B86(1) indicates that the referenced feature had a high loading on the first dimension reported in Biber (1986). Because Biber et al. (1999) did not include a factor analysis, factor numbers are not provided for the B99 code. Instead, the B99 codes indicate whether the referenced feature was found to be indicative of conversation (C), academic text (A), or fiction (F). Table 3 also provides a short descriptive label for each dimension. These were developed by considering the pattern of variation implied by the available marker variables, and by the other highly weighted features within each dimension, as summarized in the following table. Table 3 Major Dimensions of Text Variation with Sample Features, Loadings and Marker Variable Status Feature Dimension 1: Spoken vs. Written Language
Loading
Marker Variable Status
First Person Singular Pronouns [I, me, my, etc.]
+ .98
B86(1), B88(1), B04(1)
First Person Plural Pronouns [we, us, our, etc.]
+ .95
B86(1), B88(1), B04(1)
Communication Verbs [ask, call, question, etc.]
+ .72
B04(1)
Conversation Verbs [get, know, put, etc.]
+ .63
B99(C)
Contractions [didn’t, can’t, I’ve, etc.]
+ .62
B86(1), B88(1), B04(1)
Wh words [who, what, where, etc.]
+ .59
B86(1), B88(1), B04(1)
Mental State Verbs [appreciate, care, feel, etc.]
+ .56
B04(1)
Question Marks (frequency per 100 sentences)
+ .54
B86(1), B88(1), B04(1)
Attributive Adjectives
- .50
B88(1), B04(1)
Noun Verb Ratio
- .51
Dimension 2: Academic Orientation Nominalizations [ –tion, -ment, -ness, -ity]
+ .86
Academic Words (Coxhead)
+ .78
15
B86(2), B99(A)
Feature
Loading
Marker Variable Status
Dimension 2: Academic Orientation (continued) Average Word Length (log syllables)
+ .76
Abstract Nouns [existence, progress, etc.]
+ .75
Age of Acquisition
+ .71
Topical Adjectives [social, human, etc.]
+ .65
Cognitive Process/Perception Nouns
+ .60
Academic Verbs [apply, develop, indicate, etc.]
+ .60
B99(A)
Average Characters per word (log characters)
+ .57
B86(2)
Average Concreteness Rating
- .73
Dimension 3: Sentence Complexity Avg. No. of Clauses per Sentence
+ .96
Avg. No of Words per Sentence (log words)
+ .91
Prepositions
+ .50
Dimension 4: Narrative Style Past Tense Verbs
+ .79
B86(3),B88(2),B04(3),R01(2)
Past Perfect Aspect Verbs
+ .79
B86(3), B88(2), B99(F)
Third Person Singular Pronouns [he, she, etc.]
+ .62
B86(3), B88(2), B04(3)
Present Tense Verbs
- .87
B86(3), R01(2)
To Infinitives
+ .82
B88(4)
Necessity Modals [should, must, etc.]
+ .60
B88(4)
Possibility Modals [can, can’t, could, etc.]
+ .57
B88(4), R01(5)
Conditional Subordinators [if, unless]
+ .51
B88(4), R01(5)
Dimension 5: Overt Expression of Persuasion
Dimension 6: Vocabulary Difficulty TASA SFI < 50 (Token Count)
+ .88
TASA SFI < 40 (Token Count)
+ .86
TASA SFI < 40 (Type Cnt) + Words Not TASA
+ .83
TASA SFI < 50 (Type Cnt) + Words Not TASA
+ .81
Average TASA SFI
- . 90 Table continues
16
Feature Dimension 7: Negation
Loading
Synthetic Negation [no, neither, nor]
+ .72
Adversative Conjuncts [alternatively, etc]
+ .56
Negative Adverbs [never, seldom, rarely, etc.]
+ .51
Marker Variable Status
Dimension #1: Spoken vs. Written Language. Table 3 shows that almost all of the features with high loadings for this dimension also had high loadings on the first dimensions reported in one or more of the following studies: Biber (1986), Biber (1988), and Biber et al. (2004). In each of the previous studies, the author’s were able to demonstrate that transcripts of spoken texts yielded high scores on the referenced construct while written texts yielded much lower scores. These results provide strong evidence that the first dimension obtained in the current analysis may be viewed as a measure of the extent to which a written text exhibits linguistic structures that are more characteristic of spoken language than of written language. This interpretation is further supported by noting that many of the features with high loadings on this dimension are indicative of a more spontaneous, more conversational style as opposed to a less spontaneous, print-only style. These include first-person singular and plural pronouns, communication verbs, words indicative of questions, question marks, and verbs that tend to occur more frequently in conversation than in printed text. The table also shows two features with relatively high negative loadings, i.e., the frequency of attributive adjectives and the noun-verb ratio. These findings are consistent with findings reported in Biber (1988) and Biber, et al. (2004) which suggested that printed texts tend to exhibit a high frequency of attributive adjectives and a relatively high noun-verb ratio. Consequently, this dimension is labeled the Spoken vs. Written Language Dimension. Dimension #2: Academic Orientation. Two of the features with high loadings for this dimension also had high loadings on the second dimension reported in Biber (1986). These two features are Nominalizations, and Average Characters per Word. Biber (1986) reported that samples of academic prose tended to score highly on a dimension that loaded heavily on these two features, thereby supporting the notion that the second dimension extracted in the current analysis may be interpreted as a measure of the degree of academic orientation detected in a text. As is shown in Table 3, this interpretation is also supported by two findings from Biber, et al. (1999). Biber et al. (1999, pp. 322-325, 365-378) compared 17
the frequency of occurrence of certain linguistic features in academic texts, transcripts of conversations, and fiction. They reported that both nominalizations and academic verbs (e.g., apply, develop, indicate, etc.) tended to occur more frequently in academic texts than in transcripts of conversations or in fiction. Thus, these latter results also support the notion that scores on Dimension 2 may be interpreted as measures of the degree to which a given text exhibits features that are more characteristic of academic prose than of transcripts of conversations or fiction. The high positive loading listed for the Coxhead (2000) Academic Words feature, and the high negative loading listed for the Average Concreteness feature (obtained from the MRC Psycholinguistic Database, Coltheart, 1981) also support this interpretation. Based on this evidence, then, the second dimension in Table 3 was labeled the Academic Orientation Dimension. Dimension #3: Syntactic Complexity. Three syntactic features loaded highly in this dimension. These included the average number of clauses per sentence, the average number of words per sentence, and the average frequency of prepositions. Since these features are frequently characterized as measuring aspects of syntactic complexity, this dimension is labeled the Syntactic Complexity Dimension. Dimension #4: Narrative Style. Table 3 shows that all of the features with high loadings for this dimension also had high loadings on the second dimension reported in Biber (1988) and Reppen (2001), and on the third dimension reported in Biber (1986) and Biber et al. (2004). Since these previous analyses indicated that the referenced features were measuring Degree Adherence to a Narrative style, this suggests that the third dimension extracted in the current analysis is also a measure of narrative style. This interpretation is also supported by noting that three features with high positive loadings on this dimension (i.e., past tense verbs, past perfect aspect verbs and third person singular pronouns) and one feature with a high negative loading (i.e., present tense verbs) have each been previously characterized as being indicative of a narrative style. This interpretation is further supported by a finding from Biber et al. (1999, p. 461) that fictional works, which are typically narratives, tend to have a high frequency of past perfect aspect verbs. Based on this evidence, then, the third dimension in Table 3 was labeled the Narrative Style Dimension. Dimension #5: Overt Expression of Persuasion. Table 3 shows that several of the features that had high positive loadings on this dimension had previously been identified as 18
being characteristic of persuasive or argumentative text. For example, Biber (1988) identified a high frequency of infinitives as being a strong positive indicator of argumentation, and both Biber (1988) and Reppen (2001) identified modal verbs and conditional subordinators as being positively associated with level of argumentation. Based on this evidence, Dimension #5 was labeled Overt Expression of Persuasion. Dimension #6: Vocabulary Difficulty. The sixth dimension was determined to be a measure of the vocabulary level of a text based on the following results. First, the four features with high positive loadings for this dimension were each designed to detect texts with a high incidence of low frequency words as determined from the TASA Word Frequency Index (Zeno, et al., 1995). These included normalized token counts of words with TASA standardized frequency indices (SFIs) below 40, and below 50, and normalized type counts of words with TASA SFIs below 40, and below 502. Second, the one feature with a high negative loading for this dimension was the average per-passage TASA SFI. The negative loading for this feature means that passages with high average SFIs will tend to score lower on this dimension, while passages with low average SFIs will tend to score higher. Thus, the dimension yields lower scores for passages with low vocabulary demand, and higher scores for passages with high vocabulary demand. Consequently, this dimension is labeled the Vocabulary Difficulty Dimension. Dimension #7: Negation. The seventh dimension yielded high positive loadings for synthetic negations (e.g., no, neither, nor), adversative conjuncts and negative adverbs. Consequently, this dimension was labeled the Negation Dimension. Scores defined as linear combinations of these feature clusters provided the independent variables considered in subsequent investigations. Study 2: Evaluating Text Genre Effects Genre effects are evaluated for ten features expected to be strongly related to variation in text complexity. Selected features include four measures of vocabulary difficulty, two measures of syntactic complexity, three measures of academic orientation, and one measure of topic development. Results are summarized in Table 4. The column labeled b1 confirms that, as expected, each of the selected features varies with GL in the expected direction. That is, on average, GL increases with average word length, average sentence length, average number of clauses per sentence, average frequency of nominalizations, 19
average frequency of abstract nouns, and average paragraph length. Similarly, on average, GL decreases with average concreteness rating (obtained via the MRC Psycholinguistic Database, see Coltheart, 1981) and with average word frequency as determined from any of three different word frequency (WF) indices: the TASA Word Frequency (WF) Index (Zeno, et al., 1995), the Lexile WF Index (Stenner, et al., 2006) and the ETS WF Index3 Table 4 also shows that the null hypothesis of equal intercepts (i.e., H0: 2 0 ) can be rejected for all ten features, and the null hypothesis of equal slopes (i.e., H0: 3 0 ) can be rejected for six of the ten features. Bias estimates obtained via Equation 2 are also provided. Note that all of the features exhibited positive bias for informational texts and negative bias for literary texts. These results strongly support the following conclusions from Sheehan et al. (2008a, 2008b, 2009): (1) many popular measures of text variation function differently within informational and literary texts, and (b) text complexity models that fail to account for these effects run the risk of generating predicted GL classifications that are too high for informational texts and too low for literary texts. Table 4 Model Coefficients, Significance Probabilities and Expected Genre Biases for Measures of Vocabulary Difficulty, Syntactic Complexity, Academic Orientation, and Topic Development Feature
b3
Bias(Inf) in GLs
Bias(Lit) in GLs
b1
b2
Avg. Word Length (ls)
84.33 ***
+12.97 **
- 29.60 *
+ 0.67
- 0.53
Avg. TASA WF
- 0.87 ***
-18.75 **
+ 0.33 **
+ 0.22
- 0.18
Avg. Lexile WFa
- 7.49 ***
- 10.99 *
+ 3.42 *
+ 0.40
- 0.32
Avg. ETS WF
- 0.70 ***
- 2.55 *
+ 0.01 ns
+ 0.73
- 0.58
Avg. Sent. Length (lw)
17.84 ***
+ 6.80***
- 5.06 ***
+ 0.39
- 0.31
Avg. Clauses per
12.85 ***
+ 5.49*
- 3.17 *
+ 0.30
- 0.24
-1.33 ***
0.12 ns
+ 0.59
- 0.47
Vocabulary Difficulty
Syntactic Complexity
Sentence Academic Orientation Nominalizations
3.44 ***
20
Feature Abstract Nouns Avg. Concreteness
b1 3.12 *** -76.71 ***
b3 0.71 ns
Bias(Inf) in GLs + 0.54
Bias(Lit) in GLs - 0.43
10.11 *
- 15.21 ns
+ 0.35
- 0.28
+ 5.56 **
- 2.75 *
+ 0.35
- 0.28
b2 -1.91 ***
Rating Topic Development Avg. Par. Length (lw)
8.30 ***
Note. WF = Word Frequency, ls=log syllables, lw = log words. *** p < 0.001, ** p < 0.01, * p < 0.05.
Figures 1 and 2 provide a series of graphical displays designed to further illuminate these results. Figure 1 focuses on the average sentence length feature. Two plots are shown. The top plot shows differences in the distribution of average sentence length values for informational and literary texts selected from the SourceRater Training Corpus. The bottom plot shows the impact of those differences when GL variation is also considered. Looking first at the top plot, note that the literary distribution is shifted to the left relative to the informational distribution. This suggests that, consistent with expectations, the texts with the shortest sentences tend to be literary. Turning to the bottom plot, note that a similar shift is visible, i.e., the literary trend line begins at a lower average sentence length score relative to the informational trend line. The bottom plot also illustrates an unexpected difference: even though the two trend lines start at different places, they each wind up at the same place. That is, while average sentence length differs dramatically for informational and literary texts at the lowest GLs, similarly large differences are not present at the highest GLs. Since the two trend lines start at different places, yet eventually wind up at the same place, statistically different slope parameters are needed to accurately explain variation across the GLs. A secondary effect is that the literary curve appears above the informational curve throughout a large portion of the data range. Thus, in many cases, a given value of the Average Sentence Length feature is indicative of a higher complexity level if the text in question is a literary text, and a lower complexity level if the text in question is an informational text. Table 4 confirms that these differences are significant at p < 0.001.
21
0.20 0.10 0.0
0.05
Proportion
0.15
Literary Informational
0.8
1.0
1.2
1.4
1.6
Average Sentence Length (log words)
6
8
Informational
4
Average Grade Level
10
Literary
0.8
1.0
1.2
1.4
1.6
Average Sentence Length (log words)
Figure 1. Distribution of average sentence length scores for informational and literary texts (top) and trends in Average Grade Level plotted conditional on Average Sentence Length (bottom). To appreciate the practical implications of these results it is useful to note that any model that includes the Average Sentence Length feature as a predictor without also accounting for genre effects will tend to yield predictions that fall between the two curves. Thus, resulting GL predictions will tend to be too high for informational texts (positive bias) and too low for literary texts (negative bias). Figure 2 shows that a similar pattern holds when vocabulary difficulty is estimated via the ETS Word Frequency Index. That is, consistent with expectations, the texts with the largest proportions of extremely familiar words tend to be literary as opposed to informational. But certain unexpected trends are also evident. For example, note that that the literary curve appears above the informational curve throughout the entire observed range of the data. This 22
confirms that a given value of the average ETS Word Frequency feature is indicative of a higher complexity level if the text in question is a literary text, and a lower complexity level if the text in question is an informational text. Lee (2001) suggested that this difference may be due to the fact that literary texts frequently employ common words in unfamiliar ways. The practical significance of this finding can be appreciated by noting that any model that fails to account for genre effects will tend to yield predictions that fall between the two trend lines. Thus, once again, text complexity classifications will be too low for literary texts and too high for informational texts.
0.10
0.15
Informational
0.0
0.05
Proportion
0.20
Literary
55
60
65
Average ETS Word Frequency
Literary
8 6 4
Average Grade Level
10
Informational
55
60
65
Average ETS Word Frequency
Figure 2. Distribution of average ETS Word Frequency scores for informational and literary texts (top) and trends in average Grade Level plotted conditional on average ETS Word Frequency scores (bottom).
23
Study 3: Investigating Alignment with Targeted Text Complexity Standards In accordance with the genre analyses summarized above, SourceRater was constructed to include two independent prediction models: one optimized for application to informational texts, and one optimized for application to literary texts. This study examines the degree of alignment between SourceRater’s GL predictions, and corresponding GL classifications provided by expert human raters. Two sets of results are reported: training results and validation results. Training passages were selected from the training corpus summarized in Table 1. Validation passages were selected from the validation corpus summarized in Table 2. As was noted earlier, the human GL classifications provided for the training passages were developed to reflect the published reading standards in 17 different states, and the human GL classifications provided for the validation passages were developed to reflect the new text complexity standards specified in the Common Core (CCSSO, 2010). The training phase of the analysis considered fifteen candidate predictors: the seven dimension scores defined in Study 1, and a set of eight additional features that were not included in the PCA because they required accurate paragraph segmentation information. This latter set included six measures of referential cohesion, and two measures of topic development. The referential cohesion features provide the average number of sentences classified as exhibiting lexical overlap with the preceding sentences within a paragraph. Individual measures differ with respect to whether overlap is calculated with or without stemming, and whether the look-back window includes 1, 2 or 3 preceding sentences.4 McNamara et al. (2010) argued that these particular measures constitute the “most discriminative” approach for distinguishing texts with low and high levels of referential cohesion. The best model for literary texts included four of the seven dimension scores, a measure of referential cohesion (calculated with stemming and with consideration of 3 previous sentences) and a measure of topic development (the normalized log length of the longest paragraph). The best model for informational texts included all of the above features except for the referential cohesion measure. The regression coefficients estimated for each model are summarized in Table 5.
24
Table 5 Regression Coefficients for Genre-specific Prediction Models Coefficients Informational Model
Dimension Syntactic Complexitya
Literary Model
0.39 **
0.83 ***
0.56 ***
0.44 ***
0.86 ***
0.52 **
Negation
0.22 *
0.30 **
Development
2.84 **
2.24 **
Degree of Referential Cohesionb
-0.73 ns
-2.65 ***
Semantic Difficultya a
Degree of Academic Orientation a
Note. Dependent variable = Grade Level. a Estimated as a linear combination of multiple correlated features. b Estimated with Stemming = Yes and look-back window = 3. * p < 0.05. ** p < 0.01. *** p < 0.001, ns = not significant at alpha = 0.05 The coefficients in Table 5 provide additional evidence of the need for distinct complexity models for informational and literary texts. The table shows, for example, that the referential cohesion effect is very strong when only literary passages are considered (p < 0.001), but is not even significant when only informational passages are considered (p > 0.05). Similarly, the SourceRater Syntactic Complexity Score is very strong when only literary passages are considered (p < .001) but is less strong when only informational passages are considered (p < .01). These differences suggest that the patterns of text variation that are indicative of lower or higher levels of text complexity are not necessarily the same for informational and literary texts. The utility of SourceRater’s genre-specific prediction equations relative to the goal of predicting GL variation in the training corpus is summarized in Table 6. In order to provide a basis for interpreting the results, the Table also presents a similar evaluation for scores obtained via the Flesch-Kincaid GL Formula, and for scores obtained via the Lexile Analyzer for Reading available at http://lexile.com/analyzer/. Two different evaluation criteria are shown: the correlation between human ratings of text GL and corresponding model-based predictions; and genre bias estimated via Equation 2.
25
Results confirm that each of SourceRater’s genre-specific prediction models yielded fairly high correlations with human ratings: the correlation for informational texts was 0.81; the correlation for literary texts was 0.78. By contrast, application of the Flesch-Kincaid GL Score to the same texts yielded somewhat lower correlations of 0.78 for informational texts, and 0.63 for literary texts. Scores obtained via the Lexile Analyzer also yielded lower correlations: 0.73 for informational texts and 0.63 for literary texts. Table 6 Summary of Validity Results, by Genre, for Three Different Text Complexity Models Evaluated on 548 Passages Selected from High-Stakes State Reading Assessments
Genre/Model
Correlation with Human GL Classifications
Bias (in GLs)
Informational Texts Flesch-Kincaid GL Score
0.78 ***
+ 1.27
Lexile Score
0.73 ***
+ 0.66
SourceRater GL Score
0.81 ***
0.00
Flesch-Kincaid GL Score
0.63 ***
- 1.05
Lexile Score
0.63 ***
- 0.54
SourceRater GL Score
0.78 ***
0.00
Literary Texts
Note. GL = Grade level. *** p < .001. Table 6 also lists the bias results obtained for each model. Results suggest that, on average, text complexity scores obtained via the Flesch-Kincaid GL Score or the Lexile Framework tend to be too high for informational texts and too low for literary texts. Figure 3 provides a series of graphical displays designed to further illuminate these results. Three plots are provided. The top plot compares mean GL classifications generated via the Flesch-Kincaid GL formula to corresponding mean GL classifications provided by human raters. To illustrate possible genre effects, separate trend lines are plotted for informational and literary passages. The resulting trend lines show that, on average, Flesch-Kincaid GL scores generated for informational passages tend to be higher than those provided by human 26
raters, while those generated for literary passages tend to be lower. Table 6 shows that these biases amount to a positive error of + 1.27 GLs for informational passages, and a negative
10 8 6 4
Flesch-Kincaid Grade Level
12
error of –1.05 GLs for literary passages.
2
Literary Informational
2
4
6
8
10
12
1000 800 600
Lexile Score
1200
Human Grade Level Judgment
Literary Informational
2
4
6
8
10
12
8 6 4
SourceRater Grade Level
10
12
Human Grade Level Judgment
2
Literary Informational
2
4
6
8
10
12
Human Grade Level Judgment
Figure 3. Mean complexity scores plotted conditional on Human GL Judgments. The middle plot shows that a similar result holds when scores are generated via the Lexile Framework. That is, compared to ratings provided by human raters, scores obtained via the Lexile Framework tend to be higher for informational passages, and lower for 27
literary passages. Table 6 shows that these biases amount to a positive error of +0.66 GLs for informational texts, and a negative error of -0.54 GLs for literary texts. The bottom plot shows that similar bias patterns are not present when SourceRater is used to generate GL classifications. That is, as was previously indicated in Table 6, mean scores calculated from SourceRater’s GL predictions are unbiased with respect to genre. Consequently, as is shown in Figure 3, SourceRater’s GL predictions are more closely aligned with GL classifications designed to reflect targeted text complexity standards. Texts selected from the independent validation corpus were also evaluated. Results are summarized in Table 7. Because the independent validation corpus included a much smaller number of texts, correlations are estimated using Spearman’s rho. The table shows that, once again, GL predictions generated via the SourceRater System are more highly correlated with human GL classifications than are those obtained via either of the other approaches. In particular, the correlation between SourceRater scores and human GL classifications provided for informational texts was rho = 0.82, while that for literary texts was rho = 0.66. By contrast, corresponding Flesch-Kincaid and Lexile correlations were slightly lower for informational texts (rho ranges from 0.71 to 0.73) and much lower for literary texts (rho ranges from 0.33 to 0.39). Bias estimates are also listed. These were obtained using Equation 2, except that, in the case of Lexile Scores, the Lexile to GL translation function given in Appendix A of the Common Core Standards was used to transform each Lexile score to a GL scale before applying Equation 2. We consider the results listed for the SourceRater System first. These suggest that SourceRater’s GL predictions tend to be higher than those given in the new Standards. This result was expected since SourceRater is currently trained to reflect the GL expectations of the average state, while the Common Core GL classifications are intended to raise all states to the level of the most challenging state. Thus, the results in Table 7 suggest that, compared to previous standards, the new standards have raised expectations by slightly more than one GL for informational texts, and slightly less than one GL for literary texts. Bias results are also listed for the Flesch-Kincaid GL formula and the Lexile Framework. Consistent with earlier results, the results in Table 7 suggest that both the Flesch-Kincaid GL score and the Lexile Framework tend to underpredict the difficulty of literary texts. 28
Table 7 Summary of Validity Results, by Genre, for Three Different Text Complexity Models Evaluated on 34 Texts Selected from Appendix B of the Common Core Standards Genre/Model
Correlation with Human GL Classifications
Bias (in GLs)a
Informational Texts Flesch-Kincaid GL Score
0.71 **
0.71
Lexile Framework
0.73 **
- 0.21
SourceRater GL Score
0.82 ***
1.65
Literary Texts Flesch-Kincaid GL Score
0.39 ns
- 2.03
Lexile Framework
0.33 ns
- 2.38
SourceRater GL Score
0.66 **
0.88
Note. GL = Grade level. a Bias estimates for the Lexile Framework were obtained after first using the conversion table listed in Appendix A of the Common Core Standards to convert scores expressed on the Lexile Scale to scores expressed on a GL scale. *** p < .001, ** p < .01, * p < .05, ns = not significant at alpha = .05 The scatter plots in Figures 4, 5 and 6 can help us interpret these results. Figure 4 compares SourceRater’s GL predictions to the GL classifications given in the Standards. Dotted lines indicate a 3 GL band above and below the targeted GL specified in the standards. The plots confirm that SourceRater’s GL predictions track those given in the standards, particularly for informational texts. Figures 5 and 6 provide similar sets of comparisons for the Flesch-Kinkaid GL Score and the Lexile Reading Score. The plots confirm that these alternative approaches are less successful at recovering the classifications given in the Standards, particularly for literary texts.
29
Although the results in Table 7 and Figure 4 are encouraging, analyses of additional Common Core texts are needed. These are in progress and will be reported in a future study. Resulting information will be used to adjust SourceRater’s informational and literary prediction equations so that they are optimally reflective of the complexity specifications given in the new standards.
10 5 0
SourceRater GL
15
Informational Texts (n = 17)
0
5
10
15
Common Core GL
10 5 0
SourceRater GL
15
Literary Texts (n = 17)
0
5
10
15
Common Core GL
Figure 4. Scatter plot of SourceRater GL predictions vs. Common Core GL classifications for informational texts (top) and literary texts (bottom).
30
10 5 0
Flesch-Kincaid GL
15
Informational Texts (n = 17)
0
5
10
15
Common Core GL
10 5 0
Flesch-Kincaid GL
15
Literary Texts (n = 17)
0
5
10
15
Common Core GL
Figure 5. Scatter plot of Flesch-Kincaid GL predictions vs. Common Core GL classifications for informational texts (top) and literary texts (bottom).
31
1600 1200 600 800
Lexile Score
Informational Texts (n = 17)
0
5
10
15
Common Core GL
1200 600 800
Lexile Score
1600
Literary Texts (n = 17)
0
5
10
15
Common Core GL
Figure 6. Scatter plot of Lexile Scores vs. Common Core GL classifications for informational texts (top) and literary texts (bottom).
32
In addition to providing feedback about the overall GL of a text, the SourceRater system also provides a number of graphical displays designed to help users identify and interpret the observable features of text that contribute to complexity variation. A sample display is shown in Figure 7. The display presents a SourceRater analysis of a candidate literary text that, at one point, was being considered for use on a grade 4 reading assessment. The overall predicted GL of the text is listed at the top of the chart. Since the candidate text is literary, the prediction is generated via SourceRater’s Literary Model. Note that the predicted GL of 7.0 is three grade levels above the targeted GL. This suggests that one or more of the text’s dimension scores is likely to be more typical of higher GL texts than of grade 4 texts. A series of horizontal bar charts illustrate differences between the dimension scores calculated for the candidate text and the distribution of those scores in the set of all literary texts in the SourceRater Training Corpus. Each chart focuses on one of five possible dimensions: the Academic Dimension, the Vocabulary Dimension, the Sentence Complexity Dimension, the Topic Development Dimension (also called the Paragraph Length Dimension), and the Lexical Cohesion Dimension. Individual charts compare the dimension scores calculated for the candidate text (plotted as a vertical line) to the range of variation observed for relevant sets of passages selected from the corpus (e.g., grade 3 literary passages, grade 4 literary passages, grade 5 literary passages, and so on). Ranges indicate the middle 80% of the observed data. The top chart shows, for example, that 80% of the grade 4 literary passages in the SourceRater Training Corpus had academic scores that fell within the range indicated by the blue bar plotted at grade 4 on the Academic chart. This information is interpreted as follows: (1) For two of the dimensions, i.e., the Vocabulary Dimension and the Paragraph Length Dimension, scores calculated for the candidate text are on target, i.e., they appear to be consistent with expectations for a grade 4 literary text. Thus, users interested in modifying the text to achieve better alignment with grade 4 complexity expectations are advised not to change any of the text’s Vocabulary features, or any of its Paragraph Length features. (2) For two other dimensions, i.e., the Academic Dimension and the Syntactic Complexity Dimension, scores calculated for the candidate text are too high, i.e., they fall 33
outside the range of variation expected for a grade 4 literary text. Thus, users interested in modifying the text to achieve better alignment with grade 4 complexity expectations are advised to consider modifying one or more of the text’s Academic features, and one or more of its Syntactic Complexity features. (3) The display also shows that the text’s standing on the Lexical Cohesion dimension is marginal. In particular, while the calculated cohesion score falls within the 80% range indicated by the blue bar at grade 4, it is still much lower than a typical grade 4 text. This suggests that a limited number of cohesion modifications might also help to bring the estimated GL of the text down to the target GL.
Figure 7. A SourceRater analysis of a candidate literary text for a grade 4 reading assessment. Discussion This paper demonstrated that many existing approaches for automatically assessing text complexity are subject to three limitations: inadequate construct coverage, overly narrow criterion variables, and inappropriate treatment of genre effects. Novel approaches
34
for addressing each limitation were introduced. Key findings are summarized below. Following that we discuss implications and directions for additional research. Technique #1: Ensuring Adequate Construct Coverage
The current results suggest that multidimensional techniques applied to large corpora can help researchers define novel measures of text variation that are useful for broadening the constructs assessed by automated text analysis systems. Four measures developed via the recommended technique were found to be predictive of human judgments of text complexity: the degree of academic orientation detected in a text, the syntactic complexity level of a text, the semantic difficulty of a text, and the degree of negation detected in a text. These results may help researchers develop automated measures of text complexity that are more reflective of the complexity constructs targeted by state reading standards. Technique #2: Defining Criterion Variables
Every modeling application requires a start-up set of data for use in training and validation. As a first step in developing data for use in SourceRater training and validation, we clarified our definition of a true GL classification as one that meets each of the following criteria: (a) the classification is based on published reading standards which, in turn, are based on published research; and (b) the classification has been reviewed by experienced teachers with first-hand knowledge of applicable state standards. This definition pointed us toward a novel corpus development technique: selecting passages from standards-based reading comprehension assessments targeted at students in specific U.S. GLs. The GL classifications developed for such passages are consistent with the definition listed above because (a) each is based on published reading standards, and (b) each has been reviewed by one or more experienced teachers. It is also useful to note that, in many cases, GL classifications have also been validated via response data collected from hundreds of examinees. Analyses suggest that this new approach for defining criterion variables can lead to complexity models that are more closely aligned with the GL expectations specified in targeted complexity standards.
35
Technique #3: Accounting for Text Genre Effects
Although most existing text analysis systems tend to ignore genre effects, this paper has demonstrated that (a) many important linguistic features function differently within informational and literary texts, and (b) these differences are large enough to yield practically significant genre biases. For example, analyses revealed that the popular FleschKincaid GL Score tends to over predict the complexity of informational texts by about 1.28 GLs, while simultaneously under predicting the complexity of literary texts by about -1.05 GLs. Analyses also suggested that, since the observed biases can be traced to fundamental differences in the syntactic and semantic characteristics of informational and literary texts, it’s likely that any model that incorporates the same or similar features without accounting for genre effects will exhibit similar bias patterns. Implications for Organizing Instruction and Assessment
Learning Progressions (LPs) have been proposed as a way to organize instruction and assessment to better support learning. Resnick et al. (2008) explain this approach as follows: “The new idea is to set a graduated set of goals for instruction that describe a learning progression: an ordered sequence of goals that a student would be expected to meet
if he or she was successful in a well-conducted instructional program.” Research summarized above suggests that improved methods for characterizing the complexity levels of texts could help educators develop learning progressions that are more closely tied to the aspects of text variation expected to be more or less problematic for readers with differing reading proficiency profiles. SourceRater’s innovative estimation techniques, and its user-friendly graphical displays are designed to help teachers, curriculum developers and other educators work more efficiently when developing such progressions. Directions for Additional Research
Although the results summarized above are promising, additional research is needed in several areas. Three types of additional studies are planned: (1) studies focused on the development of new and improved features; (2) studies focused on the development of feedback displays designed to help users understand and interpret text complexity information; and (3) studies focused on the question of whether remaining uncertainty is due to lack of precision in the available human classifications, or to limitations of the construct 36
coverage afforded by current feature sets. Progress in these areas will enable us to develop an enhanced version of the SourceRater System that is even more effective at helping educators ensure that all students leave high school equipped with the reading skills needed to be successful in college and careers.
37
References
ACT, Inc. (2006). Reading between the lines: What the ACT reveals about college readiness in reading. Iowa City, IA.
American Institutes for Research (2008). Reading framework for the 2009 National Assessment of Educational Progress. Washington, DC: National Assessment
Governing Board. Baretta, L., Tomitch, L.M.B., MacNair, N., Lim, V.K. & Waldie, K.E. (2009). Inference making while reading narrative and expository texts: An ERP study. Psychology & Neuroscience, 2(2), 137–145.
Beck, I. L., McKeown, M. G., & Worthy, J. (1995). Giving a text voice can improve students’ understanding. Reading Research Quarterly, 30(2), 220–238. Beck, I. L., McKeown, M. G., & Sinatra, G.M., & Loxterman, J.A. (1991). Revising social studies text from a text processing perspective: Evidence of improved comprehensibility. Reading Research Quarterly, 26, 251–276. Best, Floyd, & McNamara (2004, April). Understanding the fourth-grade slump: Comprehension difficulties as a function of reader aptitudes and text genre. Paper
presented at the meeting of the American Educational Research Association, San Diego, CA. Biber, D. (1986). Spoken and written textual dimension in English: Resolving the contradictory findings. Language, 62, 394–414. Biber, D. (1988). Variation across Speech and Writing. Cambridge, England: Cambridge University Press. Biber, D., Conrad, S., Reppen, R., Byrd, P., Helt, M., Clark, V., et al., (2004). Representing Language use in the University: Analysis of the TOEFL 2000 Spoken and Written Academic Language Corpus. (TOEFL Monograph Series, MS-25). Princeton, NJ:
ETS. Biber, D. Johansson, S., Leech, G., Conrad, S. & Finegan, E. (1999) Longman grammar of spoken and written English. Essex, England: Pearson Education Limited.
Breland, H. M., Jones, R. J., & Jenkins, L. (1994). The College Board Vocabulary Study. New York, NY: College Entrance Examination Board.
38
Britton, B., & Gulgoz, S. (1991) Using Kintsch's computational model to improve instructional text: Effects of repairing inference calls on recall and cognitive structures. Journal of Educational Psychology, 83, 329–345. Carroll, J. B., Davies, P., & Richmond, B. (1971). The American Heritage word frequency book. Boston, MA: Houghton Mifflin.
Carver, R.P. (1985) Measuring readability using DRP units. Journal of Reading Behavior, 17, 303–316.
Chall, J. S. & Dale, E. (1995). Readability Revisited – The new Dale-Chall readability formula. Cambridge, MA: Brookline Books.
Cleveland, W. S. (1979). Robust locally weighted regression and smoothing scatterplots. Journal of the American Statistical Association, 74, 829–836.
Coleman, M. and Liau, T.L. (1975). A computer readability formula designed for machine scoring, Journal of Applied Psychology, 60(2), 283–284. Coltheart, M. (1981). The MRC psycholinguistic database, Quarterly Journal of Experimental Psychology, 33A, 497–505.
Council of Chief State School Officers (2010, June). Common Core State Standards. Coxhead, A. (2000) A new academic word list. TESOL Quarterly, 34, 213–238. Crossley, S.A., Greenfield, J., & McNamara, D.S. (2008). Assessing text readability using cognitively-based indices. TESOL Quarterly, 42(3), 475–493. Davidson, A. and Kantor, R. N. (1982). On the failure of readability formulas to define readable text: A case study from adaptations. Reading Research Quarterly, 17, 187– 209. Dale, E. & Chall, J.S. (1948). A Formula for Predicting Readability. Educational Research Bulletin, 27, 11–20.
DuBay, W.H. (2004). The Principles of Readability. Costa Mesa, CA: Impact Information.Retrieved from http://www.impactinformation.com/impactinfo/readability02.pdf Finn, P. J. (1978). Word frequency, information theory, and cloze performance: A transfer theory of processing in reading. Reading Research Quarterly, 13, 508–537. Flesch, Rudolf F. (1948). A new readability yardstick, Journal of Applied Psychology, 32, 221–233. 39
Fry, E. (1968). A readability formula that saves time. Journal of Reading, 11, 513–516. Graesser, A.C., McNamara, D.S., & Louwerse, M. (2003). What readers need to learn in order to process coherence relations in narrative and expository text. In A.P. Sweet & C. E. Snow (Eds.), Rethinking reading comprehension (pp. 82–98). New York, NY: Guilford Press. Graesser, A. C., McNamara, D.S., Louwerse, M., & Cai, Z. (2004). Coh-Metrix: Analysis of text on cohesion and language. Behavioral Research, Methods, Instruments and Computers, 36, 193–202.
Gunning R. (1952). The technique of clear writing. New York, NY: McGraw-Hill International Heilman, M., Collins-Thompson, Callan, J. & Eskenazi, M. (2007) Combining lexical and grammatical features to improve readability measures for first and second language texts. Proceedings of NAACL HLT 2007, 460–467. Heilman, M., Collins-Thompson, & Eskenazi, M. (June, 2008) An Analysis of Statistical Models and Features for Reading Difficulty Prediction Proceedings of the 46th
Annual Meeting of the ACL, 71–79, Columbus, OH. Heibert, E.H. (2009). Interpreting Lexiles in Online Contexts and with Informational Texts. Seattle, WA: Apex Learning, Inc. Holland, V. M. (1981). Psycholinguistic Alternatives to Readability Formulas, Washington, DC: American Institutes for Research. Kincaid, J.P., Fishburne, R.P, Rogers, R.L. & Chissom, B.S. (1975). Derivation of new readability formulas (automated readability index, Fog count and Flesch reading ease formula) for navy enlisted personnel. (Research Branch Report 8-75.)
Millington, TN: Naval Technical Training, U. S. Naval Air Station, Memphis, TN. Kintsch, W. (1988). The use of knowledge in discourse processing: A constructionintegration model. Psychological Review, 95, 163–182. Kintsch, W. & Yarbrough, J. C. (1982). Role of rhetorical structure in text comprehension. Journal of Educational Psychology, 74, 828–834.
Klare, G. (1984). Readability. In P. D. Pearson (Ed.) Handbook of reading research. (pp.681–744). New York, NY: Longman.
40
Kukan, L., & Beck, I. L. (1997). Thinking aloud and reading comprehension research: Inquiry, instruction, and social interaction. Review of Educational Research. 67, 271–299. Lee, D. Y. W. (2001). Defining core vocabulary and tracking its distribution across spoken and written genres. Journal of English Linguistics. 29, 250–278. Leys, M., Fielding, L., Herman, P., & Pearson, P. D. (1983). Does cloze measure intersentence comprehension? A modified replication of Shanahan, Kamil, and Tobin. In J. A. Niles & L. A. Harris (Eds.), Searches for meaning in reading/language processing and instruction: Thirty-second yearbook of the National Reading Conference (pp. 111–114). Rochester, NY: National Reading Conference. Lu, X. (in press). A corpus-based evaluation of syntactic complexity measures as indices of college-level ESL writers’ language development. TESOL Quarterly, 44(4). McCarthy, P., Graesser, A. C., & McNamara, D. S. (2006, July). Distinguishing genre using Coh-Metrix indices of cohesion. Poster presented at the annual meetings of the
Society for Text and Discourse, Minneapolis, MN. McNamara, D.S., Louwerse, M.M., McCarthy, P.M. & Graesser, A.C. (2010). Coh-Metrix: Capturing linguistic features of cohesion, Discourse Processes, 47(4), 292-330. Pearson, P. D, and Hamm, D. N., (2005). The assessment of reading comprehension: A review of practices—past, present and future. In S.G. Paris and S. A. Stahl (Eds.), Children’s Reading Comprehension and Assessment (pp. 13–70). Mahwah, NJ:
Lawrence Erlbaum Associates. Powers, R.D., Sumner, W.A., and Kearl, B.E. (1958). A recalculation of four adult readability formulas, Journal of Educational Psychology, 49(2), 99–105. Rasch, G. (1960). Probabilistic Models for Some Intelligence and Attainment Tests. Copenhagen, Denmark, The Danish Institute for Educational Research. Reppen, R. (2001). Register variation in student and adult speech and writing. In S. Conrad and D. Biber (Eds.), Variation in English: Multi-dimensional studies (pp. 187–199). London, England: Longman. Resnick, L., Stein, M.K. & Koon, S. (2008). Standards Based Reform: A Powerful Idea Unmoored. In. R.D. Kahlenberg (Ed.), Improving on No Child Left Behind. New York,NY:Century Foundation Press. 41
Sawyer, M. H. (1991). A review of research in revising instructional text. Journal of Reading Behavior, 23(3), 307–333.
Schmeiser, C.B. & Welch, C.J. (2006). Test development. In R. L. Brennan (Ed.) Educational measurement (pp. 307–354). Westport, CT: American Council on
Education and Praeger Publishers. Shanahan, T., Kamil, M. L., & Tobin, A. W. (1983). Cloze as a measure of intersentential comprehension. Reading Research Quarterly, 17, 229–255. Sheehan, K.M., Kostin, I., & Futagi, Y. (2009). U.S. Patent No. 20090197225. Reading Level Assessment Method, System, and Computer Program Product for High Stakes Testing Applications. U.S. Patent and Trademark Office. Sheehan, K.M., Kostin, I., & Futagi, Y. (2008a, July). When do standard approaches for measuring vocabulary difficulty, syntactic complexity and referential cohesion yield biased estimates of text difficulty? Proceedings of the 30th Annual Meeting of the
Cognitive Science Society, Washington DC. Sheehan, K.M., Kostin, I., & Futagi, Y., (2008b, July). Reading level assessment for highstakes testing applications: A second look at variation due to differences in text genre. Paper presented at the Annual Meeting of the Society for Text and Discourse,
Memphis, TN. Sheehan, K.M., Kostin, I., & Futagi, Y. (2007, October). SourceFinder: A construct-driven approach for locating appropriately targeted reading comprehension source texts. Proceedings of the 2007 Workshop of the International Speech Communication Association, Special Interest Group on Speech and Language Technology in Education, Farmington, PA. Stenner, A. J., Burdick, H., Sanford, E., & Burdick, D. (2006). How accurate are Lexile text measures? Journal of Applied Measurement, 7(3), 307–322. Stenner, A. J. (1996, February) Measuring Reading Comprehension with The Lexile Framework , presented at the Fourth North American Conference on
Adolescent/Adult Literacy, Washington, DC Stenner, A. J., Horabin, I., Smith, D. R., & Smith, M. (1988). Most comprehension tests do measure reading comprehension: A response to McLean and Goldstein. Phi Delta Kappan, 79(10), 765–767.
42
Tabachnick, B. G., & Fidell, L. S. (2001). Using multivariate statistics. Boston, MA: Allyn & Bacon. van den Broek, P., Everson, M., Virtue, S., Sung, Y., & Tzeng, Y. (2002). Comprehension and memory of science texts: Inferential processes and the construction of a mental representation. In J. Otero, J. Leon, & A. C. Graesser (Eds.), The psychology of science text comprehension (pp. 131–154). Mahwah, NJ: Lawrence Erlbaum
Associates. Williamson, G.L. (2006). Aligning the journey with a destination: A model for K–16 reading standards. Durham, NC: Metametrics, Inc.
Zabrucky, K. M. & Moore, D. (1999). Influence of text genre on adults’ monitoring of understanding and recall. Educational Gerontology, 25, 691–710. Zeno, S. M., Ivens, S. H., Millard, R. T., & Duvvuri, R. (1995). The educator’s word frequency guide. Brewster, NY: Touchstone Applied Science Associates.
43
Notes 1
College and Career Ready was quantified as grade 12 since the Standards note that students should be reading at the CCR level by the end of high school.
2
Both token counts and type counts are included in order to account for differences in the extent to which rare words are repeated.
3
The ETS Word Frequency Index was developed from a large corpus of informational and literary texts targeted at students in grades 2 through 12. The corpus included more than 400 million words of running text. Statistical computations followed the methods described in Carroll, Davies, and Richman (1971), and in Breland, Jones, and Jenkins (1994).
4
Stemming refers to the process of treating inflected forms of a word, e.g., run and running, as equivalent. The look-back window specifies the number of preceding sentences to search when looking for overlapping words or word stems.
44