south of Kostomuksha are usually masked by noise at ARCESS; the recognized earth- quakes are located at the North Atlantic ridge (outside this map) and at ...
Automated Event Location by Seismic Arrays and Recent Methods for Enhancement by Manfred Joswig Tel Aviv University, Israel
Abstract This paper describes procedures to locate seismic events at regional distances by single seismic arrays. First it reviews the methods used for interactive analysis and compares their performance to that of single three-component stations. Then the paper focuses on automated location. Ten days of continuous operation ARCESS data are analyzed. They are evaluated by standard NORSAR routines of beamforming and f-k analysis, and by a complementary, independent approach. This approach utilizes pattern recognition (PR) and rule-based system (RBS) techniques to derive an automated bulletin from a subset of four array stations. The content of both lists, i.e., the ARCESS log of NORSAR and the new, PR-based list are combined to form a joint bulletin. Its enhanced quality is achieved by rules for consistency check or "pluralistic reasoning".
Introduction Seismic arrays are sensitive tools to detect and locate seismic events from local to teleseismic distances. They operate like phased arrays in radar surveillance (Whiteway, 1965) and were introduced to seismology in the 1960s (see Lay & Wallace, 1995). "Beamforming", i.e. the delay-and-sum of individual traces to a "beam" trace, offers signal-to-noise improvements approximately proportional to the square root of number of stations (Green et al., 1965). In automated event screening, the delay times are derived a priori for specific slowness values matching selected phases, and for all angles of incoming waves in, e.g., 30° increments. A more analytical description of array performance is obtained by the "array response" specifying the energy gain over the horizontal wavenumber k = (kx,ky) which unveils the sharpness of the main lobe and the position and amplitude of possible side lobes (Haubrich, 1968). The enhanced sensitivity of seismic arrays is crucial for the network of International Monitoring System (IMS) stations as determined in the Comprehensive Test Ban Treaty (CTBT). Tuned for regional monitoring, the high-frequency arrays of NORSAR like NORESS, ARCESS, FINESSA or GERESS reliably detect small earthquakes and explosions over thousands of kilometers distance and allow for event identification.
2
Event Location by Seismic Arrays The concept of seismic arrays is based on the propagation of plane waves over the array aperture causing coherent signals at all stations. Thus an array represents just one site for any attempt of location calculation despite its many stations. The utilized method equals that for single, three-component stations: The backazimuth points from station to event and constraints the direction while the S-P time yields a radius that determines the distance.
Fig. 1
Constraining the S-onset by f-k analysis (modified from Gestermann.,1993)
In an array, both parameters can be derived and confirmed by f-k analysis utilizing the spatial sampling of the wave field (Capon, 1969). This approach of wave number filtering allows for separation of signal and noise even when they cover the same frequency band. Fig. 1 shows the result of a sliding f-k analysis in 1 s windows over a regional seismogram; just the maximum slowness value is gives. The example exhibits a clear increase above 0.20 s/km once the first shear wave energy arrives resolving much of the ambiguity usually associated with S-onset determination on weak signals. In the "teleseismic window" from 30 – 90°, the slowness of P constantly decreases from 0.08 – 0.04 s/km with approximately linear slope which gives a second, independent estimate for the epicentral distance (Birtill & Whiteway, 1965).
3
Fig. 2 Testing on Common Azimuths for Pn, Pg, and Sg (from Harjes et al., 1993) The estimation of backazimuth also relies on the f-k analysis. Fig. 2 displays the results for another regional event where maxima are given over k by contour lines; the chosen frequency bands depend on phase type. Backazimuth and slowness are determined per single phase allowing for consistency checks on common azimuths and correct order of phase arrivals. Thus even complex seismograms composed by overlay of different events may be resolved with ease. The error limits for the estimated parameters can be derived from the width of the main lobe in the array response which resembles the distribution of stations over the aperture (Harjes & Henger, 1973). Two constraints for optimization contradict each other: Achieving significant time differences within the array demands large aperture, while maximizing signal coherency asks for small aperture. The chosen compromise depends on the aim of monitoring and the utilized signals: In teleseismic monitoring, signal frequencies extend up to 1 Hz and the matched array designs of LASA, NORSAR, or GRF exhibit spatial dimensions of several tens to hundreds of km. For regional and local monitoring, the focus is on high-frequency designs up to 30 Hz which corresponds to aperture extensions of one to five km like for ARCESS. Specific tasks like the near-local surveillance of critical target areas may even ask for just 100 m aperture (Bartal et al., 2000).
4
The precision of phase picking is limited by the sampling interval yielding some few degrees for error margin of the backazimuth in high-performance arrays. The precision could be increased to subsampling resolution by interpolation techniques, e.g., the cross spectral analysis (Scherbaum & Wendler, 1986); however, these techniques are not in routine use to date. For any single 3-C station, the backazimuth is determined by the trajectory of particle motion during the first onset, while S is the first appearance of significant signal amplitudes at the horizontal traces. Both estimates are error prone in noise: The backazimuth as the ratio of horizontals suffers from small angles of incidence in P, while S does not exhibit the clear, linear polarization above 1 Hz that would distinguish it from noise or P coda (Menke et al., 1990; Roberts & Christoffersson, 1990; Menke & Lerner-Lam, 1991; Klumpen & Joswig, 1993; Der et al., 1993). Additionly, Buchbinder & Haddon (1990) report on up to 40° deviation of P backazimuth from the direction to the epicenter. In larger investigations, Jarpe & Dowla (1991) and Walck & Chael (1991) determine a typical error of ±6°, given that the optimum frequency band is found and the signal-to-noise ratio (SNR) is sufficiently large. Due to the differences in approach and in the utilized amount of information, large discrepancies exist in the performance of array versus 3-C location results. Suteau-Henson (1991), Kvaerna & Ringdal (1992), Christoffersson & Roberts (1996) compare both methods and consistently find the array location superior to 3-C location. Reports on array locations are given by Ringdal & Husebye (1982), Mykkeltveit & Bungum (1984), Der et al. (1990), Cansi et al. (1993), and Jost et al. (1996), while the performance of 3-C approaches is described by Magotra et al. (1987), Ruud et al. (1988), Roberts et al. (1989), Cassidy et al. (1990), Ruud & Husebye (1992), and Tarvainen (1992). Thus deriving event locations from single 3-C stations is largely an academic exercise while the results of array processing truly enhance the seismic monitoring of surrounding regions. Rabinowitz & Joswig (1994) find the detection and locations results of one high performance, digital, tripartite array comparable to six analog network stations distributed over 5000 km2 in Northern Israel. The evaluation of array traces was reliably possible down –12 dB below the signal-to-noise ratio at comparable network traces due to signal correlation and the backazimuth and slowness constraints (see Figs. 1 and 2). Some principle restrictions remain from the single station approach that makes even the most advanced array inferior to network locations: (I) Depth can not routinely be determined which restricts array locations to the evaluation of epicenters; only additional depth phases like pP could constraint the hypocenter (Bowers, 1999; Pearce, 1999). (II) The location uncertainty arises by constant azimuthal error limits, thus it
5
increases linearly with distance. (III) The array measurement is affected by local inhomogeneities of the crust beneath its aperture (Glover & Alexander, 1969; Flatte & Wu, 1988), while a network most probably averages out some different effects. The last shortcoming results in the concept of time delay corrections to the plane wave propagation which also compensate for elevation differences (Berteussen, 1974). Another approach introduces slowness corrections depending on the approximately determined source region (Harjes et al., 1994; Schweitzer, 1995). Besides this "array calibration", further improvements in location accuracy are possible by the concepts of array relocation (Kvaerna & Ringdal, 1993) and non-linear master event correlation (Joswig & Schulte-Theis, 1994). Both approaches apply to restricted regions for which additional knowledge must be defined in terms of tuned parameter sets or representative seismograms. Finally, the combination of location results by different arrays closes the loop in our comparison of location methods: The arrays perform as single sites in a larger, possibly mixed network with single 3-C stations. The arrays provide the network location program with a full set of onset times, and attached slowness and backazimuth values that must be weighted in sophisticated ways (Bratt & Bache, 1988).
Automated Array Processing The high-frequency arrays of NORSAR like ARCESS are routinely evaluated by the RONAPP processing system (Mykkeltveit & Bungum, 1984). To date it consists of the three modules "Detection Processing" (DP) for STA/LTA triggering, "Signal Processing" (SP) to perform signal feature extraction, and "Event Processing" (EP) that associates phases, calculates location and plots the events (Fyen, 1996). The left part of Fig. 3 shows the flow of data and parameters; the "Generalized Beam Former" (GBF) at the third stage is an alternate location module that evaluates the joint phase report of all six NORSAR arrays (Kvaerna & Ringdal, 1996). Although different in detail, this scheme of data processing also applies to the Provisional International Data Center (pIDC) with modules like DFX or SigPro (IDC, 1999). In our study, the NORSAR listings for ten days of continuous recording (April 12 April 21, 1996) at ARCESS were analyzed. The initial beamforming weights the 25 ARCESS traces to produce 76 beams. On these beams, some twenty detections per hour are found by the STA/LTA. This averages to 480 phases per day; the detection was purposely set so sensitive not to miss any single phase.
6
Fig. 3 Signal flow in NORSAR processing (left) and for SparseNet processing (right)
Taking any phase detection as an event, however, would result in an unacceptably high number of false alarms. Instead, the declaration of an event demands one Pn/Pg and one S/Lg phase constrained by a time window dt of 240 s and by d? of 30° for azimuthal difference. Typically 30 events are formed per day, 3 phases are associated per event and 50 onsets are teleseismic, utilizing a total of 140 phases per day. Thus 340 phases or 70% of the initial 480 phases remain unassociated even when they report large amplitudes. Three typical errors remain despite the timing and azimuthal constraints: 1. If Sn and Lg are emergent, they will be missed regardless of SNR. Without them, no event can be declared although one might clearly see it. 2. Ghost events are declared by false alarms, sometimes with surprisingly large magnitude. This happens by the casual combination of single phases; if they are at the limits of dt, the erroneous results for distance and magnitude get large. 3. For mixed events, e.g. a sequence of quarry blasts with overlapping seismograms, phases are grouped incorrectly; this will cause wrong distances.
7
Fig. 4 displays examples for these processing errors by RONAPP in the 10-day testbed. For comparison, all six seismograms are shown at the same scale even though the fifth trace is clipped. All associated phases are given; RONAPP utilized all unprimed phases. The first trace got missed as Sn/Lg is emergent; the second case was excluded due to an additional Low-SNR-criterion. The two false alarms in traces three and four have associated magnitudes that would demand seismogram amplitudes as large as above. In the fifth trace, the detected first onset was ignored during phase association while in the sixth trace the 'early' Pn is in fact a teleseism P with 14.8 km/s apparent velocity from Hindu Kush with the same backazimuth as the regional event. Mc(100) 0.0 -0.5 -1.0
SNRST on single trace 5 : 1 (14 dB) 1.5 : 1 (3 dB) 0.4 : 1 (-8 dB) Table 1
SNRAB on array beam
expected performance
25 : 1 (28 dB) 7.5 : 1 (17 dB) 2 : 1 (6 dB)
complete without errors complete, with errors not complete, and errors
SNR and completeness thresholds Mc at ARCESS
In Fig. 5, the automated bulletin is resolved by magnitude versus distance and divided into four classes. Each class corresponds to some minimum, local SNR (BP 2-10 Hz) as listed in Table 1; Mc(100) is the completeness threshold specified at 100 km. Per class, the automated processing should meet the expected performance to effectively off-load the human analyst from some routine tasks. However, even in the highest class with Mc(100) = 0.0, two events were missed in ten days; every day 1 ghost event was created and 2 events were severely mislocated. All examples in Fig. 4 are from this class; the actual missed events had magnitude ML 1.2 at 306 km and ML 3.3 at 1293 km. In the next class with Mc(100) > -0.5, we found a daily error rate of 3 events missed, 3 ghost events and 4 mislocations. Results would get worse when either the local noise level is above the favorable conditions at ARCESS or when the array consists of less than 25 elements.
8
Fig. 4
Examples of types of errors that can be made in routine automated processing (Top – missed events, Middle – false alarms, Bottom – phase misidentification)
9
Fig. 5
Detection capability by distance achieved by RONAPP for the 10-day testbed and separation into performance classes by different completeness thresholds
SparseNet Processing The monitoring by pattern recognition in SparseNet originally stems from limitations when shrinking the number of array stations below, say, six sites. A common scenario is that funds do not support installation and operation of a conventional, dense array like ARCESS with 25 sites. The alternative, a so-called sparse array, consists of minimum 3 to 4 stations arranged as equidistant triangle with possible center site. For example, the BUG sparse array was set up to monitor the mining induced seismicity in the Ruhr district of NW Germany (Joswig, 1993); the potential benefit of the sparse array concept for CTBT monitoring has been investigated by Kvaerna (1992) and Kvaerna & Ringdal (1992).
10
To automate the seismogram processing in sparse arrays, the authors found most advantages of dense arrays either not existent or severely degraded: ? SNR is usually better for the best single station than for any reasonably weighted array beam. Optimal detection is achieved by voting on single traces instead of beamforming. ? The performance of f-k analysis for phase association is severely degraded due to the ambiguity by many side lobes caused by the insufficient sampling of the wave field. Also the maxima are very flat due to the marginal gain in SNR. Obviously, additional approaches for automated processing were necessary to benefit from the sparse array concept. Many of these approaches utilize the power of artificial intelligence (AI) techniques to stabilize signal processing in the decreased SNR (see Joswig, 1995a, 1996). These concepts result in a layered approach (Joswig, 1993) consisting of the modules: ? PR-detection based on recognizing full seismogram signatures from P onset to surface wave coda which are coded into sonogram patterns and shifted over the data sonogram (Joswig, 1990 and 1995b). This approach is realized in SONODET and described subsequently. ? RBS-voting to exclude the casual coincidence of noise bursts at different stations. This approach of COASSEIN is based on rules that check the SONODET messages for common event type (Joswig, 1995b) and will also be described below. ? Non-linear cross-correlation, calculated between array traces to determine relative delay times for backazimuth and slowness, and performed with available master events of known site to refine the locations (Joswig and Schulte-Theis, 1994). ? Three-component phase picking of P and S onsets, once again based on spectral images like sonograms and contour patterns (Klumpen and Joswig, 1993). The first two tasks are performed by modules SONODET and COASSEIN of the IASPEI shareware library contribution SparseNet (Joswig, 1999). Although both AI principles - subsymbolic PR and symbolic RBS - are utilized to enhance sparse array processing, the clear focus is on PR. This is different from the AI applications for dense arrays which concentrate on RBS (Searfus, 1989; Bache et al., 1990; Bratt et al., 1990; Bache et al., 1993). The same distinction holds for processing the incoherent seismograms of seismic networks. Sparse networks with up to six stations are successfully evaluated by PR (Leonard et al., 1999), while AI solutions for dense networks favor the RBS approach (Chiaruttini et al., 1989; Roberto & Chiaruttini, 1992). It is worth to explicitly stress this situation: the simple change in quantity of sites converts to a distinct "quality" (PR versus RBS) for preferred AI approaches in auto-
11
mated processing. This separation is shown in Fig. 6, it is between dense arrays and dense networks versus sparse arrays and sparse networks (Joswig, 1992). The reason is in the different availability of data: dense station distributions ease the parameter extraction, either by good SNR of neighboring stations or by beamforming and f-k analysis. However, the many parameters will contain mutual contradictions that must be resolved by sophisticated reasoning which is the essence of RBS. For few stations and low SNR, the derived parameters like P-onset will directly determine the location; the lack of redundancy prevents consistency checks. Hence any effort must be made to ensure reliable parameter extraction favoring PR applications.
Fig. 6
Monitoring of a fault zone with earthquakes (X) by dense and sparse array/network layouts of stations (? ) and preferred AI schemes for automated processing The application of SparseNet modules to the ARCESS data follows the processing scheme in the right part of Fig. 3. The stations ARC1, ARC3, and ARC6 are selected to form a sparse, tripartite array with ARA1 as the fourth, center station; the array aperture is an equidistant triangle of 1.5 km. The PR detection is performed by SONODET on single traces, the results are checked for array-wide coincidence by COASSEIN exploiting RBS principles.
SONODET The sonogram detector works on denoised, prewhitened spectrograms or "sonograms" to recognize the similarity or "fit" with predefined, adapted patterns by a sliding 2-D cross-correlation (Joswig, 1995b). It utilizes the signature of full event seismograms
12
from P onset to surface wave coda decay; the STA/LTA instead would trigger on each distinct amplitude increase. Fig. 7 shows from top to bottom the non-linearly scaled sonogram, the seismogram, the STA/LTA ratio, and the fit with the two selected patterns Kiruna_I, Kiruna_II. This source region association is correct as the signal originated from the Kiruna quarry region at 250 km distance (see Fig. 8).
Fig. 7
SONODET processing for a Kiruna quarry blast at 250 km distance from ARCESS (Top left – sonogram, Top right – noise statistics with frequency as in sonogram, Middle down – STA/LTA detector, Bottom – pattern fit by SONODET) SONODET was successfully applied to local data where the spectral shift of energy over time is a strong discriminant between earthquakes and noise bursts. For the regional seismograms at ARCESS, however, the situation was more difficult. In Fig. 7, the recorded wave train has nearly constant frequency content with virtually no surface wave energy in the lower frequency bands: the shape of the sonogram is close to a box. This feature remains valid for all types of signals except teleseisms; comparing it to sonograms of regional events in Western Europe and California, we suggest this
13
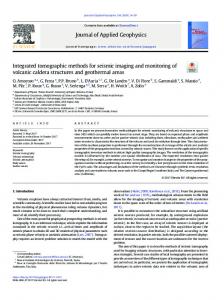
lack of low frequencies might be a distinctive feature of records in the Scandinavian Shield. Obviously, we have lost one of the assets for sonogram recognition. Another difficulty for PR comes from the fact that many source regions fall into the same distance range. Fig. 8 displays the most frequent clusters of Fennoscandian seismicity. Quarries from Kiruna, Kovdor, and the events east of Nikel, all have the same epicentral distance to ARCESS; the same is true for Paakkola and Khibiny. The blasts south of Kostomuksha are usually masked by noise at ARCESS; the recognized earthquakes are located at the North Atlantic ridge (outside this map) and at the Fjord area in northern Norway.
Fig. 8
18 months of seismicity in Fennoscandia (modified from Norwegian NDC)
14
SONODET will recognize this seismicity according to its pattern base. This pattern base must be tuned per region but stays constant for all array stations. Fig. 9 compiles the set of patterns used for this study. Note that we had to characterize the quarry regions Nikel, Kiruna and Khibiny by two patterns each to cover some fraction of variations caused by the delayed firing of multiple explosions. This heuristic scheme does, of course, not cover all cases of mixed quarry events where the number of shots, the time delays and the magnitude differences are free parameters. Nonetheless, this approach did enhance the PR results to the subsequently reported performance level. The source region Norwegian_Sea was so large that we had to select two patterns from distinct epicenters for sufficient characterization.
Fig. 9
Pattern set of SONODET at ARCESS for Fennoscandian seismicity
COASSEIN Once the detection lists of ARA1, ARC1, ARC3, and ARC6 are derived, COASSEIN as the second module in SparseNet performs the rule-based coincidence analysis (Joswig, 1995b, 1999). The rules will check on common source region in the SONODET results; they also evaluate any differences in reported onset time or magnitude. Achieving sufficient performance demands the resolution of many potential contradictions in the detection lists; the necessary strategies occupy about half of the rule set. The key con-
15
tribution is by the "cluster exchange" rule, a penalty scheme which alters initial identifications of SONODET according to Table 2 if no joint identification can be found. Kiruna_I Kovdor, Paakkola, Khibiny_I Khibiny_I Norwegian_Sea_I Norwegian_Sea_I Nikel_I Nordreisa Teleseism_impulsiv
Table 2
-> -> ->
Kiruna_II_ Kiruna_II Khibiny_II Khibiny_II Norwegian_Sea_II Nikel_II Nikel_II Teleseism_emergent
Cluster exchange pairs of COASSEIN at ARCESS (see text for details)
The information of Table 2 must match the specific regions defined by the pattern set of Fig. 9. The exchange is permitted between source regions of similar distance but different backazimuth, and for neighboring regions since both conditions cause similar seismograms. Another interpretation is based on the principles of Bayesian or "statistical" PR (see Bishop, 1995). The cluster exchange resembles the multiplication of SONODET's pattern fit values with "prior probabilities", i.e., the fraction of different source regions in the bulletin. In case, COASSEIN encounters uncertainty by any contradiction in reported event types, the most probable choice is selected. This guideline is necessary, since SONODET has performed a template matching that did not prefer frequent clusters over exotic events. The SparseNet approach suffers from some typical weaknesses that can be explained by Fig. 10. Once again we have selected the most important class with Mc(100) = 0.0 equivalent to 14 dB SNR at single traces. In this class, there were no missed events and no false alarms for the whole 10-day testbed, so only wrong locations are shown. The first event is from the cluster East of Nikel; there is no appropriate pattern defined since all other events – with one exception – are very weak signals of different shape. The other challenge is the small Pg or Pn arrival 15 s before the true onset. It has the same backazimuth and may stem from a weak foreshock whose remainder is masked in the coda of the main event. SparseNet adjusted the most similar pattern to the overall shape of the whole sonogram and obtained the wrong region and even the wrong distance range. The other examples are from clusters well represented in the pattern set of Fig. 9. The difficulties once again come from overlapping events. In the second case, two blasts from Nikel are erroneously combined to Kostomuksha, four Kiruna blasts are jointly taken as Khibiny, and finally a Khibiny event is misclassified as Norwegian_Sea. The single trace results of SONODET at ARC1 are given to the right of the sonogram; in the cases 2 to 4 they also contain the correct solution. COASSEIN has outvoted the correct solution in favor of more agreement.
16
Fig. 10
Processing weaknesses by SparseNet (see text for details)
17
The examples in Fig. 10 are the same 4 cases which Pluralistic Processing identifies as problematic to suggest human reevaluation (see below). The errors are "reasonable" as changes in event signature have indeed moved these examples close to other types. COAEBULL SparseNet contains a third software module COAEBULL intended to compare different bulletins (Joswig, 1999). It is not the envisioned, rule-based system needed for pluralistic reasoning that will weight the strengths and weaknesses of independent processing approaches. Still we benefit from COAEBULL as it collects the performance statistics presented in the next section. COAEBULL takes one to four bulletins as reference to evaluate an additional one. The comparison is done on all events within a short time window; classification results are based on the definition of source regions. They may be match, not matched but close (within predefined "gray zones" around the source regions), wrong but equidistant, wrong region, false alarm and missed. COAEBULL implements a concept of completeness threshold that considers for missed only those events that are above the magnitude thresholds Mc of Fig. 5.
Results of Testbed Processing To establish ground truth information, the available, human reviewed bulletins from pIDC and Helsinki / Bergen university were complemented by our own, manual reevaluation of the whole testbed April 12 - April 21, 1996. This reevaluation was necessary because the automated detection results included many weak events, some of them composed by phase onsets not even visible at single traces. In this case, the reported event was assumed to be correct if any of the three conditions holds: (1) the SparseNet identification by source region matches one phase from DP by time, type, and backazimuth, (2) the declaring phases of RONAPP fit the seismogram signature, (3) there is at least one additional phase in the onset list from other NORSAR arrays. A typical situation was to confirm SparseNet, reporting an event from the Kiruna quarry region when DP has missed the Pn/Pg onset but reported a Sn/Lg arrival with 225° backazimut that occurred some 35 s behind the reported onset time of SONODET. The event is confirmed because it matches condition (1) – the timing of SONODET onset to Sn/Lg fits the Kiruna distance of 250 km, the backazimuth is correct too. A reviewed bulletin could be established that is complete for all events above Mc(100) = -0.5 within 1500 km radius around ARCESS. According to Table 1, this corresponds to +3 dB SNRST on single traces. Below, we could only test if any reported detection
18
conforms to the event confirmation criteria described above, so the bulletin will definitively be incomplete.
Classes for Performance Statistics The available ground truth led to four different conditions for the performance statistics compiled by COAEBULL: ? events above Mc(100) = 0.0. This will summarize success and failure for the large, clearly visible events. Only ghost events of sufficiently large magnitude will be considered as false alarms. One would like to arrive at automated processing that masters this dataset without any errors. ? events above Mc(100) = -0.5. Reports on the maximum available data set with complete ground truth. Again the number of false alarms is limited by Mc. Now we reach the limits of human routine processing. The automated system will be worse than an analyst but it is important to quantify the decrease compared to case 0.0. ? as before with Mc(100) = -0.5 +trg. Includes all triggers, i.e., all declared events, regardless of magnitude. This compiles the performance under some more realistic assumption of observatory routine works since all false alarms bothering the analyst will be considered. ? extend to Mc(100) = -1.0 +trg. There can't be a change in the absolute number of successfully or erroneously declared events, as all of them were already included in the previous case. However, we consider even weaker events for detection now and the increase of missed events will quantify the ultimate limits of sensitivity. RONAPP Results Table 3 lists the results of RONAPP processing for the 10-day testbed. In the highest class with 28 dB SNRAB on the array beam, 2 events were missed, and every day 1 ghost event was reported and 2 events were severely mislocated. The total error rate (close+equidistant+wrong+missed but excluding false alarms) is 39%. In the next class with 17 dB SNRAB, the daily error rates are 3 missed events, 3 false alarms, and 4 mislocations. This gives a total error rate of 36%. Taking all RONAPP events in column [–0.5 +trg], one gets 5 false alarms and 5 mislocations each day; the total error decreases to 29%. Lowering the detection threshold for half a magnitude will add another 50 missed events.
19
SparseNet
on 4 stations
Compl. Thresh. m100
0.0
-0.5
-.5+trg
-1.+trg
0.0
-0.5
-.5+trg
-1.+trg
number of events
67
177
228
307
67
180
262
312
regions matched
55
113
144
144
41
116
187
187
not matched but close
1
3
3
3
15
23
30
30
wrong but equidistant
6
28
42
42
0
0
0
0
wrong regions
5
16
21
21
9
14
18
18
FAs by region
0
17
28
28
8
32
48
48
detected by Voting
0
0
1
1
FAs by Voting
0
0
5
5
missed events
0
17
17
96
2
27
27
77
Table 3
RONAPP
on 25 stations
Processing performance for 10 days of ARCESS data
Investigating the cause of mislocations we found a typical scenario quite independent of magnitude. Often they were mixed events, i.e., a sequence of blasts from the same quarry region with seismogram overlap. Then phases are grouped incorrectly which causes wrong distance. In the epicenter map of Fig. 11, this error will introduce some artificial source regions like for the arc (210° - 240°, 550 km) around ARCESS. Actually these events are quarry blasts from Kiruna laying at half the distance; in an extreme case one weak Kiruna blast ML 0.9 has been "resited" to Northern France with ML 2.2. The size of circles conforms to Fig. 5 to indicate magnitude. Other obvious clusters exist for Kiruna (300 km SW), Nikel (200 km E) and Khibiny (400 km SE). The remaining seismicity seems very scattered with many ghost events in Barents Sea, i.e., the NE quadrant. Note that the estimated backazimuths were correct for most of the erroneous cases. The average success rate for all events was 71% but decreased for the highest class to 61%. In low SNR, only P and Lg are visible and there are no ambiguities in phase association. For good SNR, more phases per event got detected by DP / EP which complicates their association.
20
Fig. 11 Automatically derived epicenter map by RONAPP for the 10-day testbed
SparseNet Results The SparseNet results are also compiled into Table 3. To get an equal number of processed events, all teleseisms have been excluded although the success rate for these onsets is generally above 90%. The remaining differences in number of events come from slight magnitude biases. The SparseNet statistics have two new rows that summarize event detections without location, e.g. by STA/LTA or the SONODET warning: Significant energy outside pattern base issued for larger events. SparseNet has systematically fewer false alarms than RONAPP; surprisingly it also missed less events in-
21
dicating the high sensitivity of our specific sonogram scalings and the pattern adaptation process. Only for Mc(100) = -1.0, RONAPP has less missed events, but this class corresponds to –8 dB SNRST for SONODET. In the highest class, SparseNet had just 1 mislocation per day – no false alarm and no missed event. The most frequent error is the assignment to a source region with same distance but different backazimuth; this remains true for all other classes. The overall error rate is 18% excluding teleseism. Of course, this success demands an appropriate knowledge base and sufficiently clustered seismicity. The next class exhibits 2 missed events, 2 false alarms, and 5 mislocations per day which means an error rate of 36%. Adding all events declared by SparseNet, we see in column [-0.5 +trg] only a slight change to 37% error rate and 51 more events; RONAPP has added 82. Thus 3 dB SNRST brings SparseNet down to the limits of its processing capabilities.
Pluralistic Processing The examples and performance statistics given so far have demonstrated that the ideal solution for array processing is neither the exclusive application of beamforming / f-k analysis nor the sole use of AI techniques like pattern recognition. Obviously, most appealing is the intelligent combination of both approaches to utilize their respective strengths: the sensitivity of beamforming and the plausibility check on overall event signatures by PR. The integration of PR into the processing scheme of arrays is done by a pluralistic approach shown in Fig. 3: both methods work in parallel on the same stream of raw data. Thus the picked phases with their reliable backazimuths from f-k analysis get augmented by a robust estimate of event distance and relative phase timing derived by PR. This joint information forms the base for better locations, suppression of false alarms and detection of events with emergent seismograms. PR can also support the regionalized discrimination by defining master events from active faults, known quarries and mining areas in the same epicenter area (Wüster, 1993). However, this aspect is not covered in our paper. Pluralistic processing was realized here by the preliminary set of rules in Table 4 restricted to the evaluation of existing information in the processing lists of DP / RONAPP and SONODET / COASSEIN. There is, of course, the possibility of a guided reevaluation of the original data, but this processing path was excluded. Rule 1 An event is declared if it was considered by both detectors: at least one single site SONODET detection and one phase from DP.
22
Rule 2 If both approaches derive full solutions that agree, the solution is found. Rule 3 If both approaches derive full solutions that contradict, attempt to confirm the SparseNet source region with RONAPP backazimuths. Rule 4 Accept the RONAPP solution if its distance is within the grayzone of the pretended SparseNet region. Rule 5 Accept the SparseNet solution if RONAPP does not declare a event but one phase from DP supports by type, time and backazimuth. Rule 6 If none of the conditions succeeds, the automated processing is considered problematic and flag the event for human analysis. Table 4
Ruleset for Pluralistic Processing
The first rule limits sensitivity to the capabilities of the weaker partner. As SparseNet performed surprisingly well for low SNR, this is not a real restriction. The bonus is a quite complete suppression of all false alarms. Rule 2 defines the ideal state when both approaches independently find the same solution. The result will have high reliability. The third rule will exclude RONAPP distance errors by wrong phase timing; it will not help for cases where seismicity occurs outside the defined source regions. Rule 4 performs a plausibility check for the selected phases against the overall seismogram signature; it suppresses SparseNet solutions with wrong backazimuth. The next rule mirrors our human event confirmation when an emergent phase was missed by DP. As seen by Fig. 4, also strong events can be affected. The situation of rule 6 is counted as detected as Problem in the statistics of Table 5. Pluralistic Processing Compl. Thresh. m100
0.0
-0.5
-.5+trg
-1.+trg
number of events
67
179
228
307
regions matched
63
134
171
171
not matched but close
0
3
5
5
wrong but equidistant
0
0
0
0
wrong regions
0
5
6
6
FAs by region
0
0
1
1
detected as Problem
4
20
29
29
FAs by Problem
0
0
0
1
missed events
0
17
17
96
Table 5
Joint performance by Pluralistic Processing of 10 days ARCESS data
23
Inherently we followed a very conservative approach. Rules 3 to 5 consider only the SparseNet solutions although you may find better results by SONODET at single stations as in Fig. 10. Also we did not try other RONAPP solutions by selecting a different combination of phases for distance determination. These two decisions favor robustness and reliability at a cost of a higher number of problematic cases as can be seen in Table 5. Still, for the highest class we reach the quite ideal result of correct or marked for human inspection, no miss and no false alarm. The four problematic cases are just the ones of Fig. 10; in cases two and three RONAPP also failed by distance. One could decrease the number of problematic cases, especially in the lower classes, by more sophisticated rules designed in a less conservative manner. This could also handle a fraction of actual errors causes by the large variation of multiple events from Kiruna and Khibiny and the clusters East of Kiruna, NNW and East of Nikel which are not represented by patterns. But this goes beyond the focus of our study.
Conclusions Conventional array processing proceeds as a one-way street: one detector, one phase associator, one event declarator/locator. If any member of this chain fails, there is little chance for recurrence. RONAPP performs this way originating a slightly increasing error rate for large events in the 10-day testbed. Evaluating the same set of ten days continuous ARCESS seismograms for a subarray of 4 stations, the SparseNet modules SONODET and COASSEIN achieved comparable performance down to 3 dB SNRST at single stations; only below this threshold, the conventional beamforming / f-k processing of the full 25 station array was clearly superior. More important, the SparseNet modules failed because of other reasons: events get missed when obscured by noise bursts, any mislocation typically affects the azimuth while distance estimates are mostly correct. Combining both independent approaches performs like multi-computer control in an airplane; any mission-critical task must be secured by cross-checking. This adds redundancy by complementary processing, which is more than just another parameter evaluation based on the same preprocessing. In our case, a simple version of pluralistic evaluation successfully reduced errors to an acceptable minimum. It did not automatedly solve all problems but marked questionable cases for human inspection.
24
Acknowledgment This work was supported by Dr. Weiler and Dr. Leonard from the Israel Atomic Energy Commission. Jan Fyen at NORSAR compiled the data set and supplied detailed information about RONAPP and the Fennoscandian seismicity. The editor helped to improve the manuscript by valuable comments.
References Bartal, Y., M. Villagran, Y. Ben-Horin, G. Leonard & M. Joswig (2000). Definition of exclusion zones using seismic data, Pure Appl. Geophys. (in print). Berteussen, K. A. (1974). NORSAR location calibrations and time delay corrections, NORSAR Sci. Rep. 2-73/74. Birtill, J. W. & F. E. Whiteway (1965). The application of phased arrays to the analysis of seismic body waves, Phil. Trans. Roy. Soc. Lond. A 258, 421-493. Bishop, C. M. (1995). Neural networks for pattern recognition, Oxford University Press, Oxford. Bowers, D. (1999). Depth phase identification for event screening: Future improvements. Proc. IDC Technical Experts' Meeting on Event Screening, CTBTO, Vienna. Bratt, S. R. & T. C. Bache (1988). Locating events with a sparse network of regional arrays, Bull. Seism. Soc. Am. 78, 780-798. Buchbinder, G. G. R. & R. A. W. Haddon (1990). Azimuthal anomalies of short-period P-wave arrivals from Nahanni aftershocks, Northwest Territories, Canada, and effects of surface topography, Bull. Seism. Soc. Am. 80, 1272-1283. Cansi, Y., J.-L. Plantet & B. Massinon (1993). Earthquake location applied to a mini-array: k-spectrum versus correlation method, Geophys. Res. Lett. 20, 1819-1822. Capon, J. (1969). High-resolution frequency-wavenumber spectrum analysis, Proc. IEEE 57, 14081418. Cassidy, F., A. Christoffersson, E. S,. Husebye & B. O. Ruud (1990). Robust and reliable techniques for epicenter location using time and slowness observations, Bull. Seism. Soc. Am. 80, 140149. Chiaruttini, C., V. Roberto & F. Saitta (1989). Artificial intelligence techniques in seismic signal interpretation, Geophys. J. Int. 98, 223-232. Christoffersson, A. & R. Roberts (1996). Trinity or verity? in Monitoring a Comprehensive Test Ban Treaty, eds. E. S. Husebye & A. M. Dainty, NATO ASI, Series E, 303, 611-628, Kluwer, Dordrecht. Der, Z. A., D. R. Baumgardt & R. H. Shumway (1993). The nature of particle motion in regional seismograms and its utilization for phase identification, Geophys. J. Int. 115, 1012-1024. Der, Z. A., M. R. Hirano & R. H. Shumway (1990). Coherent processing of regional signals at small seismic arrays, Bull. Seism. Soc. Am. 80, 2161-2176. Flatte, S. M. & R.-S. Wu (1988). Small-scale structure in the Lithosphere and Asthenosphere deduced from arrival time and amplitude fluctuations at NORSAR, J. Geophys. Res. 93B, 6601-6614. Fyen, J. (1996). Personal communications. Gestermann, N. (1993). Unpublished. Green, P. E., R. A. Frosch & C. F. Romney (1965). Principles of an experimental large aperture seismic array (LASA), Proc. IEEE 53, 1821-1833. Harjes, H.-P. & M. Henger (1973). Array-Seismologie, Z. Geophysik 39, 865-905 (in German). Harjes, H.-P., M. L. Jost, J. Schweitzer & N. Gestermann (1993). Automatic seismogram analysis at GERESS, Computers & Geosciences 19, 157-166. Harjes, H.-P., M. Jost & J. Schweitzer (1994). Preliminary calibration of candidate alpha stations in the GSETT-3 network, Ann. Geophys. 37, 383-396. Haubrich, R. A. (1968). Array design, Bull. Seism. Soc. Am. 58, 977-991.
25
IDC (1999). IDC processing of seismic, hydroacoustic, and infrasonic data, IDC-5.2.1, CTBTO, Vienna. Jarpe, S. & F. Dowla (1991). Performance of high-frequency three-component stations for azimuth estimation from regional seismic phases, Bull. Seism. Soc. Am. 81, 987-999. Jost, M. L., J. Schweitzer & H.-P. Harjes (1996). Monitoring nuclear test sites with GERESS, Bull. Seism. Soc. Am. 86, 172-190. Joswig, M. (1990). Pattern recognition for earthquake detection, Bull. Seism. Soc. Am., 80, 170-186. Joswig, M. (1992). System architecture of seismic networks and its implications to network automatization, Cahiers Centre Europ. Geodyn. Seism. 5, 75-84. Joswig, M. (1993). Automated seismogram analysis for the tripartite BUG array: an introduction, Computers & Geosciences, 19, 203-206. Joswig, M. (1995a). Artificial Intelligence techniques applied to seismic signal analysis, in Dynamical systems and artificial intelligence applied to data banks in Geophysics, ed. A. Gvishiani and J. Dubois, Cahiers Centre Europ. Geodyn. Seism., 9, 5-15. Joswig, M. (1995b). Automated classification of local earthquake data in the BUG small array, Geophys. J. Int., 120, 262-286. Joswig, M. (1996). Pattern recognition techniques in seismic signal processing, in Proc. 2. workshop AI in seismology and engineering seismology, Cahiers Centre Europ. Geodyn. Seism., 12, 37-56. Joswig, M. (1999). Automated Processing of seismograms by SparseNet, Seism. Res. Letters 70, 705711. Joswig, M. & Schulte-Theis, H. (1994). Master-event correlations of weak local earthquakes by dynamic waveform matching, Geophys. J. Int., 113, 562-574. Klumpen, E. & Joswig, M. (1993). Automated reevaluation of local earthquake data by application of generic polarization patterns for P- and S-onsets, Computers & Geosciences, 19, 223-231. Kvaerna, T. (1992). Automatic phase association and event location using data from a network of seismic microarrays, NORSAR Sci. Rep. 2-91/92, 96-121. Kvaerna, T. & F. Ringdal (1992). Integrated array ad three-component processing using a seismic microarray, Bull. Seism. Soc. Am. 82, 870-882. Kvaerna, T. & F. Ringdal (1993). Intelligent post-processing of seismic events – part 3: Precise relocation of events in a known target region, NORSAR Sci. Rep. 2-92/93, 93-104. Kvaerna, T. & F. Ringdal (1996). Generalized beamforming, phase association and threshold monitoring using a global seismic network, in Monitoring a Comprehensive Test Ban Treaty, eds. E. S. Husebye & A. M. Dainty, NATO ASI, Series E, 303, 447-466, Kluwer, Dordrecht. Lay, T. & Wallace, T. C. (1995). Modern global seismology, Academic Press, San Diego CA. Leonard, G., M. Villagran, M. Joswig, Y. Bartal, N. Rabinowitz & A. Saya, (1999). Seismic source classification in Israel by signal imaging and rule-based coincidence evaluation, Bull. Seism. Soc. Am. 89, 960-969. Magotra, N., N. Ahmed & E. Chael (1987). Seismic event detection and source location using singlestation (three-component) data, Bull. Seism. Soc. Am. 77, 958-971. Menke, W. & A. Lerner-Lam (1991). Observations of the transition from linear polarization to complex polarization in short-period compressional waves, Bull. Seism. Soc. Am. 81, 611-621. Menke, W., A. L. Lerner-Lam, B. Dubendorff & J. Pacheco (1990). Polarization and coherence of 5 to 30 Hz seismic wave fields at a hard-rock site and their relevance to velocity heterogeneities in the crust, Bull. Seism. Soc. Am. 80, 430-449. Mykkeltveit, S. & Bungum, H. (1984). Processing of regional seismic events usig data from small-aperture arrays, Bull. Seism. Soc. Am., 74, 2313-2333. Pearce, R. G. (1999). Depth phase identification for event screening: Current praxis and some theory. Proc. IDC Technical Experts' Meeting on Event Screening, Vienna. Rabinowitz, N. & M. Joswig (1994). Detection, localization, and identification of local seismic events by a small array in Israel, 1. Scientific Progress Report, GIF I-0914-123.08/91. Ringdal, F. & E. S. Husebye (1982). Application of arrays in the detection, location, and identification of seismic events, Bull. Seism. Soc. Am. 72, S201-S224. Roberto, V. & C. Chiaruttini (1992). Seismic signal understanding: A knowledge-based recognition system, IEEE-Trans. Sig. Proc. 40, 1787-1806.
26
Roberts, R. G., A. Christoffersson & F. Cassidy (1989). Real-time detection, phase identification and source location estimation using single station three-component seismic data, Geophys. J. 97, 471-480. Roberts, R. G. & A. Christoffersson (1990). Decomposition of complex single-station three-component seismograms, Geophys. J. Int. 103, 55-74. Ruud, B. O. & E. S. Husebye (1992). A new three-component detector and automatic single-station bulletin production, Bull. Seism. Soc. Am. 82, 221-237. Ruud, B. O., E. S. Husebye, S. F. Ingate & A. Christofferssson (1988). Event location at any distance using seismic data from a single, three-component station, Bull. Seism. Soc. Am. 78, 308325. Scherbaum, F. & J. Wendler (1986). Cross spectral analysis of Swabian Jura (SW Germany) threecomponent microearthquake recordings, J. Geophys. 60, 157-166. Schweitzer, J. (1995). Mislocation vectors for small aperture arrays – a step towards calibrating GSETT-3 stations, NORSAR Sci. Rep. 1-94/95. Searfus, R. M. (1989). Using expert systems in treaty verification, Energy and Techn. Review, No 1, 26-33, Livermore CA. Suteau-Henson, A. (1991). Three-component analysis of regional phases at NORESS and ARCESS: polarization and phase identification, Bull. Seism. Soc. Am. 81, 2419-2440. Tarvainen, M. (1992). Automatic seismogram analysis: statistical phase picking and locating methods using one-station three-component data, Bull. Seism. Soc. Am. 82, 860-869. Walck, M. C. & E. P. Chael (1991). Optimal backazimuth estimation for three-component recordings of regional seismic events, Bull. Seism. Soc. Am. 81, 643-666. Whiteway, F. E. (1965). The recording and analysis of seismic body waves using linear cross arrays, Radio Electr. Eng. 29, 33-48. Wüster, J., 1993. Discrimination of chemical explosions and earthquakes in Central Europe - a case study, Bull. Seism. Soc. Am., 83, 1184-1212.