Automated heart localization for the segmentation of the ventricular cavities on cine magnetic resonance images. C Constantinides1, 2,Y Chenoune1,2, E Mousseaux1,3,4 ,E Roullot2, F Frouin1 1 Inserm UMR 678, UPMC, Paris, France 2 ESME-SUDRIA, PRIAM, Ivry sur Seine, France 3 Radiology Department, Georges Pompidou European Hospital, APHP, Paris, France 4 University of Paris Descartes, Paris, France Abstract In this paper, a previously developed segmentation algorithm was improved by adding a fully automated definition of a region of interest around the left ventricle. The method, dedicated to cine images, proceeds in two major steps. First, heart localization was achieved by exploiting the heart’s beating motion. Then, a region of interest was created around the left ventricle by exploiting its circularity. Segmentation of the left ventricle was also performed with the previously proposed approach. The algorithm was tested on the cine MR images of the 2009 MICCAI Challenge database, including 45 subjects. The regions of interest and resulting segmentation were visually graded slice by slice. Heart localization was successful in all cases, and the restricted region of interest was acceptable in 2/3 of all cases. Finally the segmentation using the fully automated approach was satisfying for about 50% of the slices.
1.
Introduction
Segmentation of the cardiac structures on MR images is an important task in clinical routine for the evaluation of parameters such as the ejection fraction (EF) or the left ventricular mass (LVM). While MR image resolution increases very fast with today’s technological advances, allowing the acquisition of highly contrasted and detailed images and thus reducing operator variability, it is still time consuming to precisely delimitate the ventricular cavities in pathological cases. Automated segmentation of the cardiac structures has always been a challenging task [1] [2] and is also the best answer to the time consuming problem of manual segmentation. However it is very difficult to integrate all the a priori information necessary to obtain an excellent automated segmentation. The best deal lying between full automation and user interaction, we believe that user interaction needs to be a part of the segmentation process. However, it could be avoided in the subtask of ROI definition. The semi-automatic algorithm we proposed for the MICCAI Challenge [3] and for this segmentation as well
comprises, in chronological order, a manually defined ROI and a morphological filtering process prior to segmentation. This gives poorly filtered images and thus inaccurate segmentations if the ROI is overgrown. The aim of this study was therefore double: first create the best possible automated ROIs (not overgrown & correctly centred) without any user interaction at all; then measure the performance of the segmentation algorithm without any interactions by using these ROIs instead of the manually defined ones for the left ventricle.
2.
Materials & Methods
2.1.
Materials
Forty-five cardiac datasets corresponding to cine MR images, acquired in short axis (SAX) orientation were obtained through the MICCAI 2009 Grand Challenge. More information can be found in [4]. For the sake of evaluation, endocardial and epicardial contours of the left ventricle were drawn in all slices at end-diastolic (ED) and end-systolic (ES) phases, including papillary muscles in the ventricular cavity. Datasets included 9 healthy subjects as well as 12 subjects with LV hypertrophy, 12 subjects with ischemic heart-failure and 12 subjects with non-ischemic heart failure.
2.2.
Heart Localization
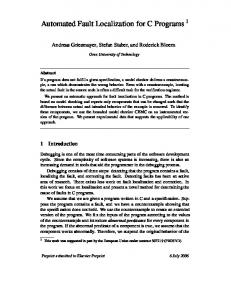
This step was based on gray level modelling throughout the cardiac cycle, combined with a 3D labelling to assure spatial continuity. First, the gray level variation of every pixel was scanned in all images of the cardiac cycle. The main assumption behind this is that gray level variation will be more important for pixels belonging to the heart than other pixels in the images due to heart motion. For instance, a pixel at the borderline between the myocardium and the left or right ventricle would have an important gray level variation from diastolic times to systolic times, since the pixel is either in the cavity (higher gray values) during diastolic times or in the myocardium (lower gray values) during systolic times. As an illustration, Figures 1a and 1b below show the gray
level variation of two pixels, one at the border of the cavity and the other one elsewhere in the image.
and the corresponding rectangle thus defines the ROI as it can be seen in Figure 2.
Figure 2: The delimitation of the final structure considered to be the heart (yellow) and its rectangular delimitation (bright green) Figure 1.1a: Two pixels on a slice one at the border of the left cavity (circle) and one far from the heart (triangle). 1b: The gray level variations of the two pixels throughout the cardiac cycle and the rectangular function model representing the ideal gray level variation for a pixel at the border of the cavity. 1c: Parametric image showing the variation in gray scale. 1d: Remaining structure after the threshold operation.
For each pixel, the corresponding time intensity curve was modelled by a window function [5] as shown in equations (1) and (2):
2.3. Region of Interest around the left ventricle After having estimated a global region of interest (ROI) that contains all the heart structure, a refined ROI around the left ventricle (LV) was defined. The LV having a circular form, the Hough transform adapted for circular forms was used [6] to detect circles that engulf the LV inside the first region of interest defined in section 2.2. As can be seen in Figure 3, the Hough transform provided several circles, among which the “best one” must be chosen, i.e. the one that best engulfed the LV.
(1)
Each pixel’s grey level is modeled by a linear combination of two time functions g1(t) and g2(t). g1(t) is a constant function that models a pixel whose intensity does not change throughout the cardiac cycle, whereas g2(t) is a window function that models a pixels whose intensity is submitted to large variations throughout the cardiac cycle (typically pixels situated at the border of the myocardium). A1(x,y) and A2(x,y) are the weighting coefficients of g1(t) and g2(t) respectively, for the pixel (x,y). For each pixel, A1(x,y) and A2(x,y) result from the minimization of the residual error eP(x,y,t). Figure 1c shows the image associated to the A2 coefficient. As it could be expected, the higher intensities of this image are localized in the heart region. A simple threshold was applied to this image in order to remove noise, artefacts or structures due to patient movement during acquisition. This step was completed by exploiting the connectivity throughout slices: a 3D-labelling followed by a 2Dlabelling allows eliminating small structures not belonging to the heart. Two consecutive morphological closings are used in order to unite the remaining structures. At this step, the remaining structure is considered to be the whole cardiac structure (Figure 1d)
Figure 3: Inside the first ROI of a given slice, Hough’s transform gives an estimation of the location of the left ventricle. Left: Case where many concentric circles are detected. Right: Case where only circles around the LV are detected.
Two independent methods aiming at finding the “best circle” were then developed and tested. In the first one it was assumed that there is a spatial continuity along the slices, and a maximum intensity projection (MIP) was computed along all slices, representing for each pixel the number of circles it was included in: the more circles a pixel is included in, the greater the probability should be that this pixel was included in the left ventricle. Then, after thresholding the MIP by keeping only the pixels with intensity higher or equal to 90% of the maximal intensity of the MIP, the centroid of this projection was computed. An example of this can be seen in Figure 4 below.
the morphological filtering in order to have a fully automatic method.
2.5.
Figure 4: Left: One slice of a subject with multiple concentric circles. Right: The MIP projection resulting from all the slices and its centroid.
The distance between the centroid and the centre of each circle on a slice was computed afterwards. The centre of a circle minimizing the distance to the centroid was chosen as the centre of the circle that contains the Left Ventricle. In the frequent case of concentric circles the one with the biggest radius was kept. The second method was based on the assumption that the blood pool as a whole has a homogeneous gray level even with the papillary muscles which are darker than the blood pool. As some false positive circles were found near the limit of the body due to high contrast in these regions (Figure 4a), the homogeneity criterion was proposed to remove these outliers. The mean gray level in each circle as well as its standard deviation in gray levels was computed. A normalized homogeneity criterion was defined as the ratio of the standard deviation over the mean gray level and the circle minimizing this criterion was kept. Once again, in case of concentric circles, the one with the biggest radius was chosen. The resulting region and the segmentation of the LV can be seen in figure 5.
Evaluation
Evaluation of the quality of all the ROIs was performed visually for all slices. Each ROI, around the heart and the left ventricle alike, was graded the following way: if the ROI was too small, a grade of 0 was given; if it was deemed correct, a grade of 1 was given; if it was an overgrown region a grade of 2 was given; and finally if the region was completely misplaced, a grade of -1 was given. Further visual evaluation was performed for segmentation and giving the same aforementioned marks to the resulting contours.
3.
Results
Firstly, the results for the whole heart localization are shown. Then the ones concerning the left ventricle for the method using the MIP and the homogeneity criteria respectively are provided and finally the visual evaluation of the segmentation performed using the automated ROIs is given. Out of a total of 374 slices (all subjects included) only 18% were found to have an overgrown region that needed reducing (Table 1). The ROIs computed for the heart were never misplaced. For the definition of the refined region, results using the MIP criterion and the homogeneity criterion are shown in Table 1. Grade -1
Heart Localization 0%
ROI LV (MIP)
ROI LV (Homogeneity)
33%
22%
0
3%
5%
2%
1
79%
29%
47%
2
18%
33%
29%
Table 1: Grade and percentages for the resulting heart localization & the refined ROIs. Figure 5: A given slice with both ROIs and the segmentation of the LV. The big box is the ROI described in section 2.2. The smaller box is the ROI described in section 2.3.
2.4.
Segmentation algorithm
The algorithm used to perform segmentation was described in [3]. It consisted of a manually defined ROI which has been replaced by the automated ROI in this work. The image inside this region was then filtered by a morphological filter. Once filtered, a GVF-Snake [7] was applied to the resulting image to obtain the endocardial contour of the left ventricle (LV). The parameterization of the GVF-Snake was fixed as well as the parameters for
The exact same grades were used for the resulting contours of the segmentation which can be found in table 2 below. Grade -1 0 1 2
Table 2: Grade segmentation
Segmentation (MIP) 40% 8% 36% 16%
Segmentation (Homogeneity) 26% 9% 49% 16%
and percentages
for
the resulting
4.
Discussion
Heart localization was satisfactory with only 18% of the ROIs judged overgrown. This was due to the fact that some artifacts could not always be completely removed from the final structure thus increasing the ROIs dimensions. However this was not negative since it reduced even more the possibility of excluding a part of the heart. This method could provide better results if used iteratively. Once the heart was localized, the Hough transform was used to detect circular forms matching the left ventricle. The main drawback here was the fact that a lot of circles were detected in one slice. This was due to the fact that the parameters of the Hough transform were chosen in order to have an over detection rather than an under detection. This has the advantage of reducing the percentage of small ROIs excluding a part of the ventricle. Once the circles were detected, two distinct methods were tested to choose the best circular form fitting the LV. The first one uses a maximum intensity projection (MIP) in order to choose the best circle corresponding to the left ventricle amongst all circles detected on each slice. The second one exploits the homogeneity in gray levels inside the blood pool. The first method gives less promising results than the second one. The Hough transform detects many concentric circles outside of the heart which biases the MIP and by extension the centroid of the MIP which is misplaced when in fact it is supposed to be inside the heart. However this projection is helpful when dealing with apical slices as the Hough’s transform locates more concentric circles on apical slices than on basal and median ones due to contrast. It allows the definition of small and precise regions around the ventricle at that level. The second method uses the a priori that the blood pool has a homogeneous gray level and probably the most homogeneous in the whole image. So the circle having the smoothest gray level variation is bound to be the blood pool. Although this method offers better results than the MIP, it does however fail in some cases. This is due to the fact that, besides bright homogeneous structures in the image like the blood pool, there are bound to be dark ones as well which were detected as circles by the Hough transform. The LV segmentation was performed using the resulting ROIs. For a ROI graded with a -1 it was expected to have a segmentation graded with a -1 as well since -1 implies the ROI, hence the segmentation, is misplaced. In this study no manual intervention whatsoever was allowed at any moment of the process. The idea of combining the two methods also seems promising by weighting the two criteria (homogeneity and MIP). On a PC at 2GHz with 2 GB RAM and using MATLAB to run our algorithm, the entire process from
the creation of the ROIs to the segmentation needs approximately 1 minute per subject to perform its task. Thus this process can be systematically used before any user intervention is required. Most slices having an overgrown ROI around the left ventricle had a satisfactory segmentation and most resulting contours that were deemed overgrown, were due to non-optimized parameterization of the deformable model rather than a misplaced ROI. Finally, manual intervention could be considered for the correction of difficult cases. Evaluation was fairly simple, visual and with grades for each ROI and segmentation. Further evaluation will be provided for the segmentation in future work with clinical and imaging parameters such as overlap, point-topoint distances, and computation of the ejection fraction. It will also include better restraining of the Hough transform in the detection of circular structures as well as the definition of a ROI around the right ventricle. Due to its irregular form, criteria were insufficient at this point to strictly automatically define this region around it. For the moment only a translation of the ROI surrounding the left ventricle towards the right ventricle is possible but this task has not yet been tested or evaluated.
References [1] Cocosco C.A. et al, Automatic cardiac region-of-interest computation in cine 3D structural MRI, International Congress Series 1268 2004; 1126–1131. [2] Jolly M.P., Fully automatic Left Ventricle segmentation in cardiac cine MR Images using registration and minimum surfaces, MICCAI 2009 Challenge, http://hdl.handle.net/10380/3114. [3] Constantinides C. et al, Semi-automated cardiac segmentation on cine magnetic resonance images using GVF-Snake deformable models, MICCAI 2009 Challenge, http://hdl.handle.net/10380/3108 [4] http://smial.sri.utoronto.ca/LV_Challenge/Home.html. [5] Ruiz-Dominguez C. et al., Assessment of left ventricular contraction by Parametric Analysis of Main Motion (PAMM): theory and application for echocardiography,
2005, Phys. Med. Biol., 50, 3277 [6] Gonzalez, R.C., Woods, R.E., Digital Image Processing, Prentice Hall, 1993 [7] Xu C., Prince J.L., Snakes, Shapes, and Gradient Vector Flow, IEEE transactions on image processing, 1998;VOL. 7, NO.3, 359-369. Address for correspondence. Constantin CONSTANTINIDES ESME-Sudria/ PRIAM, 38 rue Molière- 94200 Ivry-sur-Seine E-mail address :
[email protected]