Sindos, 57400 Thessaloniki, Macedonia, GREECE. Abstract : Malignant melanoma, the most deadly form of skin cancer, has a good prognosis if treated in the.
Proceedings of the 5th WSEAS Int. Conf. on DATA NETWORKS, COMMUNICATIONS & COMPUTERS, Bucharest, Romania, October 16-17, 2006
Automated Malignant Melanoma Detection Using MATLAB G. GRAMMATIKOPOULOS*, A. HATZIGAIDAS, A. PAPASTERGIOU, P. LAZARIDIS, Z. ZAHARIS, D. KAMPITAKI, G. TRYFON Department of Electronics, (*) Department of Esthetics Alexander Technological Educational Institute of Thessaloniki, EPEAEK II Sindos, 57400 Thessaloniki, Macedonia, GREECE.
Abstract : Malignant melanoma, the most deadly form of skin cancer, has a good prognosis if treated in the curable early stages. Early diagnosis and surgical excision is the most effective treatment of melanoma. Well-trained dermatologists reach a high level of diagnostic accuracy but their performance is increased by using computer aided numerical imaging tools. This study is limited in the use of simple image processing algorithms, for the sake of clarity, in order to illustrate the use of MATLAB in the calculation of the ABCD Total Dermatoscopy Score (TDS) for potentially malignant melanomas. A high ABCD score means that a lesion is more likely to be a malignant melanoma. Keywords : Melanoma, malignant, carcinoma, ABCD, Matlab, Dermatoscopy, image processing.
1. Introduction The target of this study is the calculation of ABCD Total Dermatoscopy Score (TDS) for potentially malignant melanomas by using MATLAB. TDS is defined by TDS = A*1.3 + B*0.1 + C*0.5 + D*0.5, with a maximum score of 8.9, where: A = Asymmetry (0-2 points), B = Border (0-8 points), C = Colour (0-6 points), D = Diameter or Differential structures (0-5 points). A high ABCD score means that the lesion is more likely to be a malignant melanoma (TDS > 5.45, [1]). In our approach, we are using MATLAB including the Image Processing Toolbox functions, [2], in order to create a “prototype” ABCD calculation program that will be later translated into C/C++ for producing a standalone executable. The most convenient way to achieve this is to use the built-in Matlab Compiler (version 2.2) mcc, which actually produces C language code and stand-alone exe files, [3]. However, special care should be taken when the Matlab code includes Image Processing Toolbox functions as our experiments with the mcc compiler have shown. In any case, the first step is always to convert a Matlab M-file script into a userdefined function and then compile it with mcc using the appropriate C/C++ libraries. The resulting program is not only a stand-alone application, that does not need Matlab to be installed in order to be executed, but it also
runs much more faster (40-50 times faster) than a Matlab M-file that is executed in the interpreter mode.
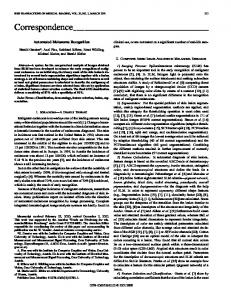
2. Description Depending upon the implementation of the ABCD rule different degrees of accuracy can be expected, eg. there exists a variety of algorithms in order to find the axis of symmetry of images with different relative precision and robustness, [4-5]. The same applies to Border/Edge detection schemes and to determination of abruptness of pigment change at the border of a lesion. Colour and Diameter parameters can be calculated with less uncertainty. Our first approach is to use the simplest algorithms available that nonetheless produce fairly accurate results when compared to human visual assessment. The steps that were programmed are those regarding the pre-processing of the image (steps 1-5), with the main calculations following (steps 6-10): 1. input of the image in RGB colour format (Fig.1), 2. transformation of the image in Graylevel format (Fig.2), 3. image histogram equalization to increase contrast (Fig.3), 4. converting image into black & white binary format using a fixed manually introduced threshold (Fig. 4), 5. edge & internal pattern detection using Prewitt method with fixed manually introduced threshold (Fig.5). 6. lesion bisection into two (orthogonal) axes –
91
Proceedings of the 5th WSEAS Int. Conf. on DATA NETWORKS, COMMUNICATIONS & COMPUTERS, Bucharest, Romania, October 16-17, 2006
axes determination by moments method, principal components analysis, gradient & orientation histogram, etc. or some very simple sampling technique. 7. Asymmetry score A calculation by image overlapping, 8. division of lesion in 8 segments and determination of pigment change in each segment for calculating the B score (0-8 points). 9. Determination of presence of 6 basic colours inside the lesion (white, red, light brown, dark brown, blue-gray, black) giving 1 point to each for the calculation of the C score, and 10. calculation of the lesion diameter based upon the edge of the lesion found on step 5, and determination of the D score accordingly. Especially steps 6 & 8 can be implemented using from very sophisticated up to very simple algorithms and this is expected to greatly influence the future development effort. In our first approach, the simplest algorithms available have been used.
Fig. 3. Image after histogram equalization. More specifically, at this point the focus is on step No. 9: determination of presence of 6 basic colours inside the lesion (white, red, light brown, dark brown, blue-gray, black) giving 1 point to each for the calculation of the C score. The above mentioned colours are described in RGB colour space as follows in Table 1.
colour RGB rgb white 255,255,255 1.0,1.0,1.0 black 0,0,0 0.0,0.0,0.0 red 255,0,0 1.0,0.0,0.0 light-brown 205,133,63 0.80,0.52,0.25 dark-brown 101,67,33 0.40,0.26,0.13 Blue-gray 0,134,139 0.0,0.52,0.54 Table1. RGB description of ABCD colours.
Fig. 1. Malignant Melanoma RGB colour image
Fig. 4. Black & White image with threshold. Fig.2 Gray-level image.
92
Proceedings of the 5th WSEAS Int. Conf. on DATA NETWORKS, COMMUNICATIONS & COMPUTERS, Bucharest, Romania, October 16-17, 2006
Fig. 5. Edge & internal pattern detection using Prewitt method with threshold.
The RGB column above describes colours using integers in the 0-255 range (8bits), while the rgb column describes colours in normalised form in the 0.0-1.0 range using floating point representation (rgb = RGB/255). In the algorithm used, all the pixels constituting the lesion (i.e. excluding surrounding healthy skin) are scanned and the Euclidian distance in “rgb” coordinates D is calculated between their colour and the six reference colours mentioned above. For example, for the first colour, white r1g1b1 = [1.0, 1.0, 1.0] and thus:
more exact colour matching. However, for practical purposes it is desirable to have a tolerance/margin around the exact colour definition. When the above procedure is completed for all pixels in the lesion, percentages of colour appearance are calculated for each one of the six colours. If the percentage appearance of a specified colour, e.g light-brown, is higher than a certain limit L (e.g. L=5%), it is concluded that this colour is present in the lesion and the C parameter is incremented by 1, up to a maximum value of 6 when all six colours are present in the lesion. Evidently, the performance of the algorithm crucially depends upon the 2 decision parameters T and L, which must be very carefully chosen. In the example of Fig. 1 (malignant melanoma + surrounding healthy skin), the algorithm using T=0.4 and L=5% detects the presence of 4 out of the six colours, white (35.7%), black (9.5%), light-brown (15.9%), and dark-brown (18.2%), and thus C=4.
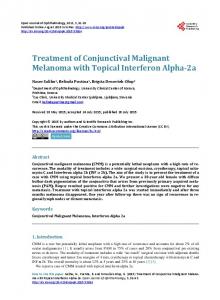
D = SQRT ((r-r1)^2 + (g-g1)^2 + (b-b1)^2) = SQRT ((r-1.0)^2 + (g-1.0)^2 + (b-1.0)^2). Fig.6. Carcinoma RGB colour image It is easily seen that the maximum value that the Euclidean distance D can assume is Dmax = SQRT (3.0) =1.732, and this for exactly opposite colours as, for example, black & white or blue & yellow (blue rgb = [0.0, 0.0, 1.0] & yellow rgb = [1.0, 1.0, 0.0]). In our approach, the distance D of the pixel under test, rgb, and the specified colour, e.g. r1g1b1 white, is compared to a somewhat arbitrarily chosen constant threshold value T (e.g. T=0.4