A Systematic Review of Automated Melanoma Detection in Dermatoscopic Images and its Ground Truth Data Abder-Rahman A. Ali, Thomas M. Deserno1 Department of Medical Informatics, Aachen University of Technology (RWTH), 52057 Aachen, Germany
ABSTRACT Malignant melanoma is the third most frequent type of skin cancer and one of the most malignant tumors, accounting for 79% of skin cancer deaths. Melanoma is highly curable if diagnosed early and treated properly as survival rate varies between 15% and 65% from early to terminal stages, respectively. So far, melanoma diagnosis is depending subjectively on the dermatologist’s expertise. Computer-aided diagnosis (CAD) systems based on epiluminescense light microscopy can provide an objective second opinion on pigmented skin lesions (PSL). This work systematically analyzes the evidence of the effectiveness of automated melanoma detection in images from a dermatoscopic device. Automated CAD applications were analyzed to estimate their diagnostic outcome. Searching online databases for publication dates between 1985 and 2011, a total of 182 studies on dermatoscopic CAD were found. With respect to the systematic selection criterions, 9 studies were included, published between 2002 and 2011. Those studies formed databases of 14,421 dermatoscopic images including both malignant “melanoma” and benign “nevus”, with 8,110 images being available ranging in resolution from 150 x 150 to 1568 x 1045 pixels. Maximum and minimum of sensitivity and specificity are 100.0% and 80.0% as well as 98.14% and 61.6%, respectively. Area under the receiver operator characteristics (AUC) and pooled sensitivity, specificity and diagnostics odds ratio are respectively 0.87, 0.90, 0.81, and 15.89. So, although that automated melanoma detection showed good accuracy in terms of sensitivity, specificity, and AUC, but diagnostic performance in terms of DOR was found to be poor. This might be due to the lack of dermatoscopic image resources (ground truth) that are needed for comprehensive assessment of diagnostic performance. In future work, we aim at testing this hypothesis by joining dermatoscopic images into a unified database that serves as a standard reference for dermatology related research in PSL classification. Keywords: Systematic review, melanoma, dermoscopy, computer-aided diagnosis, algorithms
1. INTRODUCTION The incidence of skin cancer is rapidly increasing throughout the world and is becoming one of the deadliest forms of cancers especially in Caucasian population countries [1,2]. Malignant melanoma is the third most frequent type of skin cancer and one of the most malignant tumors [3]. Its incidence is on the order of 10 to 12, 18 to 20, and 30 to 40 per 100,000 subjects in Europe, the United States, and Australia, respectively [4]. Despite its aggressive infiltration of other body parts, it is highly curable if diagnosed early and treated properly [5,6,7]. Dermoscopy or its synonyms dermatoscopy and epiluminescence light microscopy (ELM) is an in vivo, non-invasive technique that has disclosed a new dimension of the clinical morphological features of pigmented skin legions (PSL) using different incident light magnification systems with an oil immersion technique [8,9]. It provides dermatologists with a technique for in vivo inspection of skin lesions, rendering higher accuracy for detecting suspicious cases than it is possible via inspecting with naked eye [10]. Stolz et al. have developed a diagnosis scheme for dermoscopic images assessing asymmetry (A), border (B), color (C), and diameter (D) of differential structures [11]. This ABCD rule became the standard in dermoscopy for staging PSL into benign, suspicious, or malignant moles (melanoma) [11,12].
1 Corresponding author: Thomas M. Deserno (nè Lehmann), Department of Medical Informatics, RWTH Aachen University, Pauwelsstr. 30, D - 52057 Aachen, Germany, email:
[email protected]; phone: +49 241 80 88793, fax: +49 241 80 33 88793.
Depending on the observer’s experience, dermoscopy improves the diagnostic accuracy for melanoma detection up to 50% as compared to purely visual inspection [10]. However, dermascopic diagnosis is often subjective, and is therefore associated with poor reproducibility and low accuracy especially for inexperienced dermatologists, as the accuracy of experts is 75% – 84% [13,14]. Because of this fact, many physicians recommend computer-aided diagnosis (CAD) for analyzing PSL [15]. In recent years, there has been a rising interest in the development of quantitative CAD methods. Since the accuracy of diagnosis is highly dependent on physician’s expertise, CAD systems provide a rather objective and consistent measurement [16]. They can assist dermatologists in different steps of analysis, such as detection of the lesion boundary, quantification of diagnostic features, classification into different lesions types (tumor staging), and visualization [4]. CAD schemes differ on the set of features extracted from the dermatoscopic images, feature selection, classification methods as well as the image database and ground truth used in evaluation [17]. A recently published review by Rajpara et al. [18] aims at evaluating the diagnostic accuracy of dermoscopy and digital dermoscopy for melanoma diagnosis and to compare the diagnostic accuracy of the different clinical algorithms with each other and with CAD-based digital dermoscopy for the detection of melanoma. The authors retrieved 765 articles, and 30 studies were found eligible for meta-analysis, which was basically addressing the different way of diagnosis and clinical decision making, while technical aspects of CAD were not regarded. However, Rajpara et al. clearly emphasized the need of systematically extracting evidence out of the numerous papers that have been published in dermatologic diagnostics. The purpose of this paper is to present a systematic review of the scientific literature on the use of CAD systems and computer vision algorithms in aiding the detection of skin melanoma and PSL with respect to the algorithms and image datasets. As a main difference to the study presented by Rajpara et al. [18], we emphasized the technical aspect of CAD rather than the clinical aspects of diagnostics.
2. METHODS Systematic reviews aim at finding as much as possible of the research relevant to the particular research questions, and use explicit methods to identify what can reliably be said on the basis of these studies. Methods should not only be explicit but systematically aiming at producing varied and reliable results. Such reviews then go on to synthesize research findings in a form that is easily accessible to those who have to make policy or practice decisions. In this way, systematic reviews reduce the bias that occurs in other approaches of reviewing research evidence. 2.1. Search Strategy In our study, we followed the general methodology for systematic reviews of diagnostic tests as proposed by Devillé et al. [19]. The steps are (i) search database, (ii) review title and abstract, and (iii) review the full text of the paper (Fig. 1). –
Database search: A search strategy was designed to identify all potentially relevant publications about automating melanoma detection in dermatoscopic images. Within the periods ranging from 1985 to 2011, studies were identified through a computerized online search of the following databases: Medline via PubMed, IEEE Xplore, and Science Direct. With respect to the search terms defined in Table 1, the following criterion must be satisfied by a certain publication: [A B] [C D E ] D [F G]
(1)
The studies retrieved were stored within the IRMA framework (http://irma-project.org/index_en.php), with duplicates being removed. –
Title/abstract search: For study selection, the titles and/or abstracts excluding the keywords section of the papers were evaluated according to the terms as defined in Table 1: [A B F] D [H I]
–
(2)
Full text search: The full texts of the remaining papers were then searched manually in relation to the following inclusion criteria, requiring all remaining studies
Database search n = 182 Title/abstract search n = 35 Full text search n=9
Figure 1: Flow chart of the systematic review process 1.
to have an abstract that is publicly available,
2.
to assess CAD system(s) for the purpose of melanoma detection and/or classification,
3.
to concern machine algorithm(s) working with dermatoscopic images,
4.
to provide information on the dermatoscopic images dataset(s) used,
5.
to present complete data (i.e., sensitivity, specificity) on the CAD system,
6.
to be published in English language, and
7.
not to be a review paper.
2.2. Diagnostic Accuracy Assessment There are different methods to assess the diagnostic accuracy of CAD systems or algorithms. In our systematic review, we have used the following terms: –
Sensitivity: Sensitivity is a statistical measure that defines the proportion of true positive subjects with the disease in a total group of subjects with the disease (TP/TP+FN). In other words, it yields the probability of getting a positive test result in subjects with the disease. Hence it relates to the potential of a test to recognize subjects with the disease [20].
–
Specificity: This measure of accuracy of a diagnostic test is complementary to sensitivity. It is defined as the proportion of subjects without the disease with negative test result to the total number of subjects without disease (TN/TN+FP). In other words, specificity represents the probability of a negative test result in a subject without the disease. Therefore, we can postulate that specificity relates to the aspect of diagnostic accuracy that describes the test ability to recognize subjects without the disease [20].
–
ROC: When the trade-off between sensitivity and specificity is represented in a diagram forming a curve, the receiver operating characteristic (ROC) is drawn. Usually, x- and y-axis are labeled with specificity and 1 – sensitivity, respectively. ROC is a technique for visualizing, organizing and selecting classifiers based on their performance [21]. It indicates the relationship between the true positive rate (TPR) and the false positive rate (FPR) of the test of various thresholds used to distinguish disease cases from non-cases [24].
–
AUC: The area under the ROC curve (AUC) estimates the discriminative power of a test. The definition range of AUC is [0 .. 1] indicating the effectiveness of the test. A perfect diagnostic test has an AUC of 1.0, whereas a nondiscriminating test has an area of 0.5 [20].
Symbol
Term
Synonym
A
Computer aided diagnosis
Computer-aided diagnosis
B
Computer assisted diagnosis Computer-assisted diagnosis
C
Dermatology
D
Melanoma
E
Skin cancer
Dermatology
F
Algorithm
Algorithms
G
Automatic
Automated
H
Dermoscopy
Dermoscopic
I
Dermatoscopy
Dermatoscopic
Table 1: Symbols used in Equations (1) and (2) –
SROC: The SROC curve is intended to represent the relationship between TPR and FPR across studies, recognizing they may have used different thresholds. In contrast to ROC analysis, the set of (FPR, TPR) points need not necessarily yield a unique, monotonic curve [24].
–
DOR: The diagnostic odds ratio (DOR) is used for general estimation of the discriminative power of diagnostic procedures and also for the comparison of diagnostic accuracies between two or more diagnostic tests [20]. It describes the odds of positive test results in participants with disease compared with the odds of positive test results in those without disease; hence, it combines both sensitivity and specificity in one measure [18]. A high DOR value suggests accuracy of the diagnosis, while DOR values < 1 suggest that the test has failed to diagnose correctly [22,23].
–
LR+: The likelihood ratio (LR) of any clinical finding is the probability of that finding in patients with disease divided by the probability of the same finding in patients without disease [24]. The LR for positive test results (LR+), indicates how likely the positive test result is to occur in subjects with the disease as compared to those without the disease. LR+ = sensitivity / (1 – specificity) [20] is usually higher than 1.0 because it is more likely that the positive test result will occur in subjects with the disease than in subject without the disease.
–
LR–: Likelihood ratio for negative test results LR– on the other hand represents the ratio of the probability that a negative test result will occur in subjects with the disease to the probability that the same result will occur in subjects without the disease. LR– = (1 – sensitivity) / specificity [20] is usually less than 1.0 because it is less likely that negative test result occur in subjects with disease than in subjects without disease.
According to these definitions, the diagnostic accuracy of CAD systems and algorithms described in the included studies were evaluated using the Meta-Disc software (http://www.hrc.es/investigacion/metadisc_en.htm), Version 1.4. 2.3. Databases Used for Experiments Type, size, and ground truth of databases used for evaluation studies is a critical factor for generalizing results. Therefore, we monitored the datasets that included only images obtained through a dermatoscopic device, since it uses controlled lighting conditions. As with proper balance of light intensity and camera gain, images taken with digital cameras have a low level of electron noise, while the specular reflection noise in the dermatoscopic device is removed applying oil immersion [25].
3. RESULTS Based on the inclusion criteria described above, 182 papers were considered and 35 papers matched the abstract/title search process. Finally, n = 9 studies were included according to the full text evaluation criterions. This suggests that searching the titles and abstracts rather than reviewing the full paper decreases the inclusion accuracy by 14.3%.
Figure 2: ROC plane (left) and SROC curve (right) 3.1. Included Studies The n = 9 studies included in the systematic review were published between 2002 and 2011. According to the selection criterion, they all used dermatoscopic images captured with a dermatoscopic device and studies that used a digital camera for image acquisition were excluded [25]. Seven studies used a dataset size smaller than 1,000 images [15,26,28,29,31-33], and two studies referred to more than 1,000 images [29,31], providing that all the datasets included both malignant (melanoma) and benign (nevus) PSL. The dermatoscopic algorithms mentioned in the included studies were: ABCD rule, Menzies method, 7-point checklist, and seven features for melanoma. ABCD rule, the algorithm mostly referred to, was mentioned in four studies [15,27,31,32], the other dermatoscopic algorithms were mentioned in only one study [32], and five studies did not mention any algorithm [26,28-30,33]. 3.2. Diagnostic Accuracy Diagnostic accuracy relates to the ability of a test to discriminate between the target condition and health. This discriminative potential can be quantified by the measures of diagnostic accuracy such as sensitivity and specificity [20]. Based on Table 2, the maximum values for sensitivity and specificity are 100.0% [28] and 98.14% [15] respectively. The minimum values for sensitivity and specificity are 80.0% [29,31] and 61.6% [29] respectively. Sensitivity and specificity are almost equal in two studies: (85%.9 vs. 86.0%) [27] and (80.0% vs. 79.77%) [31]. An ROC plane (Fig. 2, left) and an SROC curve (Fig. 2, right) are plotted for the included studies, where the AUC in the SROC curve is 0.8692. Each point represents a different study. Red (horizontal) and green (vertical) lines represent sensitivity and specificity, respectively. The dotted red (horizontal) and green (vertical) lines represent the confidence intervals. Blue lines (curves) represent the symmetrical SROC curve. Further analysis is presented in Figure 3. Pooled sensitivity (Fig. 3, top) is 0.90. The 95% confidence interval (CI) is [0.52, …, 1.00]. For the included studies individually, all sensitivities were larger than 80% with both the lowest and highest sensitivity reported as 0.80 and 1.00, respectively. Here, however, the 95% CI are very large: [0.01, …, 1.00] and [0.03, …, 1.00], respectively. Pooled specificity (Fig. 3, middle) is 0.81with 95% CI [0.44, …, 0.98]. The majority of studies found specificities larger than 80% with a lowest and highest specificity of 0.61 (95% CI [0.00, …, 1.00]) and 0.98 (95% CI [0.02, …, 1.00]. Pooled DOR (Fig. 3, bottom) is 15.89 (95% CI: [1.39, …, 181.4]. Individual values ranged from 6.28 (95% CI [0.01, …, 3,554.36] to 1,517.58 (95% CI [0.00, …, 113,645,277,009.18]. Pooled positive LR+ is 3.20 (95% CI: [0.99, …, 10.40]. Values ranged from 2.06 (95% CI [0.15, …, 28.95]) to 51.96 (95% CI [0.00, …, 79.560.156,90]). The pooled negative LR– is 0.24 (95% CI [0.05, …, 1.09]). Individual values ranged from 0.02 (95% CI [0.00, …, 21,445.77]) to 0.34 (95% CI [0.03, …, 4.36]).
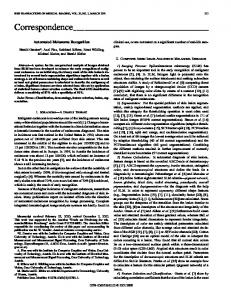
Figure 3: Pooled sensitivity (top), specificity (middle) and DOR (bottom) 3.3. Databases Different private databases (and one standardized database [34]) with different sizes, image resolution/format, and resources are used in the included studies. In total, the nine studies included 14,421 dermatoscopic images (Tab. 2). Database sizes ranged from 100 – 2,430 images. Two studies [15,27] mentioned the used ground truth, which was based on dermatologist-drawn borders. The minimum database size was 100 of 24-bit JPEG images with resolutions of 673 x 423 pixels to 2,556 x 1,600 pixels [15]. The largest data volume was used in [30], which is based on 2,430 with unknown resolution/format. After contacting the authors, in total 8,110 dermatoscopic images [29,34-38] have been made available to the public and merged within the IRMA system, as it has already been made for mammography and radiography in bone age assessment [45,46]. Figure 4 plots the resolution of available data with respect to the total number of images. As it can be seen from the graph, the database holds about 1,000 images of average resolution of 600 x 600 pixels, while experiments of 500 x 500 pixels can be performed on about 10,000 images.
10000
Database Size
1000
100
10
1 0
200
400
600
800
1000
1200
1400
Image Resolution
Figure 4: Joint IRMA melanoma database This implies the existence of a large ground truth that we can experiment on. Image resolutions ranged from 150 x 150 pixels to 1,568 x 1,045 pixels, with resolution 632 x 387 pixels constituting the most, by 5,504 images. Figure 4 is visualizing the quality of available data. In lowest resolution of 150 square pixels, the maximum total of 8,110 images is available. Increasing the required resolution, the number drops down. For a resolution of 625 square pixels, only about 1,000 images are available.
4. DISCUSSION Based on Table 3, the general accuracy of the tests in the included 9 studies is “good” referring to their AUC value of 0.87. The accuracy of the test improves when the ROC curve moves closer to the top left hand corner, that is, towards point (0,1) of the graph [42], as shown in Figure 2. We can also see that the ROC curve is nearly to be ideal, that is, containing a (0,1) point that denotes that the study perfectly separates positive and negative examples [43]. What leads to this characteristic in the curve is study [31], where sensitivity is 1.0 and specificity is 0.041. Thus, general accuracy shows good results in terms of sensitivity 90% and specificity 81%. The large size of 95% CI, however, is due to the small sample size (n = 9). The results obtained here suggest the accuracy of the diagnosis (i.e DOR=15.89), the small effect on increasing probability of the disease (i.e; LR+ = 3.20), and the moderate effect on decreasing the probability of disease (i.e; LR– = 0.24). The review shows poor diagnostic performance of automated melanoma detection as evidenced by the DOR (15.89), which depicts that the odds of a positive test result is 15.89 times greater for someone with melanoma than without. This finding is confirmed by the likelihood ratio, where LR+ is equal to 3.20. This means that positive malignancy (melanoma) is 3.2 times more common in patients with melanoma than in those without melanoma. In other words, the patient’s positive test result would be about 3.2 times more likely to be seen in someone with melanoma than in someone without melanoma. As for LR–, which equals to 0.24, this denotes that a negative malignancy (benign) is 0.24 times as common in patients with melanoma as in patients without melanoma. Meta-analyses are often performed retrospectively on studies which were not planned with this in mind. In many situations it might be expected that differences in the study protocols will produce heterogeneity. Also, even if the same protocols are used for all studies, variability in study quality, possibly due to mistakes in implementing the protocol, may give rise to heterogeneity. Therefore, it is common to include a test for heterogeneity in the treatment difference parameter across studies [41]. Tests for heterogeneity are commonly used to decide on methods for combining studies and for concluding consistency or inconsistency of findings. It examines the null hypothesis that all studies are evaluating the same effect. (I-square) describes the percentage of total variation across studies that is due to heterogeneity rather than chance. It can be readily calculated from basic results obtained from a typical meta-analyses as: I2 = 100% x (Q-df)/Q, where Q is the Cochran chi-square heterogeneity statistic and df is the degree of freedom. Negative values of I2 are put equal to zero so that I2 lies between 0% and 100%. A value of 0% indicates no observed heterogeneity, and larger values show increasing heterogeneity [44]. Our studies showed an I2 value of 0%, and thus, indicating no observed heterogeneity. In other words, studies used in this paper are homogenous studies. Relating our findings to Rajpara et al. [18], the overlap between their n = 30 included studies and our n = 9 is only two. This is due to
AUC value Accuracy 0.90 – 1.00
Excellent
0.80 – 0.90
Good
0.70 – 0.80
Fair
0.60 – 0.70
Poor
0.50 – 0.60 Very Poor
Table 3: Area under ROC curve (AUC) values and according accuracy of the diagnostic test the different goals of analysis, clinical vs. technical, respectively, as Rajpara et al. emphasized the artificial intelligence when dealing with the technical part, whereas in our study we included the technical part in general. And, regarding this point, and as a second goal of our work, we are looking forward to establishing a larger joint dermatoscopic image database that we aim it serves as a standard reference for dermatoscopic related research, especially that we found a lack on the image resources while conducting this research.
5. CONCLUSION In conclusion, CAD systems could serve as an objective second opinion [16] to dermatologists, through assisting them in different analysis steps (i.e; detection of lesion boundary) [4]. Although their high diagnostic accuracy automated methods had small effect on increasing probability of the disease (LR+), and a moderate effect on decreasing the probability of disease (LR–). One likely reason for this finding might be due to the lack of dermatoscopic image resources needed for testing the diagnostic performance of the method(s) applied. That is, lack in the ground truth data. And, as a future work, this hypothesis will be tested by building a large joint dermatoscopic images database that will serve as a standard reference for dermatology related research.
REFERENCES 1. 2. 3. 4. 5. 6. 7. 8. 9. 10. 11. 12. 13.
Wolff K, Pehamberger H. Malignes Melanom: Füherkennung und Prognose. Wiener klinische Wochenschrift 1985;97(10):451-5. Han J, Colditz G, Hunter D. Risk Factors For Skin Cancers: A Nested Case-Control Study Within The Nurses' Health Study. Int J Epidemiol 2006;1514-21. Burg G. Das Melanom. Serie Gesundheit: Piper/VCH. 1993. Schmid-Saugeona P, Guillodb J, Thirana JP. Towards a computer-aided diagnosis system for pigmented skin lesions. Comput Med Imaging Graph 2003;27(1):65-78. Information and Resources for Cancer: Breast, Colon, Prostate, Lung and Other Forms. 2009 [cited 2011 Jul 8]. Available from: http://www.cancer.org Hintz-Madsen M. A probabilistic frame-work for classification of dermatoscopic images, ph.D. thesis. IMM 1998. NIH Consensus conference. Diagnosis and treatment of early melanoma. JAMA 1992;268(10):1314-9 Argenziano G, Fabbrocini G, Carli P, De Giorgi V, Sammarco E, Delfino M.. Epiluminescence microscopy for the diagnosis of doubtful melanocytic skin lesions. Comparison of the ABCD rule of dermoscopy and a new 7-point checklist based on pattern analysis.. Arch Dermatol1998;134(12):1563-70.. Soyer H, Smolle J, Kerl H, Stettner H. Early diagnosis of malignant melanoma by surface microscopy. Lancet 1987;2:803. Kittler H. Dermoscopy of pigmented skin lesions. Gital Dermatol Venereol 2004;139(6):541-6. Stolz W, Riemann A, Cognetta A et al. ABCD rule of dermoscopy: a new practical method for early recognition of malignant melanoma. Eur J Dermatol 1994;4(7):521-7. Johr RH. Dermoscopy: alternative melanocytic algorithms-the ABCD rule of dermoscopy, Menzies scoring method, and 7-point checklist. Clin Dermatol 2002;20(3):240-7. Stolz W, Falco OB, Bliek P, Kandthaler M, Burgdorf WHC, Cognetta AB. Color atlas of dermoscopy, 2nd enlarged and completely revised edition. Berlin: Blackwell publishing; 2002.
14. Argenziano G, Soyer HP, Chimenti S et al. Dermoscopy of pigmented skin lesions: results of a consensus meeting via the Internet. J Am Acad Derm 2003;48(5):679-93. 15. Abbas Q, Celebi ME, Garcia IF. Skin tumor area extraction using an improved dynamic programming approach. Skin Res Technol 2011. 16. Burroni M, Corona R, Dell'Eva G et al. Melanoma computer-aided diagnosis: reliability and feasibility study. Clin Cancer Res 2004;10(6):1881-6. 17. Boldrick JC, Layton CJ, Nguyen J, Swetter SM. Evaluation of digital dermoscopy in a pigmented lesion clinic: clinician versus computer assessment of malignancy risk. J Am Acad Derm 2007;56(3):417-21. 18. Rajpara SM, Botello AP, Townend J, Ormerod AD. Systematic review of dermoscopy and digital dermoscopy/ artificial intelligence for the diagnosis of melanoma. Br J Dermatol 2009;161(3):591-604. 19. Devillé WL, Buntinx F, Bouter LM et al. Conducting systematic reviews of diagnostic studies: didactic guidelines. BMC Med Res Methodol 2002;2:9. 20. Šimundić A. Measures of diagnostic accuracy: basic definitions. Med Biol Sci 2008; 22(4):61-5. 21. Fawcett T. An introduction to ROC analysis. Pattern Recognition Letters 2006;27:861-74.[24] Walter SD. Properties of the summary receiver operating characteristic (SROC) curve for diagnostic test data. Statistics Med 2002;21(9):1237-56. 22. Glas AS, Lijmer JG, Prins MH, Bonsel GJ, Bossuyt PM. The diagnostic odds ratio: a single indicator of test performance. J Clin Epidemiol 2003;56(11):1129-35. 23. Eadie LH, Taylor P, Gibson AP. A systematic review of computer-assisted diagnosis in diagnostic cancer imaging. Eur J Radiol 2011. 24. McGee S. Simplifying likelihood ratios. J Gen Intern Med 2002;17(8):646-9. 25. Ao S, Gelman L. Lecture notes in electrical engineering 90: electrical engineering and applied computing. Springer Science+Business Media B.V.; 2011. 26. Iyatomi H, Norton KA, Celebi M et al. Classification of melanocytic skin lesions from non-melanocytic lesions. Proc IEEE Engineer Med Biol 2010;5407-10. 27. Iyatomi H, Oka H, Celebi M et al. An improved Internet-based melanoma screening system with dermatologist-like tumor area extraction algorithm. Comput Med Imaging Graph 2008;32(7):566-79. 28. Iyatomi H, Oka H, Celebi ME et al. Computer-based classification of dermoscopy images of melanocytic lesions on acral volar skin. J Invest Dermatol 2008;128(8):2049-54. 29. Iyatomi H, Oka H, Saito M et al. Quantitative assessment of tumour extraction from dermoscopy images and evaluation of computer-based extraction methods for an automatic melanoma diagnostic system. Melanoma Res 2006;16(2):183-90. 30. Menzies SW, Bischof L, Talbot H et al. The performance of SolarScan: an automated dermoscopy image analysis instrument for the diagnosis of primary melanoma. Arch Dermatol 2005;141(11):1388-96. 31. Stanganelli I, Brucale A, Calori L et al. Computer-aided diagnosis of melanocytic lesions. Anticancer Res 2005;25(6C):4577-82. 32. Blum A, Luedtke H, Ellwanger U et al. Digital image analysis for diagnosis of cutaneous melanoma. Development of a highly effective computer algorithm based on analysis of 837 melanocytic lesions. Br J Dermatol 2004;151(5):1029-38. 33. Piccolo D, Ferrari A, Peris K et al. Dermoscopic diagnosis by a trained clinician vs. a clinician with minimal dermoscopy training vs. computer-aided diagnosis of 341 pigmented skin lesions: a comparative study. Br J Dermatol 2002;147(3):481-6. 34. Argenziano G, Soyer HP, De Giorgi V et al. Dermoscopy: A tutorial. Milan: EDRA Medical Publishing & New Media, 2002. 35. Ganster H, Pinz A, Roehrer R et al. Automated Melanoma Recognition. IEEE transactions on medical imaging 2001;20:233-9. 36. Zagrouba E, Barhoumi W. A preliminary approach for the automated recognition for malignant melanoma. Image Anal Stereol 2004;23(2), 121-35, 37. Zagrouba E, Barhoumi W. An accelerated system for melanoma diagnosis based on subset feature selection. J Comput Inf Technol 2005;13(1):69-82. 38. [38] Fischer B, Palm C, Lehmann T.M., Spitzer K. Selektion von Farbtexturmerkmalen zur Tumorklassifikation dermatoskopischer Fotografien. Proc. Bildverarbeitung für die Medizin 2002;338-41 [in German]. 39. Athanasiou T, Debas H & Darzi A Key topics in surgical research and methodology. Berlin: Springer; 2010. 40. Ras Y & Tsay L Advances in intelligent information systems, Berlin: Springer; 2010.
41. Whitehead A. Meta-analysis of controlled clinical trials. West Sussex: John Wiley & Sons Ltd; 2002. 42. Glasziou P, Del Mar C & Salisbury J Evidence-based practice workbook. 2nd ed. Oxford: Blackwell Publishing Ltd; 2007. 43. Gavaghan DJ, Moore RA, McQuay HJ. An evaluation of homogeneity tests in meta-analyses in pain using simulations of individual patient data. Pain 2000;85(3):415-24. 44. Higgins JP, Thompson SG, Deeks JJ, Altman DG. Measuring inconsistency in meta-analyses. BMJ (Clinical research ed.) 2003;327(7414):557-60. 45. Oliveira JEE, Güld MO, de A. Araújo A, Ott B, Deserno TD. Towards a standard reference database for computeraided mammography. Procs SPIE 2008; 6915: 1Y1-1Y9. 46. Fischer B, Brosig A, Welter P, Grouls C, Günther RW, Deserno TM. Content-based image retrieval applied to bone age assessment. Procs SPIE 2010; 7624: 121-10.