Instrumentation and Measurement Technology Conference – IMTC 2007 Warsaw, Poland, May 1-3, 2007
Automated Power Quality Monitoring System for On-line Detection and Classification of Disturbances 1
Václav Matz1, Tomáš Radil2, Pedro Ramos2,3 and A. Cruz Serra2,3
Faculty of Electrical Engineering, Department of Measurement, Czech Technical University, Technická 2, 166 27 Prague, Czech Republic E-mail:
[email protected] 2 Instituto de Telecomunicações Av. Rovisco Pais 1, 1049-001 Lisbon, Portugal E-mail:
[email protected] 3 Department of Electrical and Computer Engineering, Instituto Superior Técnico, Technical University of Lisbon, IST, Av. Rovisco Pais 1, 1049-001 Lisbon, Portugal Phone: +351-218418485; Fax: +351-218418472; E-mail:
[email protected],
[email protected] Abstract – This paper presents a system for detection and classification of power quality (PQ) voltage disturbances. The proposed system applies the following methods to detect and classify the PQ disturbances: digital filtering and mathematical morphology are used to detect and classify transients and waveform distortions, while in case of short and long duration disturbances (such as sags, swells and interruptions) the analysis of the RMS value of the voltage is employed. The decision and classification process is based on disturbances knowledge base of an expert system. The proposed approach identifies the type of the disturbance and its parameters such as time localization, duration and magnitude. The proposed system is suitable for on-line monitoring of the power system and for implementation in a digital signal processor (DSP). Keywords – Power quality assessment, disturbance detection, digital filters, morphological operation.
I. INTRODUCTION Power quality monitoring is becoming an important part of utility services in the recent years. The PQ study involves an important step: monitoring of the actual voltage and current waveforms and the detection of the PQ disturbances which occur during the monitoring. Detected disturbances are subsequently classified and information describing their localization, duration and type is stored and/or displayed. According to the IEEE 1159-1995 standard [1] the PQ disturbances can be divided into the following main classes: sags, swells, interruptions, transients and waveform distortions such as harmonics and noise. These disturbances exhibit certain distinctive characteristics that can be used for their detection and classification. The detection and classification of all PQ disturbances must be sufficiently accurate both in time and amplitude to allow later determination of the disturbance’s cause. The process also has to be robust in order to deal with noisy data collected from the power system. Several approaches for automatic detection and classification of PQ disturbances have been proposed in a number of papers [2]–[5]. The process is often based on
1-4244-0589-0/07/$20.00 ©2007 IEEE
time–frequency representations such as wavelet transform [3] or short time Fourier transform [4] which are assisted e.g. by neural networks [2,3] or fuzzy expert systems. Methods based on pattern recognition using support vector machines are also used as useful techniques for disturbance classification [5]. Other approaches apply a bank of digital filters [6] or the calculation of voltage RMS value [7]. Despite the number of methods presented in the published papers the detection and classification problem in PQ is still an open issue and a useful automated, on-line robust monitoring system is still missing. The aim of this work is to develop a method that is suitable for automated on-line continuous monitoring of onephase power system. The emphasis is therefore on low computational power required to perform the necessary calculations. Stress is also laid on the possibility to detect as many categories of PQ disturbances as possible. II. EVENT DETECTION AND CLASSIFICATION In [1] the list of categories of PQ disturbances and their typical characteristics is presented. Because of the wide range of the PQ disturbances’ parameters (frequencies, magnitudes and durations) it is hard to find a single method suitable for detection of all types of PQ disturbances. For example, the commonly used wavelet transform is suitable for the detection of transients but fails in case of short and long duration variations (such as sags and swells, especially with non-rectangular shape). Also, for the wavelet to detect all types of transients, higher scale signal decomposition is required (up to the 4th [8] or 6th level [9]) which increases significantly the computational burden. On the other hand, systems based only on the measurement of the voltage’s RMS value are not able to detect transients because during a transient the RMS value of the voltage might not change significantly. The proposed fully automated method for detection and classification of PQ disturbances (also called events) is described in this section. The method consists of three major
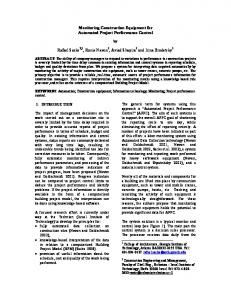
Fig. 1. Detection and classification process using the proposed method.
stages (see Fig. 1): pre-processing, event detection and classification. In the pre-processing stage only segmentation and normalization are performed. In the normalization step, the input voltage waveform in volts is converted to a relative scale (in pu units; pu stands for per unit) by dividing the input signal by the nominal RMS voltage VNOM – in our case VNOM = 230 V. The output signal of the pre-processing stage uNORM is then fed into the event detection stage. In the event detection stage, the PQ disturbances are divided into two groups and different detection methods are used in each group. The two groups of disturbances are: • transients and waveform distortions, • short and long duration variations (sags, swells and interruptions). As far as computational requirements are concerned, the proposed solution is extremely more efficient than the wavelet based algorithms with their higher level decomposition. The methods used in the event detection and classification stages are described in the next sub-sections. A. Detection and classification of transients and waveform distortions Transients and waveform distortions (namely harmonics, interharmonics, notching and noise) are PQ distortions with typical frequencies ranging from kilohertz up to several megahertz and magnitudes that can reach 8 pu [1]. Because transients and waveform distortions have frequencies above the fundamental frequency of the power system, the event detection is based on a high pass filter (HPF in Fig. 1) that removes the lower frequencies from the signal uNORM. The filter is a 6th order digital elliptic filter with cutoff frequency at 800 Hz and the gain of the filter in the pass band is equal to 1. The resulting signal uHP contains features that can be used to detect and classify PQ events. In order to simplify this task, the features are enhanced using mathematical
morphology operation. In the proposed method the dilation operation [10] is used. The dilation of a function f using a function s is defined as
( f ⊕ s )( t ) = max { f ( t − τ ) + s (τ )} τ ∈ S , t − τ ∈ F
,
(1)
where F and S are the domains of definition of the functions f and s, respectively. The function s is also called the structuring element. By appropriate selection of the structuring element, certain shapes of the function f can be enhanced. In case of the proposed method, the function to be dilated is a one-dimensional voltage signal with length NU and the structuring element is a binary vector (a vector of zeros and ones) with length NS. The dilation can be then defined as
( u ⊕ s )( t ) = max {u ( t − τ )}
∀s (τ ) ≠ 0, τ ∈ S , t − τ ∈ U , (2)
where S
{− ( NS − 1) / 2, … , ( N S − 1) / 2} N S odd = NS even {− ( NS − 1) / 2, … , NS / 2}
(3)
and U = {1, … , N U } .
(4)
The dilation is applied on the absolute value of the filtered signal (|uHP|) and the structuring element s is a vector of ones with the length NS equal to 1/10 of the period of the signal u uMORPH = u HP ⊕ s .
(5)
Event detection is then done by thresholding the morphology result, i.e. an event is detected when the uMORPH signal exceeds the thresholding level Morph_THR. By adjusting the Morph_THR level, the algorithm sensitivity can be easily adjusted to the required level. Since
0.10 u MORPH
0.08 0.06
RMS(u MORPH)
0.04
Morph_THR
0.02 0.00 0
50
100 Time (ms)
150
200
Fig. 2. Transient – typical waveforms of uMORPH and of its RMS value.
On the other hand, in case of waveform distortions, which are steady state types of distortions, the RMS value of uMORPH is elevated and only eventually it crosses the thresholding level Morph_THR or it crosses this level periodically as shown in Fig. 3.
The RMS value of the uMORPH signal – RMS(uMORPH) – is calculated as RMS ( uMORPH ) =
2 N
N
2
∑u i =1
2 MORPH
(i )
.
(6)
where N is the number of samples per period. The proposed method compares the value of RMS(uMORPH) in the time interval where the Morph_THR level was crossed (the interval has a length of one half of the input voltage’s period and is positioned so the crossing lies in its middle) with the RMS(uMORPH) value from the previous time interval. If the difference between these two RMS values exceeds the RMS_Inc_THR threshold level indicating a peak in the RMS value of the uMORPH signal, the detected event is marked as a transient otherwise it is classified as a waveform distortion. The threshold level RMS_Inc_THR was experimentally set to 0.003. The proposed method has limitations classifying individual types of waveform distortions (harmonics, interharmonics, notching and noise). The limitations arise from the choice of the cut-off frequency of the digital filter. The employed setting of the cut-off frequency does not allow detecting of e.g. harmonic distortion caused by the first 15 harmonics. However, the selected cut-off frequency allows to detect small transients that would be otherwise hidden under ever-present low harmonics distortion – see Fig. 4. The proposed method is mostly suitable for detection of transients and steady state high-frequency waveform distortions. u NORM (pu)
uMORPH is proportional to the amplitude of the disturbances, the Morph_THR threshold value can be seen as the minimum disturbance amplitude to be detected. The length of the structuring element used in dilation affects the accuracy of the estimated event’s time location and of its estimated duration (more accurate results can be achieved with shorter structuring elements). However, using a shorter structuring element can result in multiple crossings of the thresholding level leading to detection of multiple events when only one event has taken place. After thresholding the proposed method proceeds to the classification stage to distinguish between transients and several types of waveform distortions (such as harmonics, interharmonics, notching and noise) and to determine the duration and magnitude of the detected event. To classify the distortions, the RMS value of the signal after dilation (uMORPH) is analyzed. In case of transients there is always a sudden increase in the RMS value of the morphology result signal (uMORPH) and after the disturbance the RMS value of uMORPH drops again as shown in Fig. 2.
1.5 1 0.5 0 -0.5 -1
Time (ms)
-1.5 0
0.04
u MORPH
10
15
20
25
30
Fig. 4. Example of a transient detectable by the proposed method.
Morph_THR
0.03
5
B. Detection and classification of short and long duration variations
0.02 0.01
RMS(u MORPH)
0 0
50
100 Time (ms)
150
Fig. 3. Waveform distortion – typical waveforms of uMORPH and of its RMS value.
200
According to [1], short and long duration variations include sags, swells, interruptions, undervoltages and overvoltages. Typical duration of these events ranges from 0.5 cycles up to more than 1 minute, while the typical magnitudes range from 0.1 pu up to 1.8 pu. In case of short and long duration variations the most distinctive feature of these disturbances is the change of the voltage signal’s RMS value during the disturbance. In the
event detection stage the proposed method determines the RMS value of each period of the normalized input signal uNORM: 1( N
j +1) N −1
∑
i = jN
2 uNORM (i )
Threshold level Morph_THR RMS_Inc_THR RMS_THR– RMS_THR+
(7)
where N is the number of samples per period; j+1 is the period number, j = 0, 1, 2,… . Thresholding is then applied on the resulting signal uRMS to detect the events. The signal uRMS is compared with two threshold levels as shown in Fig. 1: RMS_THR– and RMS_THR+ (one below and the other above the nominal RMS value). To distinguish between individual types of short and long duration variations, the minimum and maximum values of the uRMS during the detected event and the duration of the event are used. The duration of the event is calculated as the time between the crossing of the respective RMS_THR level and the moment the signal uRMS returns into the interval defined by these threshold levels. III. EXPERIMENTAL RESULTS A system for monitoring of a single-phase power system 230 V/50 Hz was developed and implemented. The system (Fig. 5) consists of a sensor box, data acquisition board (DAQ) and PC. The sensor box [11] contains a current transducer (LA 25-NP) and a voltage transducer (LV 25-P). In this work, only the voltage transducer was used for the measurement of disturbances in the power system.
Setting 0.03 0.003 0.9 pu 1.1 pu
The proposed method was tested using three types of signals: • simulated signals with artificial disturbances, • measured signals generated using sag and swell generator [12] and • signals measured during long-term monitoring of the power grid network, The first two types of signals were used in the initial stages of development of the proposed method; while longterm monitoring was used to verify performance and applicability of the method in a real environment. The following figures show some examples of signals measured in the course of the monitoring. An example of a measured transient is shown in Fig. 6, while Fig. 7 depicts the corresponding uHP and uMORPH signals. The transient lasted 7.5 ms and had a magnitude of approximately 0.5 pu. u NORM (pu)
uRMS ( j ) =
Table 1. Threshold levels settings
1.5 1 0.5 0
-0.5 -1 -1.5 0
10
20 30 Time (ms)
40
50
Fig. 5. Power quality monitoring system.
u HP, u MORPH (pu)
Fig. 6. Measured power quality event – transient. 0.6 0.4 0.2 0 u HP u MORPH Morph_THR
-0.2 -0.4
The sensor box was connected to the power system and the output signal of the voltage transducer was sampled using a DAQ board (16-bit data-acquisition board by National Instruments USB–9215) and recorded in a PC where all the signal processing was done. Due to the bandwidth of the used voltage transducer and the memory requirements, the sampling frequency was set to 50 kS/s. In all measurements, the threshold levels were adjusted according to Table 1.
-0.6 0
10
20 30 Time (ms)
40
50
Fig. 7. Transient – the signals used in event detection and classification.
In the following example a waveform distortion is shown in Fig. 8 with the corresponding signals used in event detection in Fig. 9. Although at the beginning of the event the increase in the RMS(uMORPH) value was over the threshold level RMS_Inc_THR the event was classified as a waveform
u RMS (pu)
distortion because the threshold level Morph_THR was crossed multiple times after the initial crossing. The distortion’s duration is 0.43 seconds.
1.2 1 0.8
u NORM (pu)
0.6
1.5
0.4
1
0.2
0.5
0
u RMS RMS_THR– 0
0
0.25
0.5
0.75 1 1.25 Time (ms)
1.5
1.75
-0.5
Fig. 11. Sag – signal used in detection and classification.
-1 -1.5 0
20
40
60
80 100 Time (ms)
120
140
160
0.050 0.025
u NORM (pu)
u HP, u MORPH (pu)
Fig. 8. Measured power quality event – waveform distortion.
0.000 u HP u MORPH
-0.025
0
20
40
1.5 1 0.5 0
Morph_THR
-0.050
Figure 12 shows an example of a measured interruption. From the graph of the RMS value (Fig. 13) it can be seen that first the voltage slowly dropped to 0 pu. After that the voltage suddenly increased but the normal state (RMS value above the RMS_THR– level) was restored approximately 1 second later. The event lasted for 1.48 seconds and was classified as a momentary interruption [1].
-0.5
60 80 100 Time (ms)
120
140
-1
160
-1.5 0
Fig. 9. Waveform distortion – signals used in detection and classification.
1 Time (s)
1.5
2
Fig. 12. Measured power quality event – interruption. u RMS (pu)
The following two sets of figures show examples of PQ disturbances from the second group of events – short and long duration disturbances. The first two figures (Fig. 10 and Fig. 11) depict a measured sag, namely the measured voltage waveform and the uRMS signal used for detection and classification of the disturbance. The sag lasted approximately 1.35 s and the minimum voltage magnitude during the event was 0.6 pu.
0.5
1.2 1 0.8
u RMS
0.6
RMS_THR–
0.4
u NORM (pu)
0.2
1.5
0 0
1
0.5
1 Time (s)
1.5
2
0.5
Fig. 13. Interruption – signal used in detection and classification.
0 -0.5
IV. CONCLUSION
-1 -1.5 0
0.25
0.5
0.75 1 1.25 Time (ms)
1.5
Fig. 10. Measured power quality event – sag.
1.75
An automated PQ monitoring system for detection and classification of single-phase power system disturbances was described in this paper. The system is based on a new detection and classification algorithm based on the categories of PQ events described by the IEEE standard [1]. The algorithm uses different methods to detect and classify two groups of PQ events. For the detection of
transients and waveform distortions a digital high-pass filter and the mathematical morphological operation dilation are used. In case of short and long duration variations (such as sags, swells and interruptions) the RMS value of the voltage signal is analyzed to detect these events. The proposed method was tested using both simulated data with artificial disturbances and data measured in a singlephase power system. All algorithms used for detection and classification are simple, fast and suitable for implementation in e.g. a digital signal processor (DSP). Especially the detection stage can also be easily implemented in a FPGA or even using analog circuitry (contrary to methods based e.g. on the wavelet transform). Another advantage of the proposed method is the simplicity of adjustment of its sensitivity – by adjusting the threshold levels Morph_THR and RMS_THR its sensitivity can be adjusted to the required level. The drawbacks of the method lay in its inability to detect certain categories of disturbances. Due to the setting of the digital filter’s cut-off frequency the method cannot detect lower harmonics and interharmonics. Also, the development has focused on the most common disturbances (transients and sags) and e.g. flicker was not yet taken into account. These issues will be addressed in the future revisions of the detection and classification method. ACKNOWLEDGMENT Work sponsored by the Portuguese national research project reference POSC/EEA-ESE/57708/2004 entitled “Fast and accurate power quality measurements using analog to digital converters and digital signal processing techniques”. The work developed by Václav Matz in Portugal was sponsored by a SOCRATES/ERASMUS scholarship.
REFERENCES [1]
“IEEE Std. 1159-1995, IEEE Recommended Practice for Monitoring Electric Power Quality”, The Institute of Electrical and electronics Engineers, Inc., New York, December 1995. [2] A. M. Gaouda, S. H. Kanoun, M. M. A. Salama, A. Y. Chikhani, “Pattern Recognition Applications for Power System Disturbance Classification,” IEEE Trans. Power Del., vol. 17, no. 3, pp. 677–683, July 2002. [3] Z. – L. Gaing, “Wavelet-based neural network for power quality disturbance recognition and classification,” IEEE Trans. Power Del., vol. 19, no. 4, pp. 1560–1568, Oct. 2004. [4] M. Wang, G. I. Rowe, A. V. Manishev, “Classification of power quality events using optimal time-frequency representations, theory and application,” IEEE Trans. Power Del., vol. 19, no. 3, pp. 1496–1503, July 2004. [5] F.-F. Zhu, G.-S. Hu, J. Xie, “Classification of power quality disturbances using wavelet and fuzzy support vector machines,” Proceedings of the 4th International Conference on Machine Learning and Cybernetics, vol. 7, pp. 3981–3984, Aug. 2005. [6] Z. Chen, P. Urwin, “Power Quality Detection and Classification Using Digital Filters,” Proc. Porto PowerTech, vol. 1, Sep. 2001 [7] E. Styvaktakis, M. H. J. Bollen, I. Y. H. Gu, “Automatic classification of power system events using rms voltage measurements,” Power Engineering Society Summer Meeting, vol. 2, pp. 824–829, 2002 [8] S. Santoso, E. J. Powers, W.M. Grady, P. Hofmann, “Power quality assessment via wavelet transform analysis,” IEEE Trans. Power Del., vol. 11, no. 2 pp. 924-930, Apr. 1996. [9] H. He, J. A. Starzyk, "A self-organizing learning array system for power quality classification based on wavelet transform," IEEE Trans. Power Del., vol. 21, no. 1, pp. 286–295, Jan. 2006 [10] J. - G. Postaire, R. D. Zhang, C. Lecocq-Botte: “Cluster analysis by binary morphology,” IEEE Trans. Pattern Anal. Mach. Intell., vol. 15, no. 2, pp. 170–180, Feb. 1993. [11] P. M. Ramos, N. B. Brás, A. C. Serra, “A new calibration method for current and voltage sensors used in power quality measurements,” Proc. of IMTC 2006, pp. 2283–2288, April 2006 [12] T. Radil, V. Matz, P. Ramos, A. C. Serra: “Development of a real-time power quality monitoring instrument for detection and classification of disturbances in a single-phase power system,” Conftele 2007, accepted