This template matching approach allows us to integrate in a single operation ... Correspondence: Email: {peggy, giorgos, tony }@spatial.maine.edu , Telephone ...
SPIE Proceedings Vol. 4054, Aerosense 2000, Orlando, FL (in press)
Automated spatiotemporal change detection in digital aerial imagery P. Agouris1, G. Mountrakis1, A. Stefanidis2 1
2
Department of Spatial Information Engineering, University of Maine
National Center for Geographic Information and Analysis (NCGIA), University of Maine ABSTRACT
Handling change within integrated geospatial environments is a challenge of dual nature. It comprises automatic change detection, and the fundamental issue of modeling/representing change. In this paper we present a novel approach for automated change detection which allows us to handle change more efficiently than commonly available approaches. More specifically, we focus on the detection of building boundary changes within a spatiotemporal GIS environment. We have developed a novel approach, as an extension of least-squares based matching. Previous spatial states of an object are compared to its current representation in a digital image, and decisions are automatically made as to whether or not change at the outline has occurred. Older object information is used to produce templates for comparison with the representation of the same object in a newer image. Semantic information extracted through an analysis of template edge geometry, and estimates of accuracy are used to enhance our method. This template matching approach allows us to integrate in a single operation object extraction from digital imagery with change detection. By decomposing a complete outline into smaller elements and applying template matching along these locations we are able to detect precisely even small changes in building outlines. In this paper we present an overview of our approach, theoretical models, certain implementation issues like template selection and weight coefficient assignment, and experimental results. Keywords: Change Detection, Object Extraction, Least Squares Matching, Spatiotemporal
1. INTRODUCTION Object extraction is a fundamental photogrammetric process. The resulting information, namely precise positional data for objects (e.g. buildings, roads) on the Earth’s surface, is essential to a large variety of applications, especially GIS-related ones. In traditional digital photogrammetric and computer vision approaches, object extraction from digital images comprises two major operations: identifying the object within an image, and precisely tracking this object by measuring the image coordinates of its outline. The first process involves a variety of logical decisions like image interpretation, understanding, and object classification. The latter is a precise localization problem, aiming at subpixel accuracies in the outline detection. Research in digital photogrammetry and computer vision during the last 20 years showed that there exist no universal edge detectors which can be applied to a digital image function to both identify and track edges with sufficient success. Instead, there exists a trade-off between: • reliability, which expresses the qualitative accuracy associated with identification, and • precision, which expresses the geometric accuracy associated with tracking. Operators that excel in reliability are often referred to as type I operators, in analogy to type I errors in statistics. They succeed in identifying classes of objects (e.g. houses) within an image, without particularly dealing with precise outline localization. Their products may be for example object blobs. Operators that excel in accurately positioning object outlines are often termed type II operators. Typically, they function successfully within narrow search windows. Operators from these two broad classes have often been combined, in an effort to optimize both accuracy measures12. A good overview of the ______________________________
Correspondence: Email: {peggy, giorgos, tony }@spatial.maine.edu , Telephone : (207) 581-2180 Address: 5711 Boardman Hall #348, Orono, ME, 04469, USA
current state-of-the-art in man-made object extraction from digital imagery, in both digital photogrammetry and computer vision may be found in 5,6. A rather surprising trend in object extraction algorithm development is that the majority of approaches treat geospatial information collection as a static process. Accordingly, they formulate the problem as that of extracting an outline from an image, regardless of prior information that might exist for the depicted area in general, and the specific object in particular. Considering today’s practice trends, this static view tends to become increasingly obsolete. Instead, object extraction becomes a crucial part of larger cycles of GIS updates. Here we present our approach for the identification of changes in object outlines within a broader spatio-temporal environment. Our approach is based on the use of least squares template matching, where prior data are analyzed to provide template information. The product of such a process is the identification of changes in object outlines and the subsequent update of a GIS, to ensure its continuous validity. In this manner, pre-existing information plays the role of a type I operator, providing the necessary approximations for our template matching tools. Least squares template matching acts as a type II operator, used to extract precise outline information from a digital image. Our work is innovative in its use of prior information to provide templates for matching, and in its analysis of template information to assign proper weights in the least squares solution. In this paper we present theoretical models and implementation considerations behind our approach for automated change detection. In Section 2 we present an overview of our approach, followed by a description of object decomposition to its primitives in the next section. Section 4 presents the differential least squares matching technique and the evaluation of the results are showed in Section 5. We conclude with Section 6 by adding future work plans.
2. APPROACH OVERVIEW In modern geospatial applications object extraction becomes increasingly part of larger cycles of GIS updates. Accordingly, the objective is to compare new information to older one, and to identify changes that occurred in the meantime. In our approach, this is equivalent to comparing an object as it is represented in an image captured at instance T to the same object represented in a GIS at T-dt. This is a matching problem, where an object is compared to itself, to identify how it has changed. GIS Library
Select Preexisting Raster Preexisting Vector
Project Preexisting Information on New
Perform Differential Least Square Matching for Change Detection
Evaluate Results
Figure 1: Workflow of our change detection scheme.
Update GIS
The workflow of our change detection scheme is shown in Figure 1. Old object vector information is retrieved from a GIS database. Using positional information from this database and georeferencing information for a new image, we transfer the old object information onto the new image. There, it is used as input for a differential application of least squares template matching (DLSM). Older information produces edge templates that are matched to the image. By matching an edge template to the image we identify outline locations in this image as conjugates to template edge locations. Thus we transfer the high accuracy potential of least squares matching (LSM) onto object extraction. By performing this process at select positions along the object outline, we compare the complete object to its last recorded information. Changes are identified as instances where DLSM fails to match adequately. Information from this process is used to update the GIS.
3. OBJECT DECOMPOSITION In the development of concepts for automatic building extraction, object decomposition is a major issue. A variety of solutions have been proposed for various types of input data (e.g. DEM or raster images). Modeling schemes can be classified into polyhedral model, prismatic models and parameterized volumetric primitives8. Due to the nature of our application, prior knowledge for the object is both raster (e.g. radiometric values) and vector (e.g. outline vector data). Since vector information is already available in the form of older GIS data, we do not have to hypothesize-and-verify. For the purposes of our approach, a 3D object is expressed through a wireframe representation2, 9, 13, based on prior vector information. Under the assumption that the employment of this algorithm is focused on change detection for building outlines, the examined object may be considered as an aggregation of planar surfaces, following the concept of polyhedral models1, 10. A generalization of planar surfaces may be performed by assuming that they are equivalently represented by intersections of planes, i.e. by lines. Due to the nature of our raster dataset (aerial photography), vertical aerial photos are assumed to be available, and the 3D planes are merged into 2D, by applying an overlay operation on our 3D vector based on our viewpoint position. For further decomposition of the lines, a new element is introduced, the Minimum Spatial Element (MSE)11. The MSE describes the resolution of spatial change that the user is interested in. We can use absolute estimates for this resolution (e.g. 2m, or 0.5 pixel), or relative measures (e.g. the average size of a room). According to the application, MSE estimates can be preset to default values, or they can be dynamically updated by the user. Regardless of these choices, eventually we obtain an absolute value which defines change resolution for the specific application. Using this information, we perform a segmentation of outlines, and lines are essentially substituted by the corresponding points along the outline (Fig. 2). As corners are defined by line intersections, we do not have to consider them in our outline decomposition. A final product of this process is moving from a 3-D object to a set of points in the 2-D image space.
Figure 2: Object Outline Decomposition
4. DIFFERENCIAL LEAST SQUARES MATCHING 4.1 Description of the approach To detect changes on the outline of a building, we compare an object as it is represented in an image captured at instance T to the same object at T-dt. First, the older object vector information is retrieved from a GIS database (Fig. 3). After performing object decomposition on this vector information, as described in section 3, we choose candidate matching points. These are the points where our matching algorithm will be performed to detect change. Analysis of the object outline provides us with local edge position and orientation information to facilitate computations as we’ll see in section 4.2. The integration of vector accuracy estimates in the matching process allows us to use variable window sizes (large windows for low accuracy data and vice versa). This allows us to optimize computational performance without compromising accuracy potential. Differential Least Squares Matching
Vector
Time T- d?
Position + Direction
Time T
Raster
Create Template T
Raster
Create Template T- d?
Levels of Edge
Time Line of GIS Information
Figure 3: Process Flowchart In order to visualize our approach, let’s consider two raster images from different times (Fig. 4). In the figure we show two conjugate windows that will be used as input for a differential application of least squares template matching.
? time T- dT
Figure 4: Hypotheses of our matching
time T
In its simplest form, the geometrical model is linear, involving one shift perpendicular to the edge. In general the model may be as complex as a 6-parameter affine transformation. In order to take advantage of the preexisting raster information and to enhance the algorithm's performance and liability, a geometric representation of the edge is extracted and included in the DLSM solution by modifying accordingly the weight matrix elements. Several criteria are taken under consideration for a successful match, such as the actual shifts, error estimates for these shifts, as well as estimates of the overall performance of our model. By matching an edge template to the image we identify outline locations in this image as conjugates to template edge locations. Changes are identified as instances where DLSM fails to match adequately. Information from this process is used to update the GIS. 4.2 Mathematical Model The method we are presenting here employs least squares matching for the detection and tracking of edges in digital images 4 . A window depicting an edge pattern is introduced as a reference template that is subsequently matched to digital image patches in the vicinity of actual edge segments. The concept behind the method is simple yet effective: by matching the edge template window to an image window, we can identify edge locations in the image as conjugate to the a priori known template edge positions. ,7
Assuming f(x,y) to be the reference edge template and g(x,y) to be the actual image patch, a matching correspondence is established between them when f ( x, y ) = g ( x, y )
(1)
However, considering the effects of noise in the actual image, the above equation becomes f ( x , y ) − g ( x , y ) = e( x , y )
(2)
with e(x,y) being the error vector. In a typical least squares matching method, observation equations can be formed relating the gray values of corresponding pixels, and they are linearized as
f ( x , y ) − e( x , y ) = g o ( x , y ) +
∂g o ( x, y ) ∂g o ( x, y ) dx + dy ∂x ∂y
(3)
The derivatives of the image function in this equation express the rate of change of gray values along the x and y directions, evaluated at the pixels of the patch. Depending on the type of edge, the geometric relationship describing the two windows may be as complex as an affine transformation, or as simple as a simple shift and/or rotation. To facilitate solutions we can resample template and/or actual image to have edges lying along one of the major coordinate axes. For example, we can have resampled edges oriented along the y axis of the corresponding windows. In this case, the above equation may be reduced to:
f ( x, y ) − e( x, y ) = g o ( x, y ) +
∂g o ( x, y ) dx ∂x
(4)
where the two patches are geometrically related through a shift along the x direction: XN = Xo + dX
(5)
The dX parameter is the unknown that allows the repositioning of the image window to a location that displays better radiometric resemblance to the reference template. It is introduced in the derivative terms (∂g / ∂x ) of the linearized observations above as
f ( x, y ) − e( x, y ) = g o ( x, y ) + g x dδX
(6)
Regardless of the choice of geometric transformation, the resulting observation equations are grouped in matrix form as
− e = Ax − l ; P
(7)
In this system, l is the observation vector, containing gray value differences of conjugate pixels. The vector of unknowns x comprises the shift at the x direction, while A is the corresponding design matrix containing the derivatives of the observation equations with respect to the parameters, and P is the weight matrix3. A least squares solution allows the determination of the unknown parameters as
xˆ = ( A T PA) − 1 A T Pl
(8)
4.3 Geometry of the edge 4.3.1 Levels of the Edge In order to take advantage of the raster representation that preexists and enhance the algorithm's performance and liability, a geometric representation of the edge is extracted and included in the DLSM solution. We categorize edges as having two, three or four levels, depending on their type (Fig. 5).
Figure 5 (a): Two Levels
Figure 5 (b): Three Levels
Figure 5 (c): Four Levels
This corresponds to one, two or three edges on the image. We resample our window so that the edge is perpendicular to the x-axis of the window under examination. Then we calculate the average first derivative of each column, at the X direction: ∂g( x , y ) g x (x, y ) = ∂x y
∑ g (x , y ) x
_
g x (x ) =
1
y Clearly, for our set-up, the derivatives along the y-axis will be minimal. To compensate for noise, a subset of 80% of the _
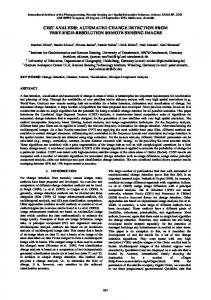
pixels with the lower residuals is used. An analysis of the g x ( x ) graph (Fig. 6), by using the first and the second derivatives, reveals 3 (or less) maxima.
80 70 60 50 40 30 20 10 0 First Derivative in the X Direction
Figure 6: Template window (top) and corresponding averages of the first derivative in the x direction (bottom) Three criteria are introduced in the decision process to accept or reject a maximum that in essence corresponds to an edge. If we define max0 as the maximum of the three maxima found, max0 = Max{max1,max2,max3} then we compare this value with the existing maxima (maxI). •If maxi > 70% maxo then that edge is accepted because the high value of relative sharpness, reveals a strong edge. •If maxi < 30% maxo then that edge is rejected because the low value of relative sharpness, reveals a weak edge. •If 30% maxo ≤maxi ≤70% maxo then we compare the second derivative, before and after the candidate maximum, by using the criterion:
_
_
∇ x ( x ) + ∇ x ( x + 1) ≤70% max o If the above condition is satisfied, then a point is rejected, otherwise it is included in the analysis. The above mentioned percentage values may be viewed as general parameters of our approach. The values included here are results of empirical analysis. With the three above criteria, a "relative" check based on maximum value, compares the dominant edge with other gradient maxima to eliminate false responses. Before we finalize the levels, we perform a last check by introducing the first derivative in the Y direction. We claim that an edge should have high gray value variations perpendicular to itself, but at the same time low variations along itself. So in this step, we check for consistency along the Y-direction, but only where the edges (accepted maximums) that came from the previous step are not strong enough. The difference with the criteria used before is that this time absolute gray values are used, acting as thresholds, and not relative ones. During this process two thresholds are introduced: •the DX-threshold, showing the difference in the gray values that might not imply an edge, and •the DY-threshold, expressing the difference in the gray values that might not imply homogeneity. First we compare the accepted maximums of the previous step, with our DX-threshold. If the condition maxi < DX-threshold is satisfied, there is the suspicion that local noise might exist or the radiometric representation of the edge is not strong. To distinguish these two, we compute the first derivative at the Y direction, at the position where the candidate maximum is, and if it is smaller than the DY-threshold, then that point is accepted. 4.3.2 Expressing Geometry Semantics through the Weight Matrix In the previous section, the analysis on prior raster information provided a description of the geometry of the edge that we are trying to match. This geometric information is inserted in our mathematical model by formulating accordingly the weight matrix. We claim that a combination of Gaussian distributions can be applied in order to assign higher weights at the accepted maxima. The formula of the Gaussian distribution is expressed as: ( x − µ )2
G( x ) =
1 2πσ
e − 2σ
2
Based on the number of levels three different gaussians can be formed (Fig. 7). Each time the value of the mean (µ) corresponds to the position where the levels change. The standard deviation, like the mean is measured in pixels. After analyzing different scenes, the following values, depending on the number of levels, were chosen: •Two levels: s = 6 The large value of s shows a spread distribution, which is considered valid, since no other information for the geometry of the edge is available. •Three levels: s 1 = 1, s 2 = 2.5 The three levels correspond to two edges on the template window. The edge that is closer to the one defined by the vector, is assigned the larger s , since it is considered to be more «important» than the other one. •Four levels: s 1 = 1, s 2 = 2.5, s 3 = 1 In the case of four levels, the same rule as above is applied. The edge closer to the vector inherits a larger distribution than the other two, and the standard deviations are formed accordingly.
Two Levels
Three Levels
Four Levels
Figure 7: Gaussian distribution of weights
Figure 8: Gaussian distribution of the weight scales
When multiple edges exist, they can result from the actual shape of the edge or random conditions such as noise, shadows, different projections, etc. We compensate for this by introducing a scaling factor describing the expected geometry of the edge. This is applicable in cases where curbs at the edges of buildings exist. The actual width of the expected curb is
Before Correction
After Correction
Figure 9: Gaussian distribution before and after the curb correction translated into pixel coordinates (d), and two gaussian distributions are created in both sides of the vector edge, based on this distance (Fig 8). The mean µ is assigned the value of µvector ± d, depending on which side it is. The standard deviation gets the value of 2d/3, so that difference in two pixels results to a 40% reduction of the weight. The values of the gaussians vary from 0 to a value max. To simplify the process max is assigned to have the value 1. With this, pixels close to the expected distance d will have almost the same weight as the vector edge, while pixels away from that will be scaled down. The weight distribution on the axes perpendicular to the vector edge is given by the formula: P(x) = Max {K1(x)*G1(x), G2(x), K3(x)*G3(x)}, ( x − µ vector − d )2
where K i ( x ) = Max{
1 2πσi
e
− 2σi
( x − µi )2
( x − µ vector + d )2
2
,
1 2πσi
e
− 2σi
2
} , Gi ( x ) =
1 2πσi
e − 2σi
2
An example of the weight distribution before and after the scaling is showed in Figure 9. Due to the fact that weights contribute to the calculation of the standard deviation s ?, an equal projection should be established so the s ?’s from different weight distributions result into the same contribution. To incorporate that, all weights are scaled to a range from 0 to 1, by using the formula: P( x ) P( x ) = P( x )
∑
At this point we should note that for the first three iterations of the least squares solution, all the weights are scaled to a 0.5 to 1 range, so that the whole window is contributing to the solution, and possible edges near the sides of the window are not excluded from the solution. 4.3.3 Supporting Decision Making The statistical tools of least squares adjustments provide the mathematical foundation necessary to come with a valid analysis of the obtained results and automatically decide whether change occurred or not. During the execution of the matching loop, several criteria are considered. •Shift dX First we check for the value of the shift dX. A threshold of 1/10 of a pixel is set to classify a matching as successful. During the application of the DLSM, a significant amount of visually successful matches was not correctly identified, because the value of the shift was not close to our threshold. After examining the behavior of dX during the iterations, several periodicity patterns were detected (Fig. 10). In many cases though these patterns were misleading, since they appear in a high amount of
unsuccessful matches. The distinction between a successful match and an unsuccessful one is the range of dX. If that variation is within a pixel value, then it is considered successful, otherwise rejected. dx
dx
dx
0.5
0.5
0.5
0
0 0
-0.5
-0.5 -0.5
dx
dx
dx -1
-1 -1
-1.5
-1.5
-2
-2
-1.5
Figure 10: Patterns of dX variations through iterations •A posteriori variance of unit weight Another statistical tool for the analysis of adjustment results is the a posteriori variance of unit weight. This variance expresses how well the overall model fits to the observations. It is computed by the following formula:
V T PV r where V is the matrix containing the residuals, P the weight matrix and r the degree of freedom. ˆ2o = σ
•Variance-covariance matrix for parameters
∑
xˆ
This matrix shows a statistical estimation for the accuracy of the obtained results. It is computed as:
∑
xˆ
ˆ2o ( A T PA ) − 1 =σ
where A is the corresponding design matrix containing the derivatives of the observation equations with respect to the parameters. The information contained therein describes the error ellipses of the estimated parameters.
5. EXPERIMENTAL RESULTS The performance of the algorithm was tested by creating a spatiotemporal GIS library of a semi-urban scene (campus of UMaine). We have collected datasets describing the campus during the last century. The available datasets are aerial imagery, maps, and vector data. From older aerial images we extracted buildings manually, and overlaid them on subsequent raster images. Using this approach we performed change detection, to capture the evolution of buildings during this last century. Several tests were performed to ensure the reliability of our algorithm. Our main objective was to correctly identify changed areas, and to verify unchanged points. Three factors were considered through the evaluation: •Good Detection: the ability to locate and mark all the real edges. •Good Localization: minimal distance between the detected edge and real edge. •Clear Response: only one response per edge. Good localization is the major advantage of LSM. Indeed, experiments showed that the extracted edges approximated the real ones at subpixel accuracy (approx. 0.1 pixel). For the other two factors, a significant improvement was noticed when the edge levels were three or more and we were able to establish a geometric representation of the edge. This geometric analysis proved to be very fast, since the weight matrix had to be constructed once for every matching point. The width of the level(s) establishes a scaling factor in the whole process, which guides the template quickly and accurately to the new edge, when there is no change. Within our testing almost 100% accuracy was achieved when edge geometry was incorporated in the solution. Otherwise, random noise such as building windows, shadows, or cars affects the algorithm. Edge geometry analysis allows us to distinguish random noise from the real edge through the manipulation of the weight matrix. Especially in the case of shadows, a problem inherently difficult since the artificial edges are very strong, the expected geometry of the edge, expressed through the size of the curb, introduced the essential metric reasoning to compensate for such errors.
Figure 11: Example of our application environment, where ûgives no match, and ü successful match
6. CONCLUSIONS AND FUTURE WORK The algorithm we presented extends the concept of least squares template matching to automatically perform change detection in a spatiotemporal environment. By using image orientation parameters and positional data we can reduce the problem of 3-D object monitoring to an image-space 2-D matching problem. Analysis of semantics within a template, before the actual matching takes place, improves the accuracy and reliability of the presented technique. While our experiments focused on vertical photography, the mathematical foundation of our algorithms would accommodate equally well oblique imagery, even close range photos. We plan to extend our semantic reasoning to include scale space concepts. This will enable us to process efficiently multiresolutional and multi-scale imagery. Furthermore, we plan to incorporate a region growing approach to analyze the area inside the outline, to detect possible local variations that do not affect the outline itself. Currently our matching process is performed locally and independently. We will proceed towards an object-wise global solution where solutions along numerous points of the same outline are connected. This will enhance the procedure, by identifying random variations that appear in the new scene. These variations can be either local, e.g. shadows, or global, e.g. illumination differences or due to different sensor resolution. Last, we will incorporate scene analysis metrics to tie the change detection processes of individual buildings into a larger, scene monitoring process. This will allow us to detect and eliminate systematic errors, like erroneous orientation data and misregistration.
ACKNOWLEDGEMENTS We wish to gratefully acknowledge NIMA for support of this research under grant number NMA202-98-1-1113. The research of Peggy Agouris is further supported by the National Science Foundation through CAREER grant number IRI9702233, and the National Aeronautics and Space Administration under grant COE 97-0015.
REFERENCES 1.
2. 3. 4.
Bignone F., O. Henricsson, P. Fua and M. Sticker. Automatic Extraction of Generic House Roofs from High Resolution Aerial Images. In Computer Vision – Proceedings of ECCV ’96, Lecture Notes in Computer Science No. 1064, pp. 8596. Springer-Verlag, Berlin, 1996. de Cambray B. Three-Dimensional modeling in a geographical database, Auto Carto 11, pp. 338 –347, Minneapolis, MN, 1993. Gruen A. Adaptive Least Squares Correlation: A Powerful Image Matching Technique, South African Journal of Photogrammetry, Remote Sensing & Cartography, Vol. 14, No. 3, pp. 175-187, 1985. Gruen A. and P. Agouris. Linear Feature Extraction by Least Squares Template Matching Constrained by Internal Shape Forces, International Archives of Photogrammetry & Remote Sensing, Vol. XXX, Part 3/1, pp. 316-323 , 1994.
5. 6. 7. 8. 9. 10.
11. 12. 13.
Gruen A., E. Baltsavias and O. Henricsson (eds.) Automatic Extraction of Man-Made Objects from Aerial and Space Images II, Birkhaeuser Verlag, Basel, 1997. Gruen A., O. Kuebler and P. Agouris (eds.) Automatic Extraction of Man-Made Objects from Aerial and Space Images, Birkhaeuser Verlag, Basel, 1995. Gruen A. and D. Stallmann. High Accuracy Edge Matching with an Extension of the MPGC-Matching Algorithm, in ‘Applications of Geodesy to Engineering’, AG Symposia Vol. 108, Springer-Verlag, pp. 339-350 , 1993. Fisher A. T. Kolbe and F. Lang. On the use of geometric and semantic models for component-based building reconstruction, SMATI 1999. Haala N. and C. Brenner. Virtual City Models from Laser Altimeter and 2D Map Data, Photogrammetric Engineering and Remote Sensing, Vol. 65, No. 7, pp. 785- 795, 1999. Hendrickx M., J. Vandekerckhove, D. Frere, T. Moons, and L. Van Gool. On the 3D Reconstruction of House Roofs from Aerial Images of Urban Areas. In International Archives of Photogrammetry and Remote Sensing, Vol. 32, Part 34w2, pp. 87-96. ISPRS, 1997. Mountrakis G., P. Agouris and A. Stefanidis. Navigating through Hierarchical Change Propagation in Spatio-Temporal Queries, Proceedings TIME 2000 (in press). Suetens P., P. Fua and A.J. Hanson. Computational Strategies for Object Recognition, ACM Computing Surveys, Vol. 24, No. 1, pp. 5-61, 1992. Vosselman G. and H. Veldhuis. Mapping by dragging and fitting of Wire-Frame models, Photogrammetric Engineering and Remote Sensing, Vol. 65, No. 7, pp. 769- 776, 1999.