signature is this case is similar to a reflected moustache shape. The spectral analysis and shape detection may be used to classify this class of defects.
AUTOMATIC CLASSIFICATION OF DEFECTS IN TIME-OFFLIGHT-DIFFRACTION DATA O. Zahran and W. Al-Nuaimy Department of Electrical Engineering & Electronics, University of Liverpool, Brownlow Hill, Liverpool Abstract: Ultrasonic Time-Of-Flight Diffraction (TOFD) is a recent innovation that has proved highly effective for the inspection of steel plates and tubular pipelines and has started to take its way to replace the other ultrasonic testing techniques. TOFD technique has a lot of advantages which make it the preferable technique in material testing. This technique gives accurate sizing, positioning and characterising of weld and other defects with a high probability of detection. TOFD still suffers from the difficulties associated with the interpretation of the images. Feature analysis and shape detection have been applied to TOFD images. Combining the obtained features with an artificial intelligent system allows the full automation of the interpretation process. The results of an initial investigation are presented and discussed. 1. Introduction: Ultrasonic techniques are still the most popular nondestructive testing method. TOFD has successfully been applied to the inspection of steel plates and tubular pipelines. TOFD has a lot of advantages which make it the preferable technique in material testing. It gives accurate sizing, positioning and characterising of weld and other defects with a high probability of detection. Currently most of the TOFD data interpretation is done manually, requiring operator skill, experience and most significantly time. In light of the industrial pressure, the recent trend is to partially or fully automate the inspection and data interpretation process. This could potentially improve these procedures by adding and element of robustness and consistency by utilising computational tools that are better suited to discriminating between subtle variations in visual and spectral properties of the data. Furthermore, this could potentially save money, effort and time (1). Each defect class has its main characteristics. The main clues of characterising each defect class can be used for the classification of the detected defects. The classification of these defects may be possible using advanced signal and image processing to build an artificial intelligent system able to use these main clues and perform the automatic classification of detected defects. 2. TOFD: TOFD first appeared in 1977 and started to take its way to replace the other ultrasonic testing techniques. This technique has a lot of advantages which make it the preferable technique in material testing (2, 3, 4). There are many successful examples for applying TOFD technique, which show that TOFD is a powerful testing tool which gives accurate sizing, and characterising of weld defects.
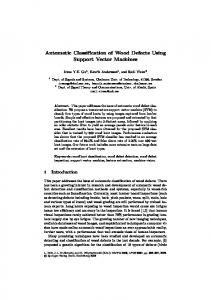
TOFD is based on measurement of the time of flight of the diffracted echoes of ultrasonic waves on the tips of discontinuities (defects) which are directly related to the true position and size of the defect instead of geometrical reflection from the interface of the discontinuities in traditional methods (5). This technique uses two probes in a transmitter-receiver arrangement as shown in Fig. (1). When ultrasound is introduced into the material, each defect edge works as a point source of diffracted waves. The received signals can be visualized in an A-scan presentation or stacked together to give a 2-dimensional image called a B or D-scan representation as shown in Fig. (2).
Figure 1: TOFD technique principle The most important advantages of TOFD technique are that, TOFD defect detection does not depend on the defect orientation, in contrast to the other techniques, defect height can be exactly determined, depth sizing is very accurate with a high probability of detection up to 95%, and very low cost (6, 7, 8,9).
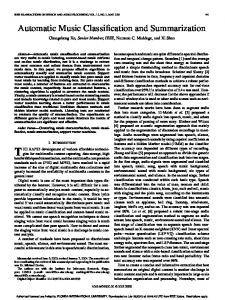
Figure 2: TOFD (a) A-scan presentation (b) D-scan presentation 3. Phase relation: When a wave is reflected at the interface between two media from higher acoustic impedance to lower acoustic impedance, there will be a 180° phase difference. Therefore when the backwall signal is reflected at the interface between steel and air, there will be a phase difference 180° between lateral wave and backwall echo. When the material under test containing a defect, there will be a 180° phase difference between the signal from the top of the defect and the lateral wave as if it had undergone a reflection which means that the phase is like the backwall echo. The signal from the bottom of the defect is still in phase with the lateral wave which means there will be a 180° phase difference between the two defect echoes as shown in Fig. (3). Theoretically if there is a 180° phase difference between two adjacent diffracted signals, this means they must have a continuous crack between them. Rarely in a very few cases the top and bottom diffraction signals may not have this phase change, but in general they will.
Figure 3: Phase relationships It can be concluded that the determination of phase relation between defects echoes and comparing them with the lateral wave and backwall echoes are very important especially for characterising of some defect classes and also to achieve the most accurate defect sizing. Therefore a phase determination algorithm based on the maximum correlation between the two signals has been investigated in order to be used to decide whether the two signals are in phase or out of phase. 4. Defect characterisations: The common defects in welds can be classified into four main categories, planar flaws, volumetric flaws, threadlike flaws and point flaws (10). Each category has special characterisations and patterns but there are some similarities between these categories which makes the discrimination between these categories not an easy task. It is very important to study these characterisations and patterns carefully which may be helpful in providing an automatic interpretation system. Planar flaws include cracks and lack of fusion. Planar flaws may be open to upper surface, breaking the lower surface or internal. The planar flaws open to the upper surface show up as an echo from the bottom edge of the flaw with a higher frequency content usually accompanied by a loss or a weakening of the lateral wave signal and the phase is still as the lateral wave. Also, apparent migration of lateral wave echo to deeper depths usually appeared as shown in Fig. (4). The defect signature is this case is similar to a reflected moustache shape. The spectral analysis and shape detection may be used to classify this class of defects.
Figure (4): Upper surface breaking pattern While the planar flaws breaking the lower surface show up as an echo from the top edge usually accompanied by an increasing delay in and/or weakening of the backwall signal. The effect on the backwall depends on
how much the deep of the crack as shown in Fig. (5). The phase of the echo is still the same as the backwall echo. The defect signature is this case is similar to a moustache shape. The shape detection may be used to classify this class of defects.
Figure (5) Lower surface breaking defect Internal planar flaws show as two echoes with a distinct 180° phase difference between the echoes from the top and bottom tips of the flaw. The phase of the upper tip echo is the same as the backwall echo while the lower one is the same as lateral wave. Both echoes have a similar amplitude and defect signature. The defect signature in this case is also similar to a moustache shape as shown in Fig. (6). The shape detection may be used to classify this class of defects. Lack of fusion is very similar to the internal cracks and both have two echo signals with 180° phase change. More analysis techniques may be used to discriminate between these two defects which are included in the same class.
Figure (6): Internal crack pattern Volumetric flaws include lack of penetration and large slag lines. The echoes from reflectors of this type also show the features and phases outlined for internal planar flaws but the echo from the upper surface is greater than the diffracted around the lower surface. The target signature of the large slag lines look like the straight line as shown in Fig.(7). Therefore the shape detection may be used to classify this class of defects.
Figure (7): Large slag line
Thread-like flaws include flaws with significant length but little through wall extent such as lamellar flaws and near horizontal area lack of fusion. The reflector appears as an apparent upper edge echo in phase with backwall echo without lower edge echo. Long narrow slag shown in Fig. (8) can be considered as an example of this categories. The target signature of this category look like the straight line therefore the shape detection may be used to classify this class of defects.
Figure (8): Threadlike flaw Point flaws category includes pores and small pieces of slag. These flaws are most common in welds and their echoes have similar pulse characteristics to the volumetric or thread like flaws but have no resolvable length. Point flaws give multiple echoes but with no other co-linear echoes at greater or lesser depth in the specimen which are similar to patterns of acoustic noise. This class of defects may be classified using structure features. The defects of this category produce signals which look like arcs on D-scan as shown in Fig. (9).
Figure (9): Point flaws The automatic discrimination between these categories can be achieved by applying a combination of analysis techniques in order to look for the distinguishable characteristics of TOFD signals for each defect category (11). 6. Interpretation: To fully automate the interpretation process of TOFD data, the interpretation process can be divided into four main stages as shown in Fig. (10). These stages are pre-processing stage, defect detection or pre-classification segmentation stage, defect classification stage and post-processing stage. Each stage contains a number of processes which will be applied in order to prepare the input of the next stage until obtaining the final output which is the interpretation result. Raw image
Preprocessing
Image segmentation
Image classification
Figure (10): Automatic interpretation system 6.1 Pre-processing stage
Postprocessing
Interpretation result
In pre-processing stage there are two processes to be done over the raw image in order to prepare it for the segmentation stage. These two processes are cutting the mode converted areas from the raw image and global background removal as shown in Fig. (11). The mode converted echoes may be useful in the case of shallow flaws which may be hidden by the lateral wave. In that case mode converted echoes can be used as an indication of the presence of the shallow defect but it is better to remove the mode converted areas because the detection process can not relay on mode converted echoes because it sometimes give false indication without the presence of the defect. In addition to the significant reduction in processing time by removing the mode converted echoes. There are two important features in all TOFD scans, the backwall echo and the lateral wave signal. These two features have to be removed with the background in order to reduce the amount of data processed in the next steps. If the lateral wave and backwall are regular and are not affected by the presence of defect, they can be removed by subtracting the mean of the image scans from each scan in the image. If there are some irregularities in lateral wave or backwall which is common, the process of global background removal is considered not enough for removing all the lateral wave and backwall echoes and therefore intelligent background removal have to be applied in the next stage. Raw image
Cut mode-converted areas
Image ready for segmentation
Global (standard) background removal
Figure (11): Pre-processing stage of the automatic interpretation system 6.2 Segmentation stage Segmentation is a very important stage in TOFD interpretation because only a small fraction of the collected data actually represents defects, whereas the majority of the data is considered redundant. The image segmentation permits more exhaustive image processing to be applied to the image in the next stages. In segmentation stage there are three processes to be done over the output image from the pre-processing stage. These processes are statistical detection, intelligent background removal and then statistical detection again as shown in Fig. (12). Image after preprocessing
Statistical detection
Intelligent (informed) background removal
Statistical detection
Image ready for classification
Figure (12): Segmentation stage of the automatic interpretation system The first process in segmentation stage is statistical detection by considering the variation between statistical features in the defect areas and background areas in order to detect only the defect areas. This process result in a segmented image with highlighted defects areas but also there will be small highlighted areas which related to the places of irregularities in lateral wave and backwall echoes. To remove these small detected areas which are not defects, an intelligent background removal has been applied. This intelligent background removal depending on determining the A-scans which not detected in the previous detection and then subtracting the mean of each adjacent group from these A-scans from the whole A-scans in the original image. After that the statistical detection is done again. The output at that time is the segmented image with highlighted only the defects areas. 6.3 Classification stage The most important stage in interpretation process is the classification. It is a very complex stage; therefore little research has been done in this field. To achieve this stage a combination of analysis and discrimination techniques may be used as shown in fig.(13). Texture features analysis
Shape detection analysis
Point flaws category
Porosity Small pieces of slag
Phase determination algorithm
Straight line
Thread-like flaw category
+
Segmented image
Fuzzy logic Moustache Hyperbolic
Planar flaws category
Upper surface breaking crack Lower surface breaking crack Internal crack Lack of fusion
Figure (13): Classification stage of the automatic interpretation system Statistical texture analysis computes local features at each point in the segmented image, and calculates a set of statistics from the distributions of the intensity levels. The local feature is defined by the combinations of intensities at specified positions relative to each point in the image. Because of point flaws category has special texture than other categories, texture features analysis may be used to identify this category, especially the second order statistics. Point flaw category includes pores and small pieces
of slag. Fuzzy logic may be used to discriminate between these two types of defects. As explained previously, some flaw categories have a special defect signature shape. Therefore these defects may be classified based on the shape they produce in D-scans. There are three expected shapes as explained previously, straight line, moustache and hyperbolic. The straight line signature represents thread-like flaw category if there is an apparent upper edge echo in phase with backwall echo without lower edge echo, or represent a large slag line (volumetric flaw category) if there are two echoes from the reflector which show the phases outlined for internal planar flaws but the echo from the upper surface is greater than the diffracted around the lower surface. The moustache shape signature represents the planar flaws category. If there are only one moustache shape signature, this means there is a lower surface breaking flaw as indicated in Fig. (5). If there are only one reversed moustache shape signature, this means there is an upper surface breaking flaw as indicated in Fig. (4). If there are two moustache shape signatures, this means there is an internal crack or lack of fusion. The phase determination at that time is important to confirm the classification decision by approving the phase relation between defect echoes, lateral wave and backwall. The hyperbolic shape signature may represent the lack of fusion or internal crack (planar flaws category) if there two echoes with different phases. Therefore the phase determination at that time is important to confirm the classification decision by approving the phase relation between defect echoes, lateral wave and backwall. If there is only one echo with no resolvable length, the hyperbolic shape may represent a point flaw. 6.4 Post-processing stage After detection and classification stages, the final stage is coming. In postprocessing stage there are three processes to be done in order to obtain the final output of the system which is interpretation result. These three processes are sizing, calibration and then applying the acceptance codes as shown in Fig. (14). Detected and classified defects
Sizing
Calibration
Acceptance codes
Interpretation results
Figure (14): Post-Classification stage of the automatic interpretation system The first process in post-processing stage is sizing of the detected defects. The sizing is this stage is related to the number of pixels not to the actual
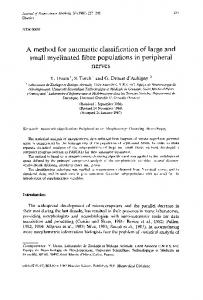
size. Therefore this process should be followed by calibration process to ensure that the measured size expresses the actual size of the defects. The last process in this stage is applying the acceptance codes to decide is this defect accepted or not. 7. Results An example of the preliminary results is shown below in Fig. (15). It shows the output of each stage which are explained above. The final output image shows that the desired defect areas are successfully detected and classified with acceptable level of accuracy in a fully automatic and un-supervised manner. The results have so far been promising.
(a) (b)
(c) (d) Figure (14): Output images of each stage (a) Original image (b) Image after pre-processing stage (c) segmented image before intelligent background removal (d) Final detected and classified image 8. Conclusion A comprehensive automatic interpretation of TOFD data can be achieved with satisfactory levels of accuracy and reliability which could potentially save money, time and effort. This can be done by combining the main characteristics of each defect category with advanced signal and image processing techniques to build an artificial intelligent system. The results of preliminary results are presented. The obtained results were quite good and promising in terms of accuracy. It is expected that such techniques will greatly reduce the degree of reliance on the trained operator during initial site investigations.
Acknowledgments The authors would like to express their gratitude and appreciation to Karl Quirk of Phoenix Inspection Systems Ltd and to Tim Armitt of Lavender International NDT for providing the TOFD data and their guidance on the interpretation of the TOFD data. References 1. O Zahran, S Shihab and W Al-Nuaimy, ‘Recent developments in ultrasonic techniques for rail-track inspection’, BINDT 2002, ISBN no. (0-9031-3230-3), pp 55-60, September 2002, United Kingdom. 2. A Erhard and U Ewert, ‘The TOFD method between radiography and ultrasonic in weld testing’, (www.ndt.net/article/v04n09/erhard/erhard.htm), Vol 4, No 9, September 1999. 3. R Krutzen, ‘Evaluation of currently applied ultrasonic sizing techniques for stress corrosion cracks in steam generator tubes’, 17th EPRI Steam Generator NDE Workshop, Breckenridge, Colorado, USA, (www.nuson.nl/news/do05pres.html), August 1998. 4.
N Trimborn, ‘The time-of-fight-diffraction technique’, NDTnet, (www.ndt.net/article/tofd /trimborn/ trimborn.htm), Vol 2, No 9, September 1997.
5. M Silk, ‘The rapid analysis of TOFF data incorporating the provision of standards’, (www.ndt.net/article/tofd/Silk/Silk.htm), Vol 2, No 9, September 1997. 6. F Betti, A Guidi, B Raffarta, G Nardoni, P Nardoni, and L Nottingham, ‘TOFD - the emerging ultrasonic computerized technique for heavy wall pressure vessel welds examination’, (www.ndt.net/article/v04n09/nardoni/ nardoni.htm), Vol 4, No 9, September 1999. 7.
F Betti, G Zappavigna, C Pedrinzani, G Nardoni, and P Nardoni, ‘Accuracy capability of TOFD technique in ultrasonic examination of welds’, (www.ndt.net/article/wcndt00/papers/ idn634/ idn634.htm), 2000.
8. A Hecht, ‘Time of fight diffraction technique (TOFD) - An ultrasonic testing method for all application’, (www.ndt.net/article/tofd/hecht/hecht.htm), Vol 2, No 9, September 1997. 9. S Webber, ‘Five years of testing using the semi-automated ultrasonic time of fight diffraction system’, (www.ndt.net/article/apcndt01/papers/898/898.htm), 2001.
10. British standard Institution, ‘The British TOFD standard BS 7706’, British Standards Institute, 1993. 11. O Zahran, S Shihab and W Al-Nuaimy, ‘Discussion of the ability of defect detection classification in weld inspection using ultrasonic timeof-flight diffraction technique’, PREP 2004 conference, April 2004, United Kingdom.