evaluated and compared to the PSD [2] and POC- based [5] ... During the design phase, and for each ..... [6] B. V. K. V. Kumar, âTutorial survey of composite filter.
Automatic Classification of Partial Shoeprints Using Advanced Correlation Filters for Use in Forensic Science M. Gueham, A. Bouridane and D. Crookes School of Electronics, Electrical Engineering and Computer Science Queen’s University Belfast, United Kingdom E-mail: {mgueham02, a.bouridane, d.crookes}@qub.ac.uk Abstract One of the most difficult problems in automatic shoeprint classification is the matching of partial shoeprint images. This task becomes more challenging in the presence of geometric distortions (e.g. translated and/or rotated partial prints). In this paper, we evaluate the performance of Advanced Correlation Filters (ACFs) for the automatic classification of partial shoeprints. The Optimal Trade-off Synthetic Discriminant Function (OTSDF) filter and the Unconstrained OTSDF (UOTSDF) filter, in particular, were used to match partial shoeprint images with different qualities. Experimental assessment using a shoeprint image database has demonstrated the efficient classification performance of ACFs compared to other state-of-the-art methods.
1. Introduction Shoeprints are often left at crime scenes and can be used as scientific evidence in forensic science. A forensic investigator may use a Scene of Crime (SoC) shoeprint to perform different tasks such as comparing it against a database of marks made by shoes available on the market (to determine the make and model of the shoe), or against a database of other shoeprints taken from other SoCs (to link between crimes). However, a large number of SoC shoeprints are partial and have generally very low quality: noisy, possibly blurred and/or twisted. This makes the processing of SoC shoeprints problematic even when done manually by experts. With the aim of assisting forensic investigators in exploiting shoeprint evidence, some work in the area of automatic shoeprint classification has been reported [1], [2]. The team at Queen's University Belfast has investigated a number of approaches [3]-[5], where
978-1-4244-2175-6/08/$25.00 ©2008 IEEE
recently, Gueham et al. [5] proposed an algorithm based on Phase-Only Correlation (POC) which was modified using a band-pass-type spectral weighting function in order to achieve superior performance. In this work, we investigate the use of ACFs for shoeprint classification. These correlation-based methods, also called composite filters, have been mostly used for Automatic Target Recognition (ATR) applications [6] and have been successfully applied in recent years to other applications such as biometrics [7]. In this paper, the ACFs’ performance in shoeprint classification is evaluated and compared to the PSD [2] and POCbased [5] methods.
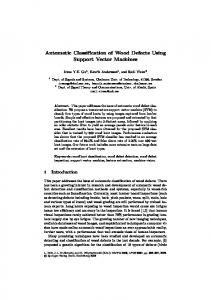
2. ACFs-based shoeprint classification A block diagram illustrating the correlation process for shoeprint classification using ACFs is given in Figure 1. During the design phase, and for each reference shoeprint image gm(x,y), a set of training images that represent the anticipated set of distortions is constructed and used to synthesize a correlation filter Hm(u,v), where u and v denote the spatial frequencies. Thus, for each class m (containing the generated training images from gm(x,y)) a correlation filter Hm(u,v) is designed and stored. During the on-line stage, when an input shoeprint image gn(x,y) (an unknown shoeprint) is presented, its 2-D Fourier Transform Gn(u,v) is computed and multiplied by each synthesized correlation filter Hm(u,v). Then, the inverse 2-D Fourier Transform of the resulting product is taken to obtain the correlation output cm(x,y), i.e. cm(x,y)=F-1{Gn(u,v) Hm*(u,v) }
(1)
where F-1 denotes the inverse Fourier transform and Hm* is the complex conjugate of Hm .
where + is the transpose conjugate, hm is a d × 1 vector obtained by rearranging Hm(u,v) and D is a d × d diagonal matrix containing the average power spectrum of the training images placed along its diagonal. Noise tolerance can be obtained by reducing the output noise variance (ONV) [8]. If the noise in the input images is zero mean, additive, and stationary, then the ONV [8] is as follows:
Training images from class m
•••
Filter design
ONV = hm+ C hm
Correlation Filter Hm 0.45
(3)
0.4 0.35 0.3 0.25
FFT
IFFT
0.2 0.15 0.1 0.05 0 N/2 N/2 0 0
Input Image
Correlation output -N/2
-N/2
Figure 1: Block diagram of correlation process
The correlation output cm(x,y) is searched for a peak, and the height of the peak, as well as other metrics such as Peak-to-Correlation Energy (PCE) or Peak-to-Sidelobe Ratio (PSR), are used as the matching score related to the class m. For a well-designed correlation filter, it is expected that its cross correlation with an input test image will produce a distinct sharp peak if the input image is similar to the training images used to synthesize the filter. Of course, there will be no large distinct peaks in the correlation output if the input image and the training ones are dissimilar. After cross correlating the input image with all the stored filters, as described above, the resulting matching scores are used to produce a list of l shoeprints from the reference database (where l