Towards Automatic Classification on Flying Insects using Inexpensive Sensors Gustavo E. A. P. A. Batista∗ , Yuan Hao∗ , Eamonn Keogh∗ , Agenor Mafra-Neto† ∗ University of California Riverside. Riverside, CA, USA † ISCA Technologies. Riverside, CA, USA {gbatista, yhao, eamonn}@cs.ucr.edu,
[email protected]
Abstract—Insects are intimately connected to human life and wellbeing, in both positive and negative senses. While it is estimated that insects pollinate at least two-thirds of the all food consumed by humans, malaria, a disease transmitted by the female mosquito of the Anopheles genus, kills approximately one million people per year. Due to the importance of insects to humans, researchers have developed an arsenal of mechanical, chemical, biological and educational tools to help mitigate insects harmful effects, and to enhance their beneficial effects. However, the efficiency of such tools depends on knowing the time and location of migrations/infestations/population as early as possible. Insect detection and counting is typically performed by means of traps, usually “sticky traps”, which are regularly collected and manually analyzed. The main problem is that this procedure is expensive in terms of materials and human time, and creates a lag between the time the trap is placed and inspected. This lag may only be a week, but in the case of say, mosquitoes or sand flies, this can be more than half their adult life span. We are developing an inexpensive optical sensor that uses a laser beam to detect, count and ultimately classify flying insects from distance. Our objective is to use classification techniques to provide accurate real-time counts of disease vectors down to the species/sex level. This information can be used by public health workers, government and non-government organizations to plan the optimal intervention strategies in the face of limited resources. In this work, we present some preliminary results of our research, conducted with three insect species. We show that using our simple sensor we can accurately classify these species using their wing-beat frequency as feature. We further discuss how we can augment the sensor with other sources of information in order to scale our ideas to classify a larger number of species. Keywords-Mosquito classification, inexpensive optical sensors, time series data
I. I NTRODUCTION For all of human history, insects have been intimately related to our wellbeing and health. For example, it is believed that mosquito-transmitted malaria has plagued mankind for at least tens of thousands of years [1]. On the other hand, insects pollinate at least two-thirds of the all food consumed in the world, being bees alone responsible for pollinating one-third of this total [2]. Because of the importance of insects to humans, researchers have developed an arsenal of mechanical, chemical, biological and educational tools to help mitigate insects’
harmful effects, and to enhance their beneficial effects. Concretely, in order to mitigate the devastation caused by mosquito-transmitted malaria, current intervention techniques include the use of insecticidal treated mosquito nets, spraying of larvicides/insecticides, introduction of fish/turtles/crustaceans that eat mosquito larvae, introduction of dragonflies which eat adult mosquitoes, spraying ponds with the natural soil bacterium Bacillus thuringiensis, which interferes in the digestion systems of mosquito larvae, trapping of mosquitoes, habitat reduction, use of chemical films to reduce the surface tension of water (drowning the pupa), among other techniques. In [3] is presented a throughout survey of vector control tools; however, the list of possible techniques changes almost monthly. It is clear that the efficiency of such tools depends on knowing the spatiotemporal dynamics of insects. Insect detection is usually performed by traps spread over the area to be monitored. A common type of trap uses a nondrying sticky substance that captures all insects that walk or land on it. These traps need to be regularly collected and manually analyzed by a trained individual. The main problem is that this procedure is expensive in terms of materials and human time, and creates a lag between the time the trap is placed and inspected. This lag may only be a week, but that can be more than half the adult life span of a mosquito. We are developing an inexpensive optical sensor that uses a low-powered laser beam to detect flying insects from distance. While our ideas may have implications for monitoring beneficial insects, our more immediate objective is to use classification techniques to provide accurate realtime counts of disease vectors down to the species/sex level. In this work, we present some preliminary results of our research, conducted with three insect species. We show that our ideas can be used to accurately classify these species using the wing-beat frequency as feature, and we discuss how we can augment the sensor with other sources of information in order to scale our techniques to classify a larger number of species. II. F LYING I NSECT S ENSOR We are developing a sensor that can measure the wingbeat frequency of flying insects from distance. Our idea is to use inexpensive components such as lasers pointers found in 99¢ stores and phototransistors employed in TV
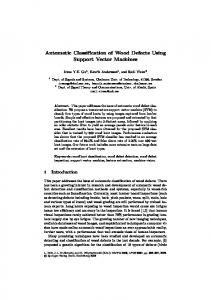
remote controls to build a inexpensive (under $5 dollars) wing-beat sensor. A low-cost sensor will not only allow its widespread use in the developing world, but will also reduce the incentive of theft for a device that must be left in the open by definition. Past experience has shown that bed nets, freely distributed in some poor African countries, were widely misused as fishing nets [4] and wedding dresses [5]. The logical design of the sensor is shown in Figure 1left, and consists of a laser source and a phototransistor connected to an amplifying and filtering electronic board. When a flying insect crosses the laser beam, its wings partially occlude the light, causing small light fluctuations captured by the phototransistor. This signal is filtered and amplified by a custom designed board, and the output signal is recorded as audio data. Figure 1-right presents a photograph of the actual sensor attached to a container as it is being currently used in laboratory evaluations.
Wing-beat signal
0
0.02
0.04
0.06
0.08
0.1
0.12
0.14
0.16
0.18
0.2
Time (s)
Signal spectrum
0
100
200
300
400
500
600
700
800
900
1000
Frequency (Hz) Peak at 0.005036s = 198.57 Hz Signal cepstrum
0
0.002
0.004
0.006
0.008
0.01
0.012
0.014
0.016
0.018
0.02
Quefrency (s)
Figure 2. An example of signal captured by our sensor. These plots correspond to the actual signal generated by wing-beats of a Bumblebee (top), the signal converted to frequency domain (middle), and the signal cepstrum (bottom)
Total Internal Reflector
Laser Source
Phototransistor
Mosquito Detected
quencies and represent all of them in a single value. Figure 1-bottom shows the cepstrum of the Bumblebee signal. The highest peak is located at the frequency of 0.005036s, approximately, 198.57Hz. III. DATA C OLLECTION
Signal 0
500
1000
Figure 1. The logical design of the insect sensor we are developing (left) and a photograph of the actual sensor (right)
We note in passing here that we are committed to transparency of our ideas and the reproducibility of our work, in the hope that others will help with the development of insect sensors. As such, detailed instructions on building the sensor can be found at [6], and all raw and processed data we have created is also freely available. One example of the signal generated by the sensor is presented in Figure 2-top. The data was generated by Bumblebee (Bombus impatiens) wing-beats, and the signal lasted for less than two tenths of a second. During one tenth of a second the signal is clear with high amplitude and, in the case of Bumblebees, this brief period of time is enough to record around 20 wing-beats. Figure 2-middle is a plot of the frequency spectrum of the signal in Figure 2-top. In the frequency domain, it is clear that the signal has a first harmonic around 200Hz, and at least three more harmonics in integer multiples of the fundamental frequency. The first harmonics represents the frequency of interest, i.e., the insect wing-beat frequency. We avail of the classic signal processing technique of using the cepstrum of a signal to detect the wing-beat frequency1 . Informally, the cepstrum is able to identify harmonic fre1 The cepstrum is obtained by calculating the Fourier transform of the log spectrum.
Data were collected during a period of 15 days for three species, Bombus impatiens, i.e. bees, a beneficial insect for humans; and two mosquitos species, Aedes aegypti, also known as yellow fever mosquito and Culex quinquefasciatus, a vector of urban human lymphatic filariasis, a disease that can cause elephantiasis, and has infected more than 120 million people worldwide. The data was collected in laboratory conditions, with controlled temperature and humidity. Temperature ranged from 70.2◦ F up to 75.3◦ F, and humidity ranged from 50% to 70%. Most of the data were collected in 12-hour recording sections. We adapted the recording sections to the periods of activity of each insect. Therefore, bee data were collected in periods that included at least a few hours of daylight. For mosquitoes, the recoding sections included dawn and/or dusk, and at least a few night hours. All data were recorded at a sampling rate of 44100Hz, and were later sampled down to 16000Hz, in order to reduce the memory requirements to process and store the data. The sampling rate of 16000Hz is adequate to record insect data, since it can represent frequencies up to 8000Hz2 , and virtually all insect species have wing-beat rates are lower than 1000Hz. In total, we obtained more than 100 hours of recordings, considering all three species. The recordings consist of background noise with occasional “bleeps” that signal the brief instance when an insect crosses the laser 2 Nyquist
frequency.
Algorithm 1 Detector algorithm for wing-beat frequencies Require: A sound data vector s A window size ws A step size ss A minimum interest frequency minf = 100 Hz A maximum interest frequency maxf = 1000 Hz 1: sz = Znormalize(s) 2: for i = 1 to length(sz ) - ws step ss do 3: window = sz (i : i + ws ) 4: f = fft(window) 5: d(i:i + ws ) = max(abs(f (minf :maxf ))) 6: end for 7: return d 1800 1600
Number of one-second fragments
path. In a handful of cases where the insect pauses for a longer time in the path of the laser light, we can distinctly hear the buzz of the bee or the much higher bombination of a mosquito (Youtube sound samples from our sensor are here [6]). Our first step is to design a wing-beat detector, whose purpose is to detect data fragments containing wing-beat bleeps and discard all background noise. The general idea of the wing-beat detector is shown in Figure 3. Our implementation simply applies a sliding window to the data, and calculates the spectrum of the signal inside the window. As most insects have wing-beats in the range from 100Hz to 1000Hz, we used the maximum magnitude of the signal spectrum in this range as a detector confidence. Therefore, the higher the magnitude of the signal in the range, more confident we are that the signal is not a background noise. All magnitude values higher than a userspecified threshold are considered an insect event. The high signal-to-noise ratio of the data collected by our sensor allows the user to set low threshold values in order to guarantee the identification of low amplitude and/or short bleeps, without the risk of false-positives. Figure 3 illustrates how the detector works.
1400 1200 1000 800
Culex quinquefasciatu
Aedes aegypti
600 400
Bombus impatiens
200 0 100
200
300
400
500
600
700
800
900
Frequency (Hz)
Figure 4. Histogram of one-second fragments for three species: Bumble impatiens, Culex quinquefasciatus and Aedes aegypti w
DFT
Time
Low Confidence
w
High Confidence
…
DFT
Frequency
Time
Frequency
Threshold
0
0.5
1
1.5
2
2.5
3
3.5
Time (s)
Figure 3. A sliding window sweeps across a 3.5 second signal gathered from Bumblebees. At each step, the signal spectrum is computed and the maximum signal magnitude in the range of 100Hz to 1000Hz is recorded (top). The detector is constituted of the maximum values for each window, and a threshold is used to distinguish between background noise and wingbeat signal (bottom)
Although the detector algorithm is straightforward, for concreteness we outline the code in Algorithm 1. The final data preprocessing step consisted in extracting data fragments with individual insect events using the detector output. As the insect events have different durations, we decided to extract one-second fragments. Such fragments are long enough to store most bleeps, which typically last for one or two tenths of a second. Note that as the insect events might happen with any time interval between them,
we cannot guarantee that each one-second fragment has only one insect event. However, we can guarantee that each fragment has at least one event. We ended up with a data set with 5982 one-second fragments. Table I presents some descriptive statistics about the data. We have not yet measured the sensitivity and specificity of our extraction method, since this will require obtaining ground truth (possibly by having humans annotate videos recorded in parallel with our sensors). However the extraordinarily high signal-to-noise ratio and our personal experience suggest that both false positives and false negatives will be exceedingly rare. IV. C LASSIFYING DATA USING W ING - BEAT F REQUENCY In our first experiment, we would like to evaluate how well we can classify the data using wing-beat frequency alone. Figure 4 shows a plot of the wing-beat frequency histogram for all three species. From Figure 4 we can observe that the distribution for all classes resembles a Gaussian distribution with a long left tail. The Bumblebee wing-beat frequencies are linearly separable from the mosquitoes frequencies, an expected result since the Bumblebees are considerably larger than the mosquitoes, and larger insects usually have lower wingbeat frequencies. Turning our attention to just the wingbeat frequencies of the mosquitoes, Aedes aegypti has higher
Table I DATA SUMMARY DESCRIPTION Number of Time Series
Length of Time Series
5982
1600
Classes Bumble impatiens Culex quinquefasciatus Aedes aegypti
Class Distribution 499 4252 1231
frequency wing-beats than Culex quinquefasciatus; however, there is some overlap between the wing-beat frequency distribution of these two species. We can use a very simple Bayesian classifier combined with a maximum a posteriori (MAP) decision rule. The general idea of the MAP decision rule is to classify an input insect, with a given wing-beat frequency v, with the class with highest a posteriori probability: cM AP = argmax P (c|f = v) c∈C
where, C is the set with all classes, and f is random variable for the wing-beat frequency, and v is a measured wing-beat value for the test example. We can use the Bayes rule to calculate the a posteriori class probabilities, P (c|f = v): cM AP = argmax c∈C
P (f = v|c)P (c) P (f = v)
Class Distribution (%) 8.34% 71.08% 20.58%
Class Mean (Hz) 173.76 528.12 644.76
Class Std Dev (Hz) 26.42 62.67 34.86
A. Meteorological Features Temperature, air pressure and humidity are the three most important meteorological variables effecting insects. The relevance of these variables for insect classification is twofold. Firstly, certain species are more adapted to survive in determined environmental conditions, for instance, many mosquito species are native to tropical and subtropical regions, where the climate is typically warm and wet. Therefore, periods of warm and humid climate should increase the class prevalence of those species. The second reason is that (at least) temperature influences insects metabolism and the aerodynamic properties of the air. In particular, we expect wing-beat frequency increases with temperature. There is significant research that suggests that the effect of temperature is linear across a wide range of temperature for most insects [7]. Figure 5 shows an early example of such data. Fortunately, it is trivial to collect such data by augmenting our sensors.
We can drop P (f = v) since it is a constant independent of c, leading to:
233
216
c∈C
We will assume that the wing-beat frequencies are normally distributed for each species. Therefore, we can estimate the P (f = v|c) quantity given the Gaussian curve equation: P (f = v|c) = p
1 e 2πσc2
(v−µ )2 − 2σ2c c
where, µc and σc2 are the means and variances of wing-beat frequencies considering for each class c. These parameters, as well as the classes prior probabilities, P (c), can be estimated from data, as shown in Table I. We applied this simple MAP Bayesian classifier to the data and obtained a respectful 96.04% accuracy. The results for each class are summarized in Table II. V. AUGMENTING THE S ENSOR BY A DDING F EATURES In the previous section, we showed how the wing-beat laser sensor can be used to classify insects. The results are encouraging and we are currently collecting data for additional species. As we consider a larger number of species, it is clear from the pigeonhole principle that to classify those species with high accuracy it will require additional features. In this section we discuss some possibilities.
Wing-beat Frequency (Hz)
cM AP = argmax P (f = v|c)P (c) 200
183
166
150
133
116
Figure 5. A figure from a sixty-year-old paper [7] showing a linear relationship between temperature and wing beat frequencies of two “races” (in modern usage, subspecies) of Drosophila pseudoobscura
B. Speed and Direction We are developing a second version of our sensor that can estimate the speed and direction of motion. The design consists of two sensors positioned side-by-side, as illustrated in Figure 6. When a mosquito crosses the two lasers, we can estimate its speed and direction of motion using the time difference in which the mosquito was detected by each sensor. The speed is useful because insects fly at different speeds, from a brisk 10 meters per second of bees, to a leisurely 0.5 meters per second recorded for small
Table II P ERFORMANCE SUMMARY FOR EACH INSECT SPECIES
Actual
Predicted Bumble impatiens Culex quinquefasciatus 499 0 0 4139 0 124
Bumble impatiens Culex quinquefasciatus Aedes aegypti
mosquitoes. The direction is useful because insects may fly in a certain direction (i.e. towards water) at certain times of the day.
Class accuracy Aedes aegypti 0 113 1107
100.00% 97.34% 89.92%
time day (circadian) patterns, which as we will see, are of particular interest. VI. I NCORPORATING C IRCADIAN F EATURES
Laser Source
Laser Source
Mosquito Detected
0
500
1000
Figure 6. A “stereo” version of our sensor that can estimate speed and direction of motion
The fact that some mosquitoes are more active at certain times of the day was known in antiquity, and has been the subject of extensive research for almost one hundred years [9]. Insects may be diurnal (active during daylight hours), nocturnal (active at night) or, particularly for mosquitoes, they may be crepuscular (active at dawn/dusk). Within crepuscular, insects may be matinal or vespertine, denoting species active only in the dawn or only in the dusk, respectively. In Figure 7 we see the flight activity of the Aedes aegypti which shows a classic crepuscular circadian rhythm. Aedes aegypti (yellow fever mosquito)
C. Intrinsic Features Currently we are only exploiting with wing-beat frequencies; however, there are additional features that can be extracted from wing-beat data, some of which may be useful here. Insects have anatomical differences that may cause small variation on the shape of the time series gathered by our equipment. For instance, most insects have two pairs of wings, referred as forewings and hindwings, and a few of them have just one pair, lacking the hindwings. Yet other species have very small hindwings used mostly for flight stabilization, as in the case of houseflies. In addition, there are hundreds of audio features that can be extracted from the sound files. Given the enormous search space of possibilities, we are currently crowdsourcing this sub-problem. We will make public all data we are collecting in [6] and will invite other researchers to evaluate their techniques in our data. D. Spatiotemporal Features Our sensors must be placed somewhere in space and time, and this spatiotemporal data offers potentially useful features [8]. In essence, the spatiotemporal features change the prior probability of a particular species appearance in our sensor streams, and we can incorporate such information into our model. The spatial features include altitude, distance to freshwater, land cover type, mean wind speed, human/livestock population density, local agricultural type, etc. The temporal features include both time of year and
0 0
Midnight
dusk
dawn 12
Noon
24
Midnight
Figure 7. The flight activity of Aedes aegypti shows a classic crepuscular circadian rhythm, with the insect most active just after dawn and just before dusk
Figure 8 gives the intuition as to how we can leverage off the circadian features. Suppose that in the three-class problem of classifying an insect as Aedes aegypti, Culex quinquefasciatus or Anopheles stephensi we measure the wing-beat frequency as 428hz. Using just wing-beat frequency, the insect is exactly equally likely to be either Anopheles stephensi or Culex quinquefasciatus. However, if the insect was observed at 11:00am, we can now see that it is much more likely to be a Anopheles stephensi. We are currently collecting data annotated with temporal and wing-beat frequency information for species of interest, and we have negotiated the purchase of an archive of circadian mosquito data collected over forty years. However, we can perform here an exercise to evaluate the extent that machine learning systems would be benefited by learning from both, circadian and wing-beat, features. We used data generated from real distributions available in the literature for wing-beat frequencies [7] and circadian rhythms [10]
700 400
500
600
VII. C ONCLUSION AND F UTURE W ORK We have shown how inexpensive sensors can be used to obtain data that allow us to classify flying insects. We have further shown that while simple algorithms that consider just the wing-beat frequency can produce accurate results in species-limited cases, we will need to obtain additional features for real-world deployment. We further believe that our sensors/problem area will open up a wide variety of interesting problems in machine learning, for example dealing with the inevitable concept drift as the seasons change, and how to exploit transfer learning (for example, between agricultural and epidemiological insect classification tasks). To this end, we plan to make 100% of our data and sensor designs available at [6].
0
12
Midnight
Noon
24
Midnight
Figure 8. A scatterplot of wing-beat frequency vs. observation time for 300 examples of Aedes aegypti 4, Culex quinquefasciatus 5 and Anopheles stephensi ◦. An insect observed at 11:00am with a wing-beat frequency of 428Hz is almost certainly an Anopheles stephensi
VIII. ACKNOWLEDGMENTS This work was funded by Bill and Melinda Gates Foundation, NSF awards 0803410 and 0808770 and FAPESP award 2009/06349-0. The first author is in leave from the Instituto de Ciˆencias Matem´aticas e de Computac¸a˜ o, Universidade de S˜ao Paulo, Brazil. R EFERENCES
for the species Aedes aegypti, Culex quinquefasciatus and Anopheles stephensi (cf. Figure 8). Our experiments employ data sets with 1000 examples, two machine learning algorithms (na¨ıve bayes and k-nearest neighbor) and three feature set combinations. In the first, we learned from the wing-beat frequency alone, in the second from the circadian rhythm alone, and in the third from both features. In all experiments we used accuracy obtained with leaving-one-out cross-validation to assess our results. Table III presents our results. The classifiers learned from circadian feature alone presented the lowest accuracies. This is an expected result, since there is a high degree of overlapping among the activity hours of the three species (cf. Figure 8). The classifiers learned from wingbeat frequencies provided considerably higher accuracies. In the final experiment, both classifiers were benefited by using the two features combined, with the naive ba¨ıyes the classifier obtaining the highest accuracy improvement, reaching 93.18%. This is a respectable accuracy result, considering that we are classifying the mosquito species, with similar physical characteristics and activity behaviors, and which even entomologists have difficulty distinguishing. Table III ACCURACY RESULTS FOR k- NEAREST NEIGHBOR AND NA¨I VE BAYES
[1] WHO, “The world malaria report,” World Health Organization, Tech. Rep., 2010, http://www.who.int/malaria/world malaria report 2010/en/index.html. [2] M. Q. Benedict and A. S. Robinson, “The first releases of transgenic mosquitoes: an argument for the sterile insect technique,” Trends in Parasitology, vol. 19, 2003. [3] K. Walker, “A review of control methods for african malaria vector,” Bureau for Global Health, Tech. Rep. 108, 2002. [4] N. Minakawa, G. O. Dida, G. O. Sonye, K. Futami, and S. Kaneko, “Unforeseen misuses of bed nets in fishing villages along lake victoria,” Malaria J., vol. 7, p. 165, 2008. [5] A. Odeke, “Malaria wedding net dress decline,” BBC Focus On Africa magazine, 2005, http://news.bbc.co.uk/2/hi/africa/ 4393375.stm. [6] E. Keogh, “Computational entomology website,” Online, 2011, http://www.cs.ucr.edu/∼eamonn/CE. [7] S. C. Reed, C. M. Williams, and L. E. Chadwick, “Frequency of wing-beat as a character for separating species races and geographic varieties of drosophila,” Genetics, vol. 27, pp. 349–361, 1942. [8] M. Grebler, M. Morand, and B. Naef-Daenzer, “A predictive model of the density of airborne insects in agricultural environments,” Agriculture, Ecosystems and Environment, vol. 123, no. 1-3, pp. 75–80, 2008.
CLASSIFIERS
Features Circadian rhythm Wing-beat frequency Circadian and wing-beat
Na¨ıve Bayes 70.69% 90.73% 93.18%
k-NN 68.50% 91.30% 91.80%
[9] E. Roubaud, “Rhythmes physiologiques et vol spontan chez l’ anopheles maculipennis,” C. R. Hebdomadaires des Seances de l’Academie des Science, vol. 167, pp. 967–969, 1918. [10] B. Taylor, “Biological clocks in mosquitoes,” Website, 1998, http://antbase.org/ants/africa/personal/crhtml/covercr.htm.