plied to discriminate between earthquakes and quarry blasts or other kind of local .... nate VT earthquakes from the other local transient signals. Local signals ...
Bulletin of the Seismological Society of America, Vol. 95, No. 1, pp. 185–196, February 2005, doi: 10.1785/0120030075
Automatic Classification of Seismic Signals at Mt. Vesuvius Volcano, Italy, Using Neural Networks by S. Scarpetta, F. Giudicepietro, E. C. Ezin, S. Petrosino, E. Del Pezzo, M. Martini, and M. Marinaro
Abstract We present a new strategy for reliable automatic classification of local seismic signals and volcano-tectonic earthquakes (VT). The method is based on a supervised neural network in which a new approach for feature extraction from short period seismic signals is applied. To reduce the number of records required for the analysis we set up a specialized neural classifier, able to distinguish two classes of signals, for each of the selected stations. The neural network architecture is a multilayer perceptron (MLP) with a single hidden layer. Spectral features of the signals and the parameterized attributes of their waveform have been used as input for this network. Feature extraction is done by using both the linear predictor coding technique for computing the spectrograms, and a function of the amplitude for characterizing waveforms. Compared to strategies that use only spectral signatures, the inclusion of properly normalized amplitude features improves the performance of the classifiers, and allows the network to better generalize. To train the MLP network we compared the performance of the quasi-Newton algorithm with the scaled conjugate gradient method. We found that the scaled conjugate gradient approach is the faster of the two, with quite equally good performance. Our method was tested on a dataset recorded by four selected stations of the Mt. Vesuvius monitoring network, for the discrimination of low magnitude VT events and transient signals caused by either artificial (quarry blasts, underwater explosions) and natural (thunder) sources. In this test application we obtained 100% correct classification for one of the possible pairs of signal types (VT versus quarry blasts). Because this method was developed independently of this particular discrimination task, it can be applied to a broad range of other applications. Introduction in records of local earthquakes, including volcanic quakes. Other methods that use attributes of the whole seismogram are more effective for solving classification problems related to local and volcano seismicity. Among these, neuralnetwork-based methods have been successfully applied (Falsaperla et al., 1996; Musil and Plesinger 1996; Fedorenko et al., 1999; Tarvainen, 1999; Ursino et al., 2001; Del Pezzo et al., 2003). The reliability of classification techniques is critical for applications devoted to volcano monitoring. The need, in a crisis mode, is to make fast decisions that can affect the public safety. Because of the multitude of different signals generated by volcanoes (e.g., volcanic long-period (LP), hybrid, volcano-tectonic (VT), tremor), robust automatic classification on an ongoing basis is crucial. A robust automatic classification algorithm is especially important when the signals are recorded by local networks with a limited number of sensors. In this case, low energy signals recorded by sin-
Automatic or quasi-automatic techniques able to recognize different classes of seismic signals are used primarily for discrimination between earthquakes and signals caused by artificial explosions. Among the many applications of these techniques, underground nuclear test monitoring, performed in the context of the Comprehensive Test Ban Treaty (CTBT) (Hoffmann et al., 1999), is one of the most important. On a local scale, automatic classification may be applied to discriminate between earthquakes and quarry blasts or other kind of local man-made explosions. The classification problem has been approached using different methods, including statistical analysis (Kushnir et al., 1990; Wu¨ster, 1993; Shumway, 1996; Kushnir et al., 1999), cross-correlation techniques (Joswig, 1990), and Wavelet Bayesian classification (Gendron et al., 2000). Most of these methods are based on attributes of specific seismic phases, which are generally easily observed in records of regional and teleseismic earthquakes, but difficult to detect 185
186
S. Scarpetta, F. Giudicepietro, E. C. Ezin, S. Petrosino, E. Del Pezzo, M. Martini, and M. Marinaro
gle stations may be important manifestations of the ongoing volcanic process, and their classification on the sole basis of the seismogram appearance may be the unique way to discriminate between an internal volcanic and an external or non-natural signal. In synthesis, a robust automatic discrimination algorithm reduces the analyst workload without compromising accuracy of results, allowing the analyst to focus only on the more problematic signals and spend the worktime on high-level analysis and interpretation. The main goal of our work is to develop a highperformance strategy for discriminating local and volcanic earthquakes from other transient signals. Such a strategy could drastically reduce the workload of the community involved in seismological monitoring, and may allow the production of automatic bulletins, with minimal or no review by a seismic analyst. The test area considered for this study is Mt. Vesuvius, a high-risk volcano close to the city of Naples (about 2 million people), in southern Italy (Fig. 1). In this area, VT earthquakes and transient signals due to external sources (man-made underwater explosions, quarry blasts, and thunder) are currently recorded. Our approach in discriminating among these signals follows that of a previous study, in which neural networks were applied to discriminate between VT earthquakes occurring at the Phlegraean Fields caldera (southern Italy) and local man-made underwater explosions (Del Pezzo et al., 2003). In this study, our strategy was improved by using both spectral and waveform features as input for the neural network. This article is organized into six sections. The first provides an overview of the volcanological setting and the characteristics of the activity of Mt. Vesuvius, with emphasis on seismological features. The second section reports information about the seismic network configuration and presents a description of the stations and the data set used for the analysis. The third section focuses on the preprocessing stage, devoted to feature extraction. The fourth and fifth sections explain the neural network architecture, the discrimination strategy, and the performance evaluation of the method. Finally, we discuss the results and conclusions.
Mt. Vesuvius Mt. Vesuvius is a volcanic complex on the west coast of Italy, composed of an older strato-volcano, named Somma, with a summit caldera and a more recent cone (Gran Cono), which has grown inside the caldera. Its eruptive history began more than 25,000 years ago and has been characterized by large plinian eruptions, the most famous of which destroyed the Roman towns of Pompeii and Herculaneum in ad 79. Since that time, the largest eruption occurred in 1631 and was followed by semi-permanent activity that included several medium-sized eruptions over a period of about 300 years. This period ended with the eruption on 18 March 1944, the last eruption of Mt. Vesuvius. Current activity is characterized by a fumarolic field inside the crater, and by moderate seismicity, consisting of a few hundred low
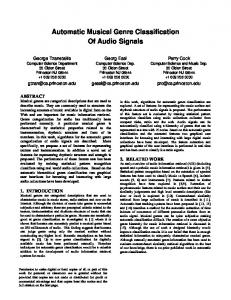
Figure 1. Map of Mt. Vesuvius zone. Elevation contour spacing is 100 m. The heavier black line is the coastline. Slashed zones indicate the highest population density in the urban areas. Dots indicate short-period stations with vertical sensors. Triangles are short-period stations with 3-component sensors; rhomboids are broadband, 3-component stations. magnitude (M ⱕ 3.6) VT (Chouet, 1992) earthquakes per year (Fig. 2). The earthquake locations are highly clustered around the crater area with depths ranging from a few hundred meters to 6 km beneath the “Gran Cono” (Fig. 3). Although Mt. Vesuvius has been dormant since the eruption of March 1944, and shows only moderate signs of activity, its strongly explosive eruptive style, combined with nearby population centers, makes it one of the highest-risk volcanoes in the world.
Data Data are collected by the seismic monitoring network of Vesuvius Observatory, which is composed of both vertical and three-component, short-period, analog stations and digital three-component broadband stations (Castellano et al., 2002) (Fig. 1). The analog signals are telemetered by radio links or by dedicated line to the acquisition center, where they are digitized at 100 Hz sampling frequency and processed by a distributed system for seismic data acquisition and analysis, named SISMI (Sistema Sismometrico Modulare Integrato) (Giudicepietro et al., 2000). In the suite of seismic waveforms usually recorded in the Mr. Vesuvius area, regional and teleseismic events are recorded with an unfavorable signal-to-noise ratio, due to the high background seismic noise level present in the area (Castellano et al., 2002). However, regional earthquakes and teleseismic signals are easily distinguishable from those of local seismicity, due to their lower frequency and longer
Automatic Classification of Seismic Signals at Mt. Vesuvius Volcano, Italy, Using Neural Networks
Figure 2.
187
Histogram of the annual numbers of VT events at Mt. Vesuvius since 1981.
Figure 3. Locations (circles) of the VT earthquakes occurring at Mt. Vesuvius from January to July, 2002. Triangles indicate locations of seismic stations whose names are reported in Fig. 1. The upper-right and lower-left panels are, respectively, the N–S and W–E sections. The lower-right panel represents the distribution of the event depths. Circle size is proportional to magnitude, within the range 1.0–3.0.
188
S. Scarpetta, F. Giudicepietro, E. C. Ezin, S. Petrosino, E. Del Pezzo, M. Martini, and M. Marinaro
duration. For this reason they are not considered in the automatic classification task, whose main goal is to discriminate VT earthquakes from the other local transient signals. Local signals recorded in the Vesuvius area that we will address include: (1) VT earthquakes; (2) man-made underwater explosions due to bomb fishing; (3) quarry blasts in pyroclastic caves; (4) quarry blasts in limestone caves; and (5) thunder. The relative frequency distribution of these types of events is shown in Figure 4. Some examples of waveforms, and histograms of their hourly occurrence, are shown in Figure 5. VT earthquakes dominate the local seismicity at Vesuvius. They occur in the crater area, with hypocenters not deeper than 6 km below sea level (Del Pezzo et al., 2004) and duration magnitudes between �0.2 and 3.6 (Del Pezzo and Petrosino, 2001), as shown in the example of Figure 3. Generally, lower magnitude VT earthquakes are recorded only by the summit stations BKE and OVO, with S–P times compatible with a location at a depth of 2–3 km beneath the craters. The most energetic VT events are well recorded by all the stations of the seismic network. P-wave onsets arrive first at the summit stations, showing time delays from about 0.1 to 0.5 sec among the different sensors. Fourier spectra of seismic velocity signals for the VT earthquakes recorded at station BKE show predominant peaks in the 10–16 Hz frequency band, as can be deduced from the spectrograms reported in Figure 5. Hourly distribution of the earthquakes shows a minimum around midday. Although the observed distribution could be interpreted as an effect of noise-level fluctuations associated with the daily trend of the cultural activities (Saccorotti et al., 2001), some authors (Marzocchi et al., 2001) have suggested that the periodicity of the seismic activity is related to thermal diurnal processes. Underwater explosions are strongly correlated with anthropic activity, because they are mostly recorded on working days (from Monday to Friday). The blasts associated with illegal explosive fishing generally occur during the night and early morning. The signals are well recorded by stations located near the coast (CPV and TDG). The most energetic explosions are also recorded by the summit stations BKE and OVO, 4 km inland from CPV. Time delays of direct P waves (compared to CPV) range from 1 to 3 sec, depending on the location of the source, indicating that the wave fronts propagate in shallow low-velocity layers. The waveforms associated with the blasts recorded at CPV station show a first high-frequency (12–20 Hz) group arrival, followed by a wave packet having a lower frequency content (2–6 Hz), similar to the signals of the same origin recorded near the coast of the Phlegraean Fields area (Del Pezzo et al., 2003). Other kinds of explosions are those associated with the activity of cave extraction near stations TRZ and NL9. The histogram of occurrence times shows that the blasts recorded at TRZ occur during daytime hours, only on working days. The velocity spectra of the explosions are characterized by a broad frequency content in the 2–10 Hz band, as can be
Figure 4.
Percent distribution for the different types of local transient signals recorded at Mt. Vesuvius. VT, VT earthquakes; SP CPV, man-made underwater explosions (CPV station); SP NL9, quarry blasts in limestone caves (NL9 station); SP TRZ, quarry blasts in pyroclastic caves (TRZ station). Numbers below the labels indicate the percentages for each signal type.
deduced by the spectrograms reported in Figure 5. The most energetic explosions are also recorded at station BKE, with a time delay of about 2–2.5 sec with respect to TRZ station. Station NL9 records seismic signals associated with mining activity in the Nola area. The blasts (generally one or two per day) occur during working days in a limited time range (from 16:00 to 18:00). Generally, the spectra of the NL9 quarry blasts show marked peaks in the 2–10 Hz frequency band. During strong storms, station BKE sometimes records seismic waveforms associated with thunder. Generally the seismic signals produced by these external sources are grouped into small temporal sequences lasting several minutes. The Fourier spectra of the signals generated by thunder show a high-frequency content, with predominant spectral peaks in the 12–18 Hz frequency band. For this type of signal the onset times are not picked by the analysts; therefore, it has not been possible to plot a histogram of hourly distribution. The analysts classify all the seismic signals described above primarily on the basis of the shape of the envelope and the predominant frequency.
Data Analysis The data set used for the analysis consists of about 270 signals for each station, composed of earthquakes and other signals generated by natural or artificial sources. To reduce the data set size required for training the neural network, we divided the problem of discriminating among several classes into several elementary tasks, each focused on discriminating between only two classes of events recorded at a single station. For each single station, a specialized automatic dis-
Automatic Classification of Seismic Signals at Mt. Vesuvius Volcano, Italy, Using Neural Networks
Figure 5. Typical waveforms (left panels) and hourly distribution (right panels) of: (a) VT earthquakes (recorded at BKE); (b) blast fishing signal (CPV); (c) quarry blast in pyroclastic caves (TRZ); (d) quarry blast in limestone caves (NL9). The lower panel (e) shows the waveform of a thunder sequence recorded at BKE.
189
190
S. Scarpetta, F. Giudicepietro, E. C. Ezin, S. Petrosino, E. Del Pezzo, M. Martini, and M. Marinaro
criminator is trained and two classes of signals are discriminated: • CPV station. This station is located on the coast of the Gulf of Naples. It records earthquake signals and mainly man-made underwater explosions made by fishermen. The available dataset contains 144 earthquake events and 167 underwater explosion event recordings. • NL9 station. This station, located at Nola, records seismic signals consisting largely of earthquakes and quarry blasts. The dataset has 114 earthquake events and 109 quarry blast event recordings. • TRZ station. This station also records signals of earthquakes and quarry blasts. The dataset has 106 earthquake events and 101 quarry blast recordings. • BKE station. This station is located on Vesuvius, close to the crater. It records mainly earthquake events and natural false events such as thunder. The dataset has 72 earthquake events and 68 thunder recordings. For each event recording, a time window of 20 seconds is selected, starting from the P-arrival onset time (which is manually picked by the analysts). Since the sampling frequency is 100 Hz, each event is composed of 2000 points. Five/eight of the data recorded by each station is used for the training phase (the training set) and the remaining novel data are used for evaluating the network performance and its generalization capability (the test set). Table 1 gives a description of the training set and the testing set available for each of the four stations.
M
s¯n �
兺
ck sn�k ,
where ck are the predictor coefficients and M is called the model order. In the frequency domain, this is equivalent to modeling the signal spectrum by an all-pole filter. The estimate of the coefficients ck is derived by an optimization procedure, based on the evaluation of the error function E � Rn (s¯n � sn)2, where sn is the signal and s¯n is the model at the discrete time n. The search for the vector c, which minimizes the error E, is performed iteratively, updating the M coefficients ck. Looking at the residual error as a function of the number M of coefficients, the optimal number of predictive coefficients can be estimated via a tradeoff between the loss of information and the compactness of the representation. The choice of the model order, M, is problemdependent. In our case, we found that about 6 or 7 parameters from each 2.56-sec-long signal segment were sufficient for obtaining a good encoding. This can be seen in Figure 6, where the residual error, averaged over all the data sets, is displayed as a function of the number M of coefficients. By increasing M, the residual error decreases (since the information content of the coding increases); however the dimensionality of the representation increases, and therefore it increases also the complexity of the neural network. We check empirically that for the CPV discrimination task using M � 7 the network gives a better discrimination result on average then when using M � 6, while for all other stations we use M � 6, since using M � 7 doesn’t improve the performance significantly (but increases the complexity of
Feature Extraction The feature extraction stage (usually named preprocessing) is critical for the success of a discrimination task. Many different techniques or algorithms have been proposed in literature for feature extraction, such as principal component analysis (Bishop, 1995), independent component analysis, etc., for different tasks. We use the linear prediction coding (LPC) of Makhoul (1975) to extract spectral features, and we employ a signal parametrization in the time domain to extract information about the waveform. The extracted features form the input of the neural network in the discrimination stage. The linear prediction technique models each signal sn as a linear combination of a certain number, M, of its past values, as
Table 1 Training and Test Set, for Each Station Station
Training Data
Testing Data
Total
NL9 CPV TRZ BKE
139 194 129 88
84 117 78 52
223 311 207 140
(1)
k�1
Figure 6. Residual error of the linear prediction coding, averaged over all the dataset, as a function of the model order M.
191
Automatic Classification of Seismic Signals at Mt. Vesuvius Volcano, Italy, Using Neural Networks
the neural model). Therefore, for stations NL9, BKE and TRZ, we extract from the signals M � 6 LPC coefficients (and M � 7 for CPV station) for each of the nine partially overlapping sliding Hanning window of 2.56 sec time length. Although LPC efficiently encodes the frequency features of the signal, we would lose much of the information content of the time-domain signal if we discharge the waveform information (i.e., the shape of the signal in terms of amplitude versus time). Indeed, waveform information is usually used by analysts to classify signals. Therefore, in contrast to previous work (Del Pezzo et al., 2003; Esposito et al., 2001), we also include as input to the MLP a discretized waveform parametrization, fm. We use the discretized waveform parametrization of only the first 16 seconds of the selected time windows for all signals at stations NL9, CPV, and TRZ, except for signals registered at station BKE (VT versus thunder), where we note that using all 20 seconds improves significantly the performance of the network. We compute a parameter fm for each of the one-second length time window Wm , as fm �
(maxi僆Wm[si] � mini�Wm[si]) � N 兺Nn�1 (maxi僆Wn[si] � mini�Wn[si])
(2)
m � 1, ...., N . In this way, we extract a vector of N � 16 components (N � 20 for BKE) to encode the waveform features (Fig. 7). This results in an input vector of 54 � 16 components (63 � 16 for CPV, 54 � 20 for BKE) for each signal (instead of 1600 raw values), where 54 � 6 � 9 elements from the LPC coding and 16 from the waveform parametrization. The normalization of the waveform parametrization (i.e., the choice of the denominator in Equation [2]) is critical for the discrimination performance; if the two types of features (LPC and waveform) are of different orders of magnitude, we observe that network performance is poorer. We normalize the waveform parametrization such that the sum of all N values is 1, so that both the spectral and waveform input values for the neural network are of the same orders of magnitude. Discrimination Strategy Neural networks are adaptative nonlinear systems that can be used as automatic classifiers when properly trained on a labeled set of preprocessed data (training set). The performance of the classifier must be tested on an independent set of preprocessed data (test set). In this study, to discriminate the two classes of events registered at each station, we use a neural network with a multilayer perceptron (MLP) architecture (Bishop 1995). Each MLP network is trained over the preprocessed training set specific to its station (Table 1). The network architecture (Fig. 8) has one hidden layer with H hidden nodes, I input nodes, and one output node, such that the output is given by
H
y�r
冢兺
i�1
I
冢 兺 W x 冣冣
wi tanh
ij
j
(3)
j�1
1
where r(v) ⬅ 1 � exp � v and tanh(v) are the nonlinear activation functions of the output and hidden layer, respectively. Here, v represents a hidden variable, and Wij and wi are the weights optimized during the training procedure. The I input components x1, . . .xj, . . .xI are the features extracted in the preprocessing stage, where I � (6 � 9 � 16) � 70 for TRZ and NL9; I � (7 � 9 � 16) � 79 for CPV; and I � (6 � 9 � 20) � 74 for BKE. The number of hidden nodes, after a series of trial and error processes, was fixed to H � 4, except for the neural network trained at station TRZ where H � 5. Binary target values are used (1 for one class and 0 for the other). A new pattern is classified employing the discrimination y ⬎ 0.5. It is known (Hertz et al., 1991, Bishop, 1995) that, when a cross-entropy error function and sigmoidal output function are used in a binary problem, one can interpret the network output y 僆 [0, 1] as a quantitative estimate of the probability that a given pattern belongs to the class “1.” This is not allowed when the conventional mean square error function is used. Therefore, we use the cross-entropy error function (Van Ooyen and Nienhus, 1992) in the training phase rather than the conventional mean square error function. Based on information-theoretic measures, the cross-entropy error function is given by E � �tln(y) � (1 � t) ln (1 � y) ,
(4)
where the t � {0, 1} is the target and y the network’s output. In such a way, we avoid one of the main drawbacks of conventional neural network, since we are able to provide a way of estimating solution uncertaninty. Indeed, 0 ⬍ 2|y � 0.5 | ⬍ 1 gives the degree of confidence of the automatic classification result. Many training algorithms used in neural network theory involve taking a sequence of steps through weight space. With simple gradient descent, the direction of each step is given by the local negative gradient of the training error function and the step size is determined by an arbitrary learning rate. A better procedure would be to exploit information from the second derivatives of the training error function. This forms the basis idea for several second-order algorithms, which are considerably more efficient and fast than the gradient descent; among these are the quasi-Newton algorithm and the scaled gradient descent method. The quasiNewton algorithm adjusts the direction of descent by using an approximation of the Hessian matrix, updated at each iteration (Bishop, 1995). The basic idea of the scaled conjugate gradient algorithm introduced by Moller (1993), is to combine the conjugate gradient approach (Shewchuk, 1994) with a step-size scaling mechanism that avoids a time consuming line-search per learning iteration, and makes the algorithm faster than conjugate gradient and other secondorder algorithms.
192
S. Scarpetta, F. Giudicepietro, E. C. Ezin, S. Petrosino, E. Del Pezzo, M. Martini, and M. Marinaro
Figure 7. Figure represents the features extracted from (a) VT earthquake at BKE, (b) thunder at BKE, (c) underwater explosion at CPV, and (d) quarry blast in a limestone cave at NL9. In each panel, the upper plot represents the trace; the middle plot is the spectrogram (LPC); and in the lower plot the fm parameter of equation (2) is plotted as a function of the lapse time.
Results We trained the MLP network using input features described in the third section, using both algorithms described in the previous section, and we evaluated the percentage of correct classification on the test set. The best performance obtained on the test set, after training, is shown in Table 2 for each of the four MLP networks (NL9, BKE, CPV, TRZ). As shown in Table 2, the computational time required for the scaled conjugate gradient algorithm is less than that required for the quasi-Newton method, while both algorithms give similar good performance. Confusion matrices (of the networks trained using quasi-Newton algorithm) indicating how many test data of class 0 or 1 have been misclassified, and how many have been classified correctly, are shown in Figure 9. We also show the corresponding distribution of the network outputs y for the two classes of events. In Figure 10,
histograms of the value of y are shown both for the training events and the test events, for each of the four networks. Notably, the network output for most of the events approaches the desired target values (1 for one class and 0 for the other) and is far from the value 0.5 that correspond to uncertainty. This supports the reliability of the method. From Figure 10 we see that most of the patterns are classified by the network with a high degree of confidence 0 ⬍ 2|y � 0.5| ⬍ 1. To further assess the network generalization capabilities, five different data sets, each composed of a training and a test set, were obtained through a permutation of all the available data, and the network was separately trained and tested on each of them. The percentage of correct classification given for each of the five test sets (that are data new to the network, since they have not been used for training) are very similar to one another. The average network per-
193
Automatic Classification of Seismic Signals at Mt. Vesuvius Volcano, Italy, Using Neural Networks
Table 2 MLP Network Performance (percentage of correct classification on the test sets) using the scaled conjugate gradient descent algorithm and the quasi-Newton method for the discrimination of the two classes of events recorded at the four stations. Computational time required for the training on a Pentium III with 600 Mhz and 128M of RAM is also shown. Test set sizes are shown in Table 1.
Figure 8.
Pictorial view of the discrimination strategy. Spectral and waveform features, extracted via LPC and discretized amplitude parametrization, form the input of the MLP neural network trained to perform a two-class automatic discrimination.
Station
Algorithm
Computational Time
Performance
Error
NL9
Scaled CGD Quasi-Newton
2.7 s 8.2 s
100% 100%
0% 0%
CPV
Scaled CGD Quasi-Newton
2.8 s 8.7 s
98% 99%
2% 1%
TRZ
Scaled CGD Quasi-Newton
2.9 s 10.7 s
94% 95%
6% 5%
BKE
Scaled CGD Quasi-Newton
1.5 s 6.3 s
98% 98%
2% 2%
Figure 9. Confusion matrices (misclassified versus correctly classified data in the test set) of the four network classifiers at the four stations used (NL9, CPV, TRZ, BKE).
194
S. Scarpetta, F. Giudicepietro, E. C. Ezin, S. Petrosino, E. Del Pezzo, M. Martini, and M. Marinaro
Figure 10.
For each of four network classifiers (NL9, CPV, TRZ, BKE) the histogram of the output (y) of the network after training is shown. The network output for most events is far from 0.5 and approaches the desired target value. Class with target 0 includes earthquakes and the one with target 1 includes other events on the training and test events.
formace, obtained by averaging the percentage of correct classification of the five differently trained networks, is 99% at NL9, 97% at CPV, 94% at TRZ, and 96% at BKE. The dispersion around the average was small, indicating a good degree of confidence of the measured performance. Notably this neural strategy gives very good results, both with artificial false events (quarry and sea-side explosions at CPV, TRZ, NL9) and natural (thunder at BKE) false events. For comparison, we also compute the best result obtained on CPV data using LPC coefficients alone as input to the network without the waveform parametrization, and we reach a performance of 97% (test size 117) or lower. It means that no fewer than 3 data (out of 117) instead of 1 (out of 117) have been misclassified by the classifier that uses LPC coefficients alone. The best result obtained on CPV
data using the waveform alone has 94% correct classification (corresponding to seven misclassifications on 117 test data). This means that both the input related to the waveform features and the input related to the spectral features coded in the LPC provide a significant contribution to information content relevant for the discrimination, and play a critical role in obtaining a reliable system. The introduction of the waveform features, not exploited in the previous studies (Del Pezzo et al., 2003; Esposito et al., 2001), allows us to get an automatic discrimination system reaching a performance of 100% on the NL9 data set and 99% on the CPV data set, which is more accurate than that based only on spectral discrimination. This new approach improves and validates the discrimination strategy for different classes of false events, such as explosions in quarries and natural non-earthquake sources.
Automatic Classification of Seismic Signals at Mt. Vesuvius Volcano, Italy, Using Neural Networks
Discussion and Conclusions We have developed and tested a successful strategy for classifying different types of seismic signals recorded by the monitoring network at Mt. Vesuvius. Following our previous study, using data from the Phlegraean Fields (Del Pezzo et al., 2003), we have approached this problem using neural networks. One of the advantages of this approach is that it can use the whole seismogram, instead of attributes of particular phases, which usually cannot be detected in the records of local earthquakes. A new method for feature extraction has been introduced. It is based on the combination of a waveform parameterization in the time domain, and LPC algorithm that provides compressed and robust data representation in the frequency domain. Automatic classification has been performed using a multilayer perceptron trained with the quasiNewton algorithm and the scaled conjugate gradient descent, which has been found to be a fast algorithm. This strategy gives very good results, achieving performance ranging from 95% to 100% correct classification (on the test set) for different stations. The data sets used for the present study were recorded at Mt. Vesuvius over the last three years and include VT earthquakes and transient signals due to other sources such as underwater explosions, quarry blasts, and thunder. To reduce the data set size required for training the network, we divided the problem of discriminating among several classes into elementary tasks focused on discriminating between two classes of events recorded at single stations. For each single station, a dicotomic specialized automatic discriminator is trained. This not only reduces the number of records required for the analysis, but also in some cases can allow us to address the trade-off between source and path effects that affect the shape of the waveform. Local signals can be strongly affected by path effects, and can show different features in seismograms recorded at different stations. For example, this is the case of the underwater explosions caused by blast fishing in the Gulf of Naples, discussed in Del Pezzo et al. (2003). These explosions appear very similar to earthquakes at some stations, whereas they show a characteristic signature, with a low-frequency wave packet, at other stations. By adopting the station-specialized neural discriminators trained for distinguishing two different types of signals, it is possible to discriminate among several kinds of signals. The set of the outputs from the different discriminators may be viewed as an information vector on which a second simple neural network might be trained to get a single classification output. In the future, we will focus on this aspect to define an appropriate technique for discriminating among different combinations of the results from our automatic classifiers. Our goal is to integrate these methods into the monitoring system of the high risk volcanoes of Mt. Vesuvius and Phlegraean Fields. Moreover, the implementation of such a method not only can reduce the routine and repetitive work required for analyzing data, but also can be used
195
to establish standalone monitoring systems. Such systems might be able to collect, classify, and process data without human analyst review in regions with unfavorable natural conditions, such as many active volcanoes in the world. Finally, our results suggest that this strategy may be able to discriminate among other different types of seismic signals related to volcanic activity. We hope to test this hypothesis using data recorded during a volcanic unrest.
Acknowledgments Charlotte Rowe is gratefully acknowledged for the critical revision of the manuscript and for many helpful suggestions. We also thank the anonymous reviewers for the usefull comments and suggestions. This manuscript was prepared with AGU’s LATEX macros v5, with the extension package ‘AGU��’ by P. W. Daly, version 1.6b from 1999/ 08/19.
References Bishop, C. (1995). Neural networks For Pattern Recognition, Oxford Univ. Press. Castellano, M., C. Buonocunto, M. Capello, and M. La Rocca (2002). Seismic surveillance of active volcanoes: the Osservatorio Vesuviano Seismic Network (OVSN Southern Italy), Seism. Res. Lett. 73, 177– 184. Chouet, B. A. (1992). A seismic model for the source of long-period events and harmonic tremor, in Volcanic Seismology, P. Gasparini, R. Scarpa, and K. Aki (Editors), IAVCEI Proceedings in Volcanology, Vol. 3, Springer-Verlag, Berlin, 23 pp. Del Pezzo, E., and S. Petrosino (2001). A local-magnitude scale for Mt. Vesuvius from synthetic Wood-Anderson seismograms, J. Seism. 5, 207–215. Del Pezzo, E., F. Bianco, and G. Saccorotti (2004). Seismic source dynamics at Mt. Vesuvius volcano, Italy. J. Volcanol. Geoth. Res. 133, 23–39. Del Pezzo, E., A. Esposito, F. Giudicepietro, M. Marinaro, M. Martini, and S. Scarpetta (2003). Discrimination of earthquakes and underwater explosions using neural networks, Bull. Seism. Soc. Am. 93, 215–223. Esposito, A., M. Falanga, M. Funaro, M. Marinaro, and S. Scarpetta (2001). Signal Classification using Neural Networks, in Proceedings of WIRN ’01 (Workshop Italiano Reti Neurali) 17–19 May 2001, Vietri, pp. 187–1192. Falsaperla, S., S. Graziani, G. Nunnari, and S. Spampinato (1996). Automatic classification of volcanic earthquakes by using multi-layered neural networks, Natural Hazards 13, 205–228. Fedorenko, Y., E. S. Husebye, and B. O. Ruud (1999). Explosion site recognition: neural net discriminator using single three-component stations, Phys. Earth Planet. Interiors 113, 131–142. Gendron, P., J. Ebel, and D. Manolakis (2000). Rapid joint detection and classification with wavelet bases via bayes Theorem, Bull. Seism. Soc. Am. 90, 764–774. Giudicepietro, F., W. De Cesare, M. Martini, and V. Meglio, (2000). Il Sistema Sismometrico Modulare Integrato (SISMI). Open-File Report Osservatorio Vesuviano INGV, no. 6, 2000 (in Italian). Hertz, J., A. Krogh, and G. Richard (1991). Introduction to the Theory of Neural Computation, Addison-Wesley, Redwood City. Hoffmann, W., R. Kebeasy, and P. Firbas (1999). Introduction to the verification regime of the Comprehensive Nuclear-Test-Ban Treaty, Phys. Earth Planet. Int. 113, 5–9. Joswig, M. (1990). Pattern recognition for earthquake detection, Bull. Seism. Soc. Am. 80, 170–186.
196
S. Scarpetta, F. Giudicepietro, E. C. Ezin, S. Petrosino, E. Del Pezzo, M. Martini, and M. Marinaro
Kushnir, A. F., V. M. Lapshin, V. I. Pinsky, and J. Fyen (1990). Statistically optimal event detection using small array data, Bull. Seism. Soc. Am. 80, 1934–1950. Kushnir, A. F., E. V. Troitsky, L. M. Haikin, and A. Dainty (1999). Statistical classification approach to discrimination between weak earthquakes and quarry blasts recorded by the Israel Seismic Network, Phys. Earth Planet. Int. 113, 161–182. Makhoul, J. (1975). Linear Prediction: A Tutorial Review, in Proceedings of the IEEE 63. Marzocchi, W., G. Vilardo, D. P. Hill, G. P. Ricciardi, and C. Ricco (2001). Common features and peculiarity of the seismic activity at Phlegraean Fields, Long Valley, and Vesuvius. Bull. Seism. Soc. Am. 91, 191– 205. Moller, M. (1993). A scaled conjugate gradient algorithm for fast supervised learning, Neural Networks 6, 525–533. Musil, M., and A. Plesinger (1996). Discrimination between local microearthquakes and quarry blasts by multi-layer perceptrons and kohonen maps, Bull. Seism. Soc. Am. 86, 1077–1090. Saccorotti, G., R. Maresca, and E. Del Pezzo (2001). Array analyses of seismic noise at Mt. Vesuvius volcano, Italy, J. Volcanol. Geotherm. Res. 110, 79–100. Shewchuk, J. R. (1994). An Introduction to the Conjugate Gradient Method Without the Agonizing Pain, Technical Report CMU-CS-94-125, Carnegie Mellon University, Pittsburgh. Shumway, R.H. (1996). Statistical Approaches to Seismic Discrimination, in Monitoring a Comprehensive Test Ban Treaty, E. S. Husebye and A. M. Dainty (Editors), NATO Advanced Science Institute Series, Kluwer Academic Publishers, Boston, 791–803. Tarvainen, M. (1999). Recognizing explosion sites with a self-organizing network for unsupervised learning, Phys. Earth Planet. Int. 113, 143– 154.
Ursino, A., H. Langer, L. Scarfı`, G. Di Grazia, and S. Gresta (2001). Discrimination of quarry blasts from tectonic microearthquakes in the Hyblean Plateau (Southeastern Sicily), Annali di Geofisica 44, 703– 722. Van Ooyen, A., and B. Nienhuis (1992). Improving the convergence of the backpropagation algorithm, Neural Networks 5, 465–471. Wu¨ster, J. (1993). Discrimination of chemical explosions and earthquakes in central europe—a case study, Bull. Seism. Soc. Am. 83, 1184–1212. INFM & Dipartimento di Fisica “E. R. Caianiello” Universita di Salerno Baronissi (SA) Italy (S.S., M.M.) International Institute for Advanced Scientific Studies Via G. Pellegrino 19 84019 Vietri Sul Mare (SA) Italy (E.C.E, M.M.) Institut de Mathematiques et de Sciences Physiques BP 613 Porto-Novo, Benin (E.C.E) Osservatorio Vesuviano INGV, Napoli, Italy (E.C.E., S.P., E.D.P., M.M.)
Manuscript received 17 April 2003.